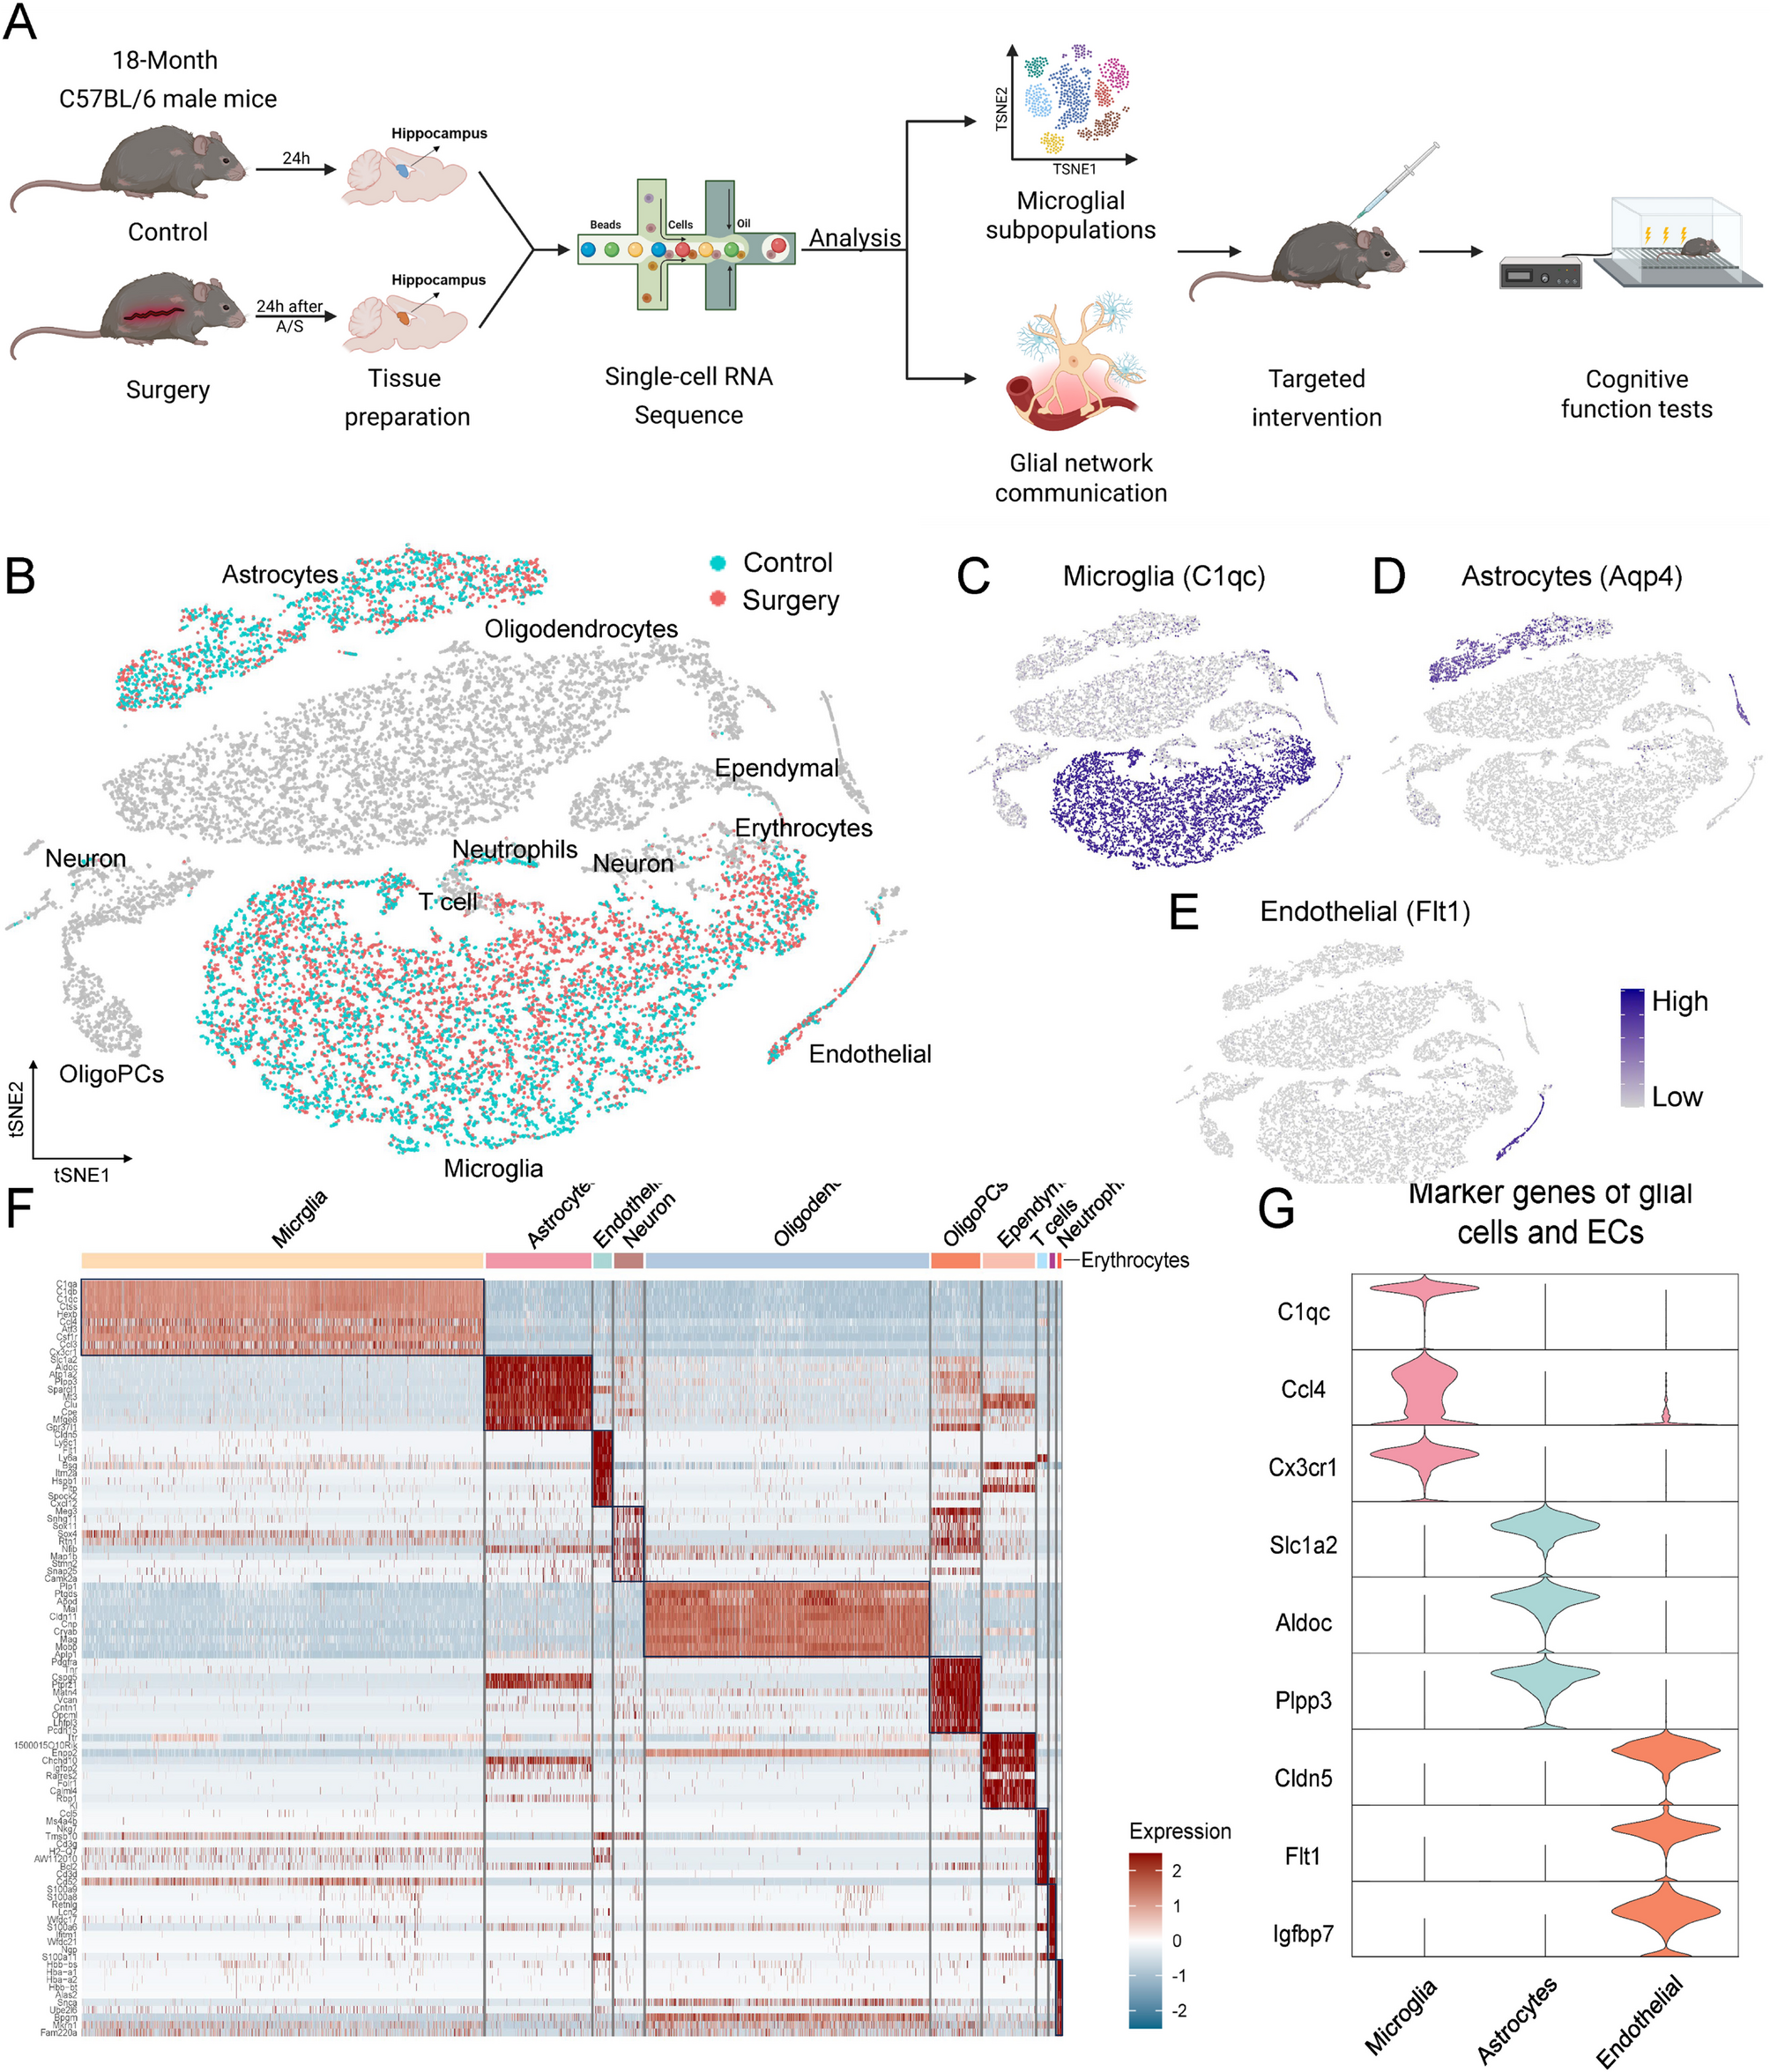
Characterization of glial and vascular cell populations in perioperative hippocampus
The hippocampi of mice in both control and surgery groups were dissected 24 h postoperatively for single-cell RNA sequencing (scRNA-seq, Fig. 1A). Sequencing yielded a total of 20,684 hippocampal cells. Following classification, 10 cell populations were identified including microglia, astrocytes, ECs, neurons, and others (Fig. 1B). Given their essential biological functions within BBB damage, CNS inflammation and homeostasis, as well as their observed transcriptional alterations, we focused on two glial cell populations and one vascular cell population: microglia (marked by C1qc, 3,814 and 4,776 cells in control and surgery groups, Fig. 1C), astrocytes (marked by Aqp4, 1,183 and 1,072 cells, Fig. 1D), and ECs (marked by Flt, 150 and 236 cells, Fig. 1E). Heatmap displayed the top 10 differentially expressed genes (DEGs) for each cell type (Fig. 1F). For microglia, top DEGs such as C1qc and Ccl4 are involved in the classical complement cascade and chemokine-mediated immune recruitment, contributing to microglial inflammatory activation [24], while Cx3cr1 mediates neuron-microglia signaling and synaptic maintenance. For astrocytes, DEG Slc1a2 regulates glutamate clearance to prevent excitotoxicity, Aldoc participates in glycolysis, and Plpp3 modulates phospholipid metabolism and astrocyte development [25]. For ECs, DEG Cldn5 is a key tight junction (TJ) protein essential for BBB integrity, Flt1 mediates vascular remodeling, and Igfbp7 influences endothelial permeability and angiogenic balance (Fig. 1G) [26].
Single-cell RNA sequencing revealed glial and vascular cell types in the perioperative hippocampus. A Flowchart showed an overview of the scRNA-seq experiment. B The t-SNE plot showed the clusters of hippocampal tissue captured in scRNA-seq. Cell clusters of interest were colored, with green cells originating from control group and red cells originating from surgery group. C-E Feature plots showed cluster-specific expression of known cell markers: Microglia-C1qc, Astrocytes-Aqp4, and Endothelial-Flt1. F Heat map showed specific highly expressed genes in each cell type of hippocampus. G Normalized expression values of marker genes of glial cells and ECs were plotted as violin plots with genes as rows and cell types as columns. Cells were pooled from 3 mice per group
Perioperative inflammation associated microglia expanded over 14-fold
The initiation of CNS inflammation is closely associated with the activation of hippocampal microglia, which serve as the resident immune cells of the brain [27]. To further investigate the heterogeneity of microglial activation in this context, a secondary clustering analysis was performed on 8,590 hippocampal microglia, identifying eight transcriptionally distinct subpopulations with divergent activation states and transcriptional profiles. Among them, 42% were homeostatic microglia (HM). 27% of microglia expressed both immediate early genes (IEGs, e.g. Fos, Jun, Egr1) and inflammatory genes (e.g. Irf1, Icam1), representing a transcriptional state intermediate between homeostasis and full activation. They were annotated as transition state microglia (TSM). One subpopulation (accounting for 12%) expressed a significant number of inflammation related genes and was defined as inflammation associated microglia (IAM), and another subpopulation (6%) expressed a set of neurodegenerative disease related genes and was defined as disease associated microglia (DAM). Three subpopulations with anti-inflammatory and neuroprotective gene expression patterns were identified as inflammation inhibitory microglia (IIM, 6%), metabolism associated inhibitory microglia (MIM, 2%), and disease associated inhibitory microglia (DIM, 1%). The remaining 4% of cells were macrophages (MΦ, Fig. 2A, B). Heatmap illustrated the top 10 DEGs in each microglial subpopulation, highlighting the distinct transcriptional profiles (Fig. 2C). Representative functional genes were selected from each subpopulation to show their specificity. In HM, DEG P2ry12 maintained microglial homeostasis and supported synaptic pruning, while Glul encoded glutamine synthetase, essential for ammonia detoxification and neurotransmitter recycling [28]. In TSM, DEG Egr1 and Jun were IEGs responsive to neuronal stimuli and immune signals, facilitating the transcription of inflammation-related pathways. In IAM, Tnf was specifically upregulated (Fig. 2D, scaled average expression: IAM = 1.99, IIM=−1.15, other subpopulations < 0.28), indicating its key role in proinflammatory signaling; Lgals3bp, another highly expressed gene, promoted microglial activation and was associated with neuroinflammatory progression [29]. In DAM, DEG Malat1 contributed to RNA metabolism and was implicated in neurodegeneration, while Plp1, encoding myelin proteolipid protein, reflected alterations in myelin integrity. The top DEGs of IIM, MIM, and DIM included Rplp1, S100a6, Cd74, etc. T-SNE plots (Fig. 2E) showed the top DEGs of each subpopulation in different spatial distributions, with HM, TSM, IAM, DAM, and IIM being the primary subpopulations.
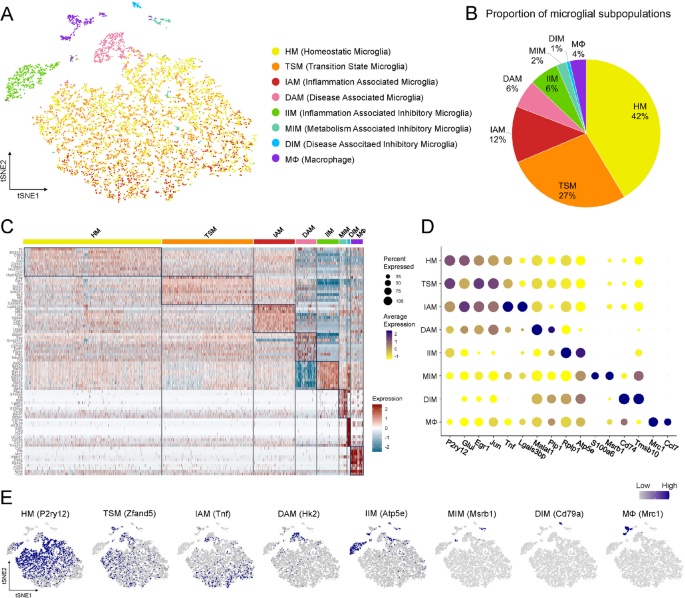
Secondary clustering identified eight microglial subpopulations with distinct transcriptomic profiles. A T-SNE plot showed eight microglial subpopulations with nomenclature on the right. B Pie chart showed the proportion of cells in each subpopulation. C Heatmap showed the top 10 DEGs of each subpopulation. D Dot plot showed the expression of the marker genes in different subpopulations. The expression level (color intensity) and the percentage of cells in a cluster expressing a given gene (size of the dot) were reflected in circles. E, Feature plots showed the representative genes of each subpopulation
The variation of microglial subpopulations between control group (preoperative period) and surgery group (postoperative period) was further analyzed. In control group, microglia were in a homeostatic state, and HM accounted for 81% of total microglia. TSM were scarcely detected (1.4%). In surgery group, HM decreased from preoperative 81% to 9.8% of total microglia (decreased by 88%). In contrast, TSM increased from preoperative 1.4% to 47.8% (increased by 3343%, or over 33-fold), which suggested that a large proportion of microglia in surgery group was in a transitional state, preparing for further differentiation. Notably, IAM increased from preoperative 1.3% to 21% (increased by 1474%, or over 14-fold), while changes in other subpopulations were relatively insignificant (Fig. 3A). These findings indicated a profound disruption of hippocampal microglial homeostasis, characterized by a shift toward transition state and inflammation-associated activation state after surgery.
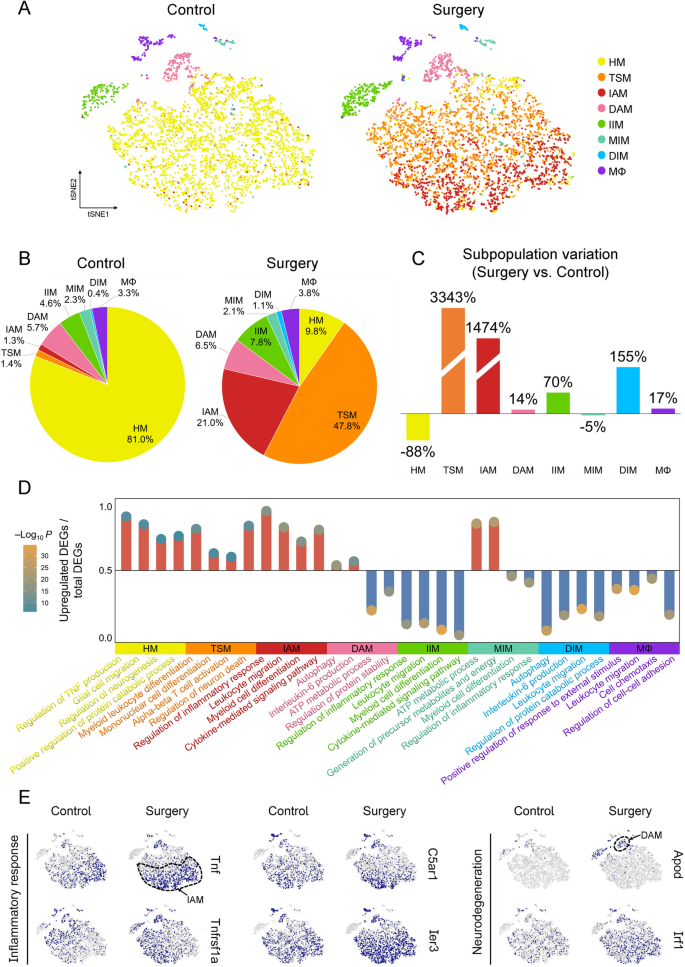
Perioperative microglial subpopulation IAM expanded over 14-fold. A T-SNE plots showed significant differences in microglial subpopulations between control and surgery groups. B Pie charts showed the proportion of microglial subpopulations relative to the total microglia. C Bar graphs showed the relative change in surgery group compared with control group, calculated as (proportion in surgery group – proportion in control group)/proportion in control group. D Lollipop plot showed the four characteristic terms in GO enrichment analysis of each subpopulation, the ordinate indicated the proportion of upregulated DEGs in this term, and the circles indicated the P value of enrichment analysis. E Feature plots showed the expression of genes associated with inflammation and neurodegeneration in control and surgery groups. Dotted circles outlined the approximate locations of IAM and DAM
Given the significant alterations of microglial subpopulations, their functions were further explored (Fig. 3D). For HM, enrichment of terms included regulation of neurogenesis and positive regulation of cellular catabolic process. For TSM, enriched terms included myeloid leukocyte differentiation and mononuclear cell differentiation. IAM exhibited significant enrichment in regulation of inflammatory response, and cytokine-mediated signaling pathways. In contrast, IIM showed downregulation of inflammation-related pathways. DAM exhibited enrichment in autophagy and regulation of protein stability, while DIM exhibited reduced enrichment in disease-related pathways. Lastly, MIM exhibited enrichment in metabolism-associated pathways and downregulation of inflammation-related terms. The DEGs associated with inflammation and neurodegeneration were illustrated in Fig. 3E. The dashed lines were utilized to approximately delineate the projected distributions of IAM and DAM. In IAM, the high expression of Tnf and Tnfrsf1a (Tnf receptor) suggested its role in inflammatory cascades. C5ar1, a complement receptor, mediated chemotactic responses, and Ier3 modulated cellular resistance to inflammatory and oxidative stress. In DAM, elevated Apod expression reflected lipid dysregulation and oxidative imbalance, while Irf1 was a transcriptional regulator of autophagy and immune response.
Shift in microglial gene expression patterns from HM to IAM and IIM
As shown in dot plot (Fig. 4A), the expression of homeostatic genes (Fcrls, P2ry12, etc.) was higher in HM and TSM (p < 0.0001). In contrast, inflammation-related genes (Tnf, Ccl2, etc.) were highly expressed in IAM (p < 0.0001), expressed at lower levels in HM and TSM, and nearly absent in IIM. Pseudotime analysis (Fig. 4B) revealed that microglia underwent a dynamic transition from HM, through an intermediate transcriptional state characterized by immediate early gene expression (TSM), and subsequently bifurcated into two distinct branches, marked by either pro-inflammatory (IAM) or anti-inflammatory (IIM) gene expression patterns.

Shift in microglial gene expression patterns from HM to IAM and IIM. A Dot plot showed expression of genes associated with homeostatic and inflammatory signatures in four microglial subpopulations. B Pseudotime analysis revealed two distinct activation states of microglia from HM to IAM or IIM. C Four squares of different colors showed the co-expression of DEGs in the four subpopulations. Triangle meant Hub gene. Four functionally related terms were shown in the middle, and up-regulated (IIM was down-regulated) DEGs were connected by dotted lines and corresponding enriched terms
Gene co-expression network analysis was employed to identify key regulatory genes responsible for the functions of HM, TSM, IAM and IIM. Modules with the highest number of co-expressed genes and hub genes were identified as the representatives for these subpopulations (Fig. 4C). HM hub genes P2ry12, Itm2b and Sparc were involved in maintaining microglial persistence and homeostatic function [28, 30]. Co-expressed genes, such as Cx3cr1 and Picalm, were also involved in the regulation of neurogenesis [31, 32]. The hub genes Jun and Ier5 identified in the TSM module were associated with rapid responses to stimuli, inflammatory responses, and CNS functions, particularly those involved in neuronal plasticity [33]. Co-expressed genes, such as Cebpb and Hhex, played roles in the development, differentiation, and proliferation of microglia [34]. IAM hub gene Ddx5 influenced the inflammation balance by inhibiting IL-10 secretion [35]. Junb and Egr1 promoted the production of various pro-inflammatory cytokines, thereby facilitating the propagation of CNS inflammation [36]. Numerous co-expressed inflammatory genes (e.g., Nfkbia, Nlrp3, Tnfrsf1a) defined the proinflammatory signature of IAM, shaping the postoperative hippocampal inflammatory milieu. IIM hub gene Tyrobp interacted with immune receptors and was linked to AD development [37]. The downregulation of Tyrobp in IIM, along with complement system genes C1qa and C1qb, suggested neuroprotective effects. Analysis of the four co-expression modules revealed enriched terms that characterize the perioperative functional reprogramming of microglia, suggesting a gradual shift from a homeostatic state to an inflammation-related state.
TNF signaling activation in postoperative hippocampal IAM
Based on the perioperative changes in microglial subpopulations, microglial activation-related signaling pathways were further established (Fig. 5A). TSM, originating from HM, could transform into M1 microglia via IEG pathway (Egr1, Jun and Fos) or into M2 microglia via TGF-β pathway and related mechanisms. In IAM, both Tnf and its receptor Tnfrsf1a were upregulated. As a central regulator of immune responses, Tnf contributed to the pathogenesis of various diseases, such as sepsis and multiple sclerosis, by triggering pro-inflammatory signaling cascades and promoting programmed cell death [38]. The inflammatory cytokine Il1b was upregulated in IAM, possibly via TNF and NF-κB pathway, leading to a pro-inflammatory reaction. Ccl2 and Tspo were upregulated in IAM, while Hk2 and Prkcd were elevated in DAM. These genes were associated with immune signaling, mitochondrial activity, and metabolic processes [39, 40]. In IIM and DIM subpopulations, genes such as Nlrp3, Il1b, and Casp8 were downregulated, indicating suppressed inflammasome and apoptosis-related pathways. However, the proportional changes of these regulatory subpopulations were relatively limited. A significant increase of Tnf + IBA1 + cells (IAM) in the hippocampus of surgery group was confirmed by IF/FISH double staining (p = 0.0074, Fig. 5B). As inflammatory marker genes of IAM, the fluorescence intensities of Tnf, Tnfrsf1a, and Il1b mRNA were significantly elevated in hippocampal microglia of surgery group. As chemokine and mitochondrial marker genes of IAM, the fluorescence intensities of Ccl2 and Tspo mRNA were also elevated in hippocampal microglia of surgery group (Fig. 5C). These findings suggested the role of microglial activation and the associated regulatory network in postoperative hippocampal inflammation.
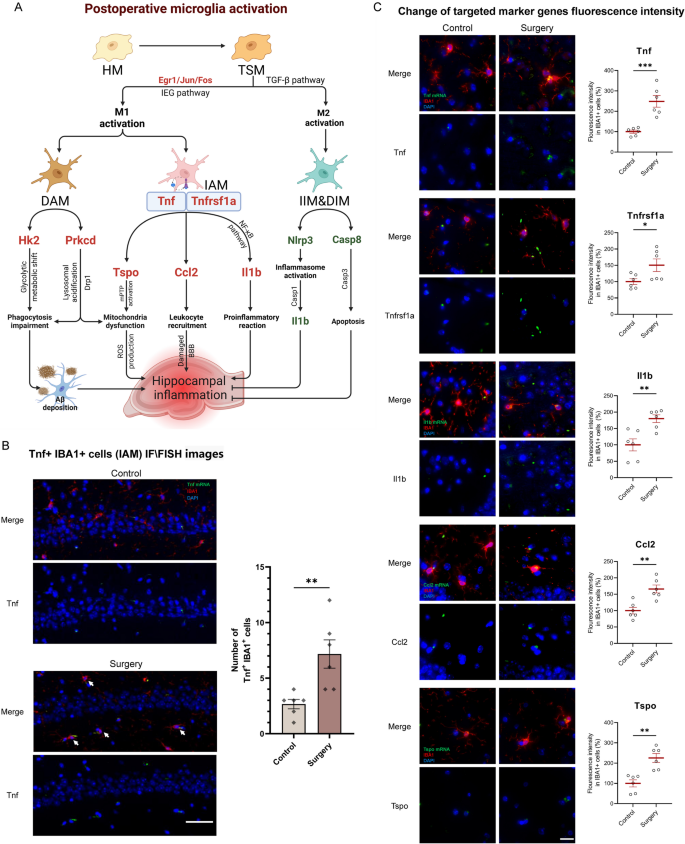
TNF signaling activation in postoperative hippocampal IAM. A Genes and hypothesized mechanisms/signaling pathways related to postoperative activation of microglia and its resulting hippocampal inflammation. Upregulated and downregulated genes were shown in red and green, respectively. B Representative IF/FISH images from hippocampus of mice brains (n = 6 mice/group) stained with IBA1 (for labeling microglia) and Tnf (for labeling Tnf mRNA). Tnf + IBA1 + double-positive cells represent IAM (white arrow). IBA1 (red), Tnf mRNA (green), DAPI (blue). Scale bars, 50 μm. C Representative IF/FISH images from hippocampus of mice brains stained with IBA1 (for labeling microglia) and target gene mRNA. IBA1 (red), Tnf mRNA (green), Tnfrsf1a mRNA (green), Il1b mRNA (green), Ccl2 mRNA (green), Tspo mRNA (green), DAPI (blue). Scale bars, 25 μm. Results were presented as mean ± SEM (n = 6). Two-tailed t-test, *p < 0.05, **p < 0.01 compared with control group
Perioperative astrocytic subpopulations remained relatively stable
Microglia have been shown to influence astrocytic function through the release of specific cytokines or direct cell-cell interactions [41]. Given the role of astrocytes in maintaining CNS homeostasis and coordinating inflammatory responses, we next explored astrocytic heterogeneity in the perioperative hippocampus. Clustering analysis identified six distinct astrocytic subpopulations (Fig. 6A, B). 36% were homeostatic astrocytes (HA). A small subpopulation (accounting for 3%) expressed genes related to brain blood flow regulation and was defined as angiogenesis associated astrocytes (AAA). Another small subpopulation (accounting for 4%) expressed a significant number of metabolism related genes and was defined as metabolism associated astrocytes (MAA). 32% expressed both neurodegeneration and metabolism related genes and were defined as disease and metabolism associated astrocytes (DMA). The remaining two clusters exhibited neuroprotective functions and were defined as disease associated inhibitory astrocytes (DIA, 9%) and metabolism associated inhibitory astrocytes (MIA, 16%). Heatmap illustrated the top 10 DEGs (Fig. 6C), and dot plot showed the representative functional genes of each subpopulation (Fig. 6D). In HA, DEG Htra1 encoded a serine protease that modulated extracellular matrix remodeling and TGF-β signaling, potentially affecting astrocyte reactivity, while Hacd2 was involved in very long-chain fatty acid elongation, supporting membrane lipid balance [42]. In AAA, DEG Agt played a central role in the renin-angiotensin system, influencing cerebral perfusion and vascular tone [43]. In MAA and DMA, DEG Dlk1 functioned in the regulation of adipocyte differentiation and neurodevelopment, and Aldoc, a glycolytic enzyme, contributed to astrocytic energy metabolism and was involved in maintaining redox homeostasis under stress conditions [44]. In DIA and MIA, the top DEGs included Kif5a, Son, and others. T-SNE plots (Fig. 6E) showed the top DEGs of each subpopulation in distinct spatial distributions.
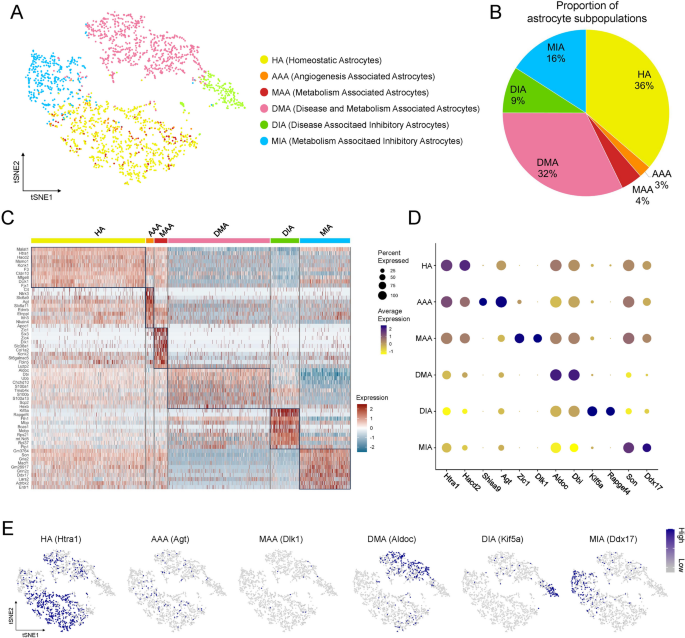
Secondary clustering and subpopulation classification of astrocytes. A T-SNE plot showed six astrocytic subpopulations with nomenclature on the right. B Pie chart showed the proportion of cells in each subpopulation. C Heatmap showed the top 10 DEGs of each subpopulation. D Dot plot showed the expression of the marker genes in different subpopulations. E Feature plots showed the representative genes of each subpopulation
Compared to microglia, perioperative changes in astrocytes were less pronounced. In surgery group, HA decreased from preoperative 39.6% to 32.6% of total astrocytes (decreased by 17.5%), and MIA increased from 14.1% to 17.9% of total astrocytes (increased by 26.9%). And the changes of other subpopulations were more insignificant (Fig. 7A). The functions of astrocytic subpopulations were further explored (Fig. 7D). For HA, enriched GO terms included glial cell development and regulation of neuron differentiation, indicating their role in supporting neuronal maturation and maintaining homeostatic glial functions. For AAA, enriched terms included regulation of blood circulation and regulation of angiogenesis, indicating their role in vascular homeostasis and neurovascular coupling. For MAA and DMA, enriched terms included membrane lipid metabolic process and ATP metabolic process, indicating their role in energy and lipid metabolism under stress or disease conditions. In contrast, MIA exhibited downregulation of the metabolic pathways, indicating bioenergetic dysfunction or suppressed metabolic state potentially linked to pathological processes. The DEGs associated with metabolism and neurodegeneration were illustrated (Fig. 7E). The dashed lines in t-SNE plots roughly outlined the projected locations of DMA and MIA. Ptgds, Jun and Fos were expressed in DMA, with increased levels in surgery group, indicating an enhanced metabolic and neurotoxic function. Dio2 was expressed in MIA, with decreased levels in surgery group, indicating suppressed thyroid hormone metabolism.
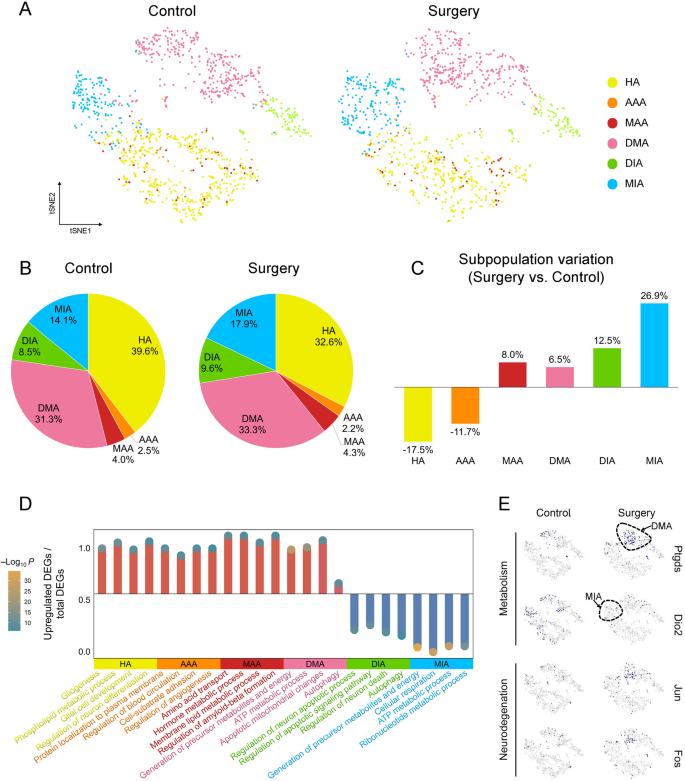
Perioperative astrocytic subpopulations remained relatively stable. A T-SNE plots showed that the astrocytic subpopulations in the control and surgery groups were less pronounced. B Pie charts showed the proportion of astrocytic subpopulations relative to the total astrocytes. C Bar graphs showed the relative change in surgery group compared with control group, calculated as (proportion in surgery group – proportion in control group)/proportion in control group. D Lollipop plot showed the four characteristic terms in the GO enrichment analysis of each subpopulation of DEGs, the ordinate indicated the proportion of upregulated DEGs in this term, and the circles indicated the P value of the enrichment analysis. E Feature plots showed the expression of four marker genes related to metabolism and neurodegeneration in surgery group and control group. Dotted circles outlined the approximate locations of DMA and MIA
IAM dominated postoperative glial network communication
Given the roles of microglia and astrocytes in amplifying or modulating neuroinflammation [45], the communications between glial cells and ECs after surgery were explored. CellChat analysis showed increased intercellular communications after surgery, with significantly enhanced signaling from microglia to microglia, astrocytes to astrocytes, and astrocytes to microglia. Their interaction numbers increased by 8.5%, 26.8%, and 84.0%, and interaction strengths rose by 30.6%, 15.6%, and 17.5%, respectively (Fig. 8A). In microglial subpopulations, IAM and TSM exhibited the highest total differential outgoing and incoming interaction numbers (IAM = 91, TSM = 85) and interaction strengths (both IAM and TSM = 2.7). In astrocytic subpopulations, HA and MAA exhibited the highest total differential outgoing and incoming interaction numbers (HA = 135, MAA = 111) and strengths (HA = 4.4, MAA = 4.6). Additionally, ECs also exhibited increased differential interaction numbers (60) and strengths (2.4, Fig. 8B, C). Given the perioperative changes of microglia, the signaling pathway alterations between control and surgery groups of microglia were further compared. Stacked bar plots (Fig. 8D) showed that the majority of signaling pathways were upregulated in surgery group. Notably, the signaling pathways related to extracellular matrix interaction (LAMININ), immune regulation (CD22, CD25), and vascular remodeling (ANGPTL) exhibited increased activity. This upregulation was observed in both signal-emitting and signal-receiving cells, indicating a bidirectional amplification of glial cell communication. Subsequent analysis of the IAM subpopulation revealed that among all differential pathways, the TNF signaling exhibited the largest increase in both incoming and outgoing interaction strengths, further highlighting its role in postoperative glial communication (Fig. 8E).
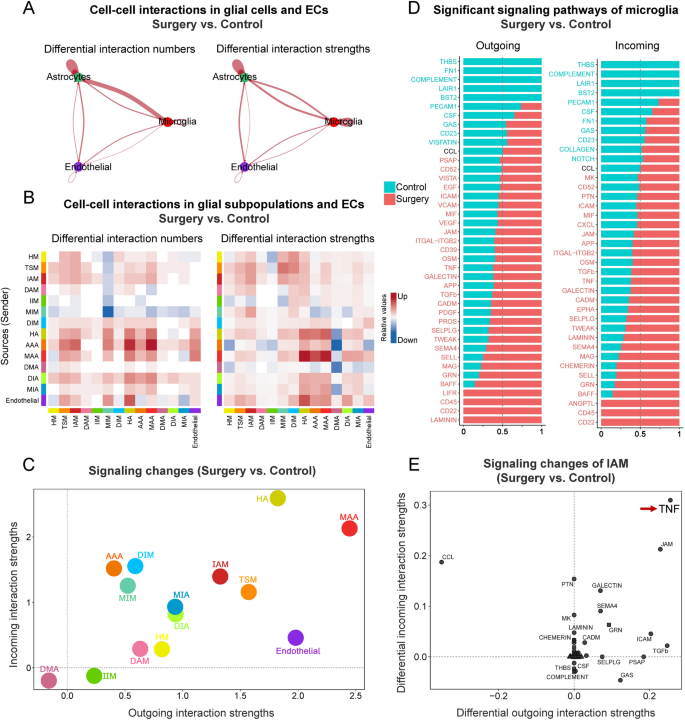
Intercellular communication analysis revealed postoperative inflammatory pathway alterations. A The change of cell-cell interactions in all pairs of microglia, astrocyte, and endothelial cells, were compared between surgery and control groups. Red edges represented increased signaling in surgery group. No significantly decreased interactions were detected at the defined threshold, thus no blue edges were shown. B The change of cell-cell interactions between 14 cell subpopulations in surgery group compared to control group. The heatmap summarized differential interaction numbers or strengths. In the color bar, red (or blue) represented increased (or decreased) signaling in surgery group compared to control group. C The change of signaling pathway analysis on the aggregated cell-cell communication network from all signaling pathways. D The conserved and context-specific signaling pathways of microglia were identified by comparing the information flow for each signaling pathway, defined as the sum of communication probabilities among all pairs of cell subpopulations in the inferred network (i.e., the total weights in the network). Significant signaling pathways were ranked based on differences in the overall information flow within the inferred networks between surgery and control group. The top signaling pathways colored green were enriched in control group, and these colored reds were enriched in surgery group. E The specific signaling changes of IAM between surgery and control groups were identified. Red arrow showed that the TNF signaling pathway had the most significant differences in outgoing and incoming interaction strengths
The major signaling pathways upregulated in microglia of surgery group were further analyzed. For TNF signaling pathway, chord diagram (Fig. 9A) showed that the interaction signals existed exclusively between microglial subpopulations. In control group, several subpopulations including HM, TSM, and IAM participated with moderate signaling activity. However, after surgery, IAM became the principal regulator of TNF signaling, functioning as the primary source of TNF ligands, the main recipient of TNF-related signals, and a key intermediary in signal propagation (red box, Fig. 9B). This shift suggested a central role of IAM in postoperative inflammatory response. Compared to control group, Tnf-Tnfrsf1a ligand-receptor (L-R) pair communication increased significantly in the IAM of surgery group (red box, Fig. 9C). Microglia-drived Tnf interacted with its receptor Tnfrsf1a, mediating various biological processes, including neuroinflammation and BBB damage [46, 47]. For BAFF pathway, chord diagram (Fig. 9D) showed that in control group, IAM primarily served as signaling initiators. After surgery, IAM displayed enhanced involvement by simultaneously producing BAFF ligands, responding to BAFF-related cues, and participating in signal relay within the microglial network (Fig. 9E). Compared to control group, Tnfrsf13b-Tnfrsf13b L-R pair communication increased in the IAM-dominated subpopulations of surgery group (red box, Fig. 9F), suggesting the involvement of other TNF-related signaling in IAM crosstalk. CHEMERIN is an adipokine with immunomodulatory properties. For the CHEMERIN pathway (Fig. 9G-H), astrocytes (HA, AAA, and MAA) acted as major signal emitters in control group, primarily targeting HM and TSM. After surgery, activated IAM emerged as the dominant recipients of astrocyte-derived CHEMERIN signals, implying a shift in astrocyte-microglia communication toward proinflammatory microglial states. Compared to control group, Rarres2-Cmklr1 L-R pair communication increased in surgery group from HA, AAA and MAA to IAM (red box, Fig. 9I). For APP pathway, chord diagram (Fig. 9J) showed that the interaction signals existed mainly from ECs to microglia. ECs served as the primary source of APP-related signals, targeting DIM as major recipients. IAM were actively involved as signal intermediates, suggesting their role in integrating vascular signals into inflammatory responses, potentially linking endothelial dysfunction with microglial activation (Fig. 9K). App-Cd74 L-R pair exhibited strong interactions from ECs to DIM, with a noticeable increasing trend in surgery group (Fig. 9L).
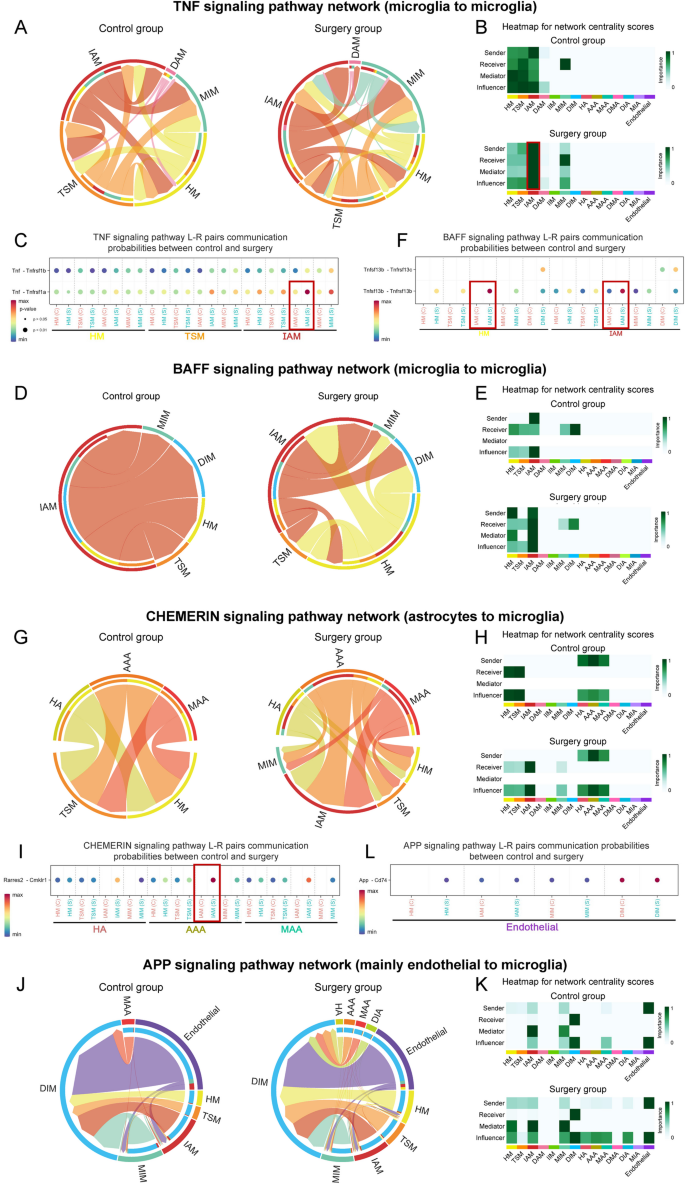
Interaction among glial cell subpopulations changed in key signaling pathways during perioperative periods. A-C Perioperative Interaction patterns among cell subpopulations in TNF signaling pathway. Interaction only occurred between microglial subpopulations. A Chord diagram showed that IAM-IAM communication was significantly upregulated in surgery group. In all chord diagrams, edge colors were consistent with the sources as sender, and edge weights were proportional to the interaction strength. The thicker edge line indicated a stronger signal. The inner thinner bar colors represented the targets that received signal from the corresponding outer bar. The inner bar size was proportional to the signal strength received by the targets. B Heatmap showed dominant senders, receivers, mediators and influencers in the perioperative intercellular interactions network by computing several network centrality measures for each subpopulation. C Dot plot showed the communication probabilities mediated by ligand-receptor pairs from control to surgery groups. D-F Perioperative interaction patterns among cell subpopulations in BAFF signaling pathway. Interactions occurred between microglial subpopulations. G-I Perioperative interaction patterns among cell subpopulations in CHEMERIN signaling pathway. Interactions occurred between astrocyte to microglial subpopulations. J-L Perioperative interaction patterns among cell subpopulations in APP signaling pathway. Interactions mainly occurred between ECs and microglial subpopulations
IAM intervention with TNF inhibitor restored PNCI in mice
To further explore potential cellular communications in the hippocampus following surgery, a hypothetical regulatory network was established based on identified microglial subpopulations and intercellular communication patterns (Fig. 10A). This network showed that IAM played a pivotal role in initiating inflammation through elevated TNF signaling, thereby influencing both astrocytic responses and endothelial dysfunction. Inflammatory genes Egr1 and C1qa were upregulated in astrocytic subpopulations (HA, DMA or MIA). It was hypothesized that TNF signaling in IAM targeted astrocytes, promoting reactive astrogliosis and an inflammatory astrocyte phenotype [48], characterized by the upregulation of Egr1 and C1qa. These changes were accompanied by a pro-inflammatory milieu, potentially impairing endothelial function via Cirbp upregulation and inflammasome activation [49]. In IAM, upregulated inflammatory genes included Tnf, Il1b, and Ccl2. Concurrently, ECs showed an increased expression of Icam1 and Ifitm3, suggesting endothelial responses to a pro-inflammatory environment. These transcriptional alterations reflected potential mechanisms under perioperative BBB damage. The ligands Csf1 (from MIA) and Rarres2 (from HA), along with their respective receptors Csf1r and Cmklr1 in IAM, were upregulated. The Csf1-Csf1r axis could promote microglial proliferation, driving IAM expansion, while the Rarres2-Cmklr1 axis could facilitate IAM migration via the MAPK pathway. Transmission electron microscopy revealed ultrastructural changes in hippocampal vasculature following surgery (Fig. 10B). In control group, ECs exhibited intact morphology, with continuous TJ and basement membranes (BM). In surgery group, ECs exhibited marked cytoplasmic vacuolization and BM fragmentation (red arrows), indicating endothelial barrier damage. Microglia were also observed in close anatomical proximity to ECs, accompanied by expanded rough endoplasmic reticulum, indicating increased protein synthesis activity associated with microglial activation. Collectively, these findings showed a putative inflammation-related intercellular network communication centered on IAM, providing a conceptual framework for understanding glial-mediated neuroinflammation in PNCI.
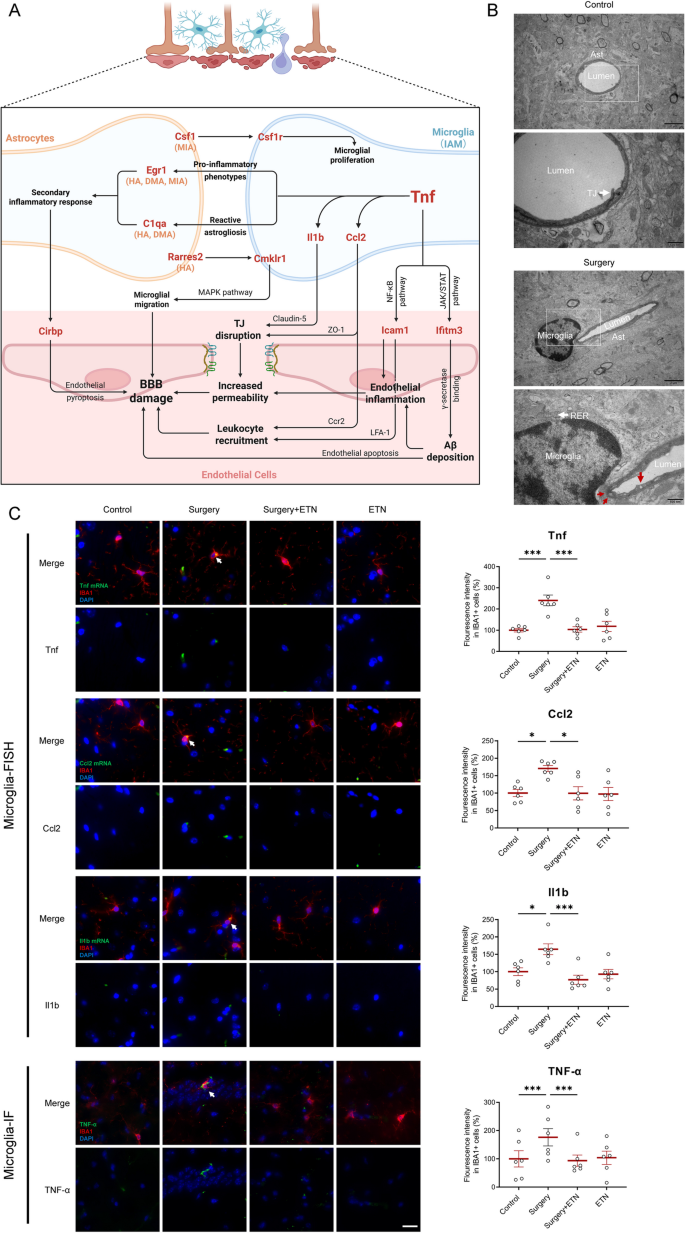
IAM dominated postoperative glial network communication. A Genes and hypothesized mechanisms/signaling pathways associated with surgery-induced BBB damage were primarily driven by TNF signaling of IAM. Upregulated genes were shown in red. The subpopulation listed in parentheses indicated upregulation of the gene in this subpopulation. B Transmission electron microscopy images showed continuous basal membrane (BM), intact TJ, and normal endothelial morphology in the control group. In contrast, the surgery group exhibited morphologically activated microglia, fragmented BM and cytoplasmic vacuolization of endothelial cells (indicated by red arrows). C Representative IF/FISH and IF images from hippocampus of mice brains (n = 6) stained with IBA1 (for labeling microglia) and target gene mRNA/protein (white arrow). IBA1 (red), Tnf mRNA (green), Ccl2 mRNA (green), Il1b mRNA (green), TNF-α protein (green), DAPI (blue). Scale bars, 25 μm. Results were presented as mean ± SEM. Two-way ANOVA with post-hoc Bonferroni test, *p < 0.05, ***p < 0.001
Etanercept, a clinically available TNF inhibitor, was selected to target IAM-driven inflammation. ELISA confirmed that hippocampal TNF-α levels were significantly increased in surgery group, and were effectively inhibited following etanercept treatment (Fig. 11B). Next, the expressions of major functional genes of regulatory network were validated with IF/FISH. The inflammatory genes Tnf, Ccl2, and Il1b were significantly upregulated in the hippocampal microglia of surgery group, while TNF inhibitor reduced their expressions to baseline levels (Fig. 10C). Consistently, immunofluorescence confirmed that TNF-α protein expression was also increased in the microglia of surgery group, and TNF inhibitor reduced their expressions to baseline. Egr1 and C1qa were significantly upregulated in astrocytes, and Icam1 and Ifitm3 were significantly upregulated in ECs along blood vessels of surgery group. TNF inhibitor reduced their expressions to baseline (Fig. 11A). Together, these findings confirmed TNF dominant glial network communications, and provided a potential therapeutic strategy for PNCI-related neuroinflammation.
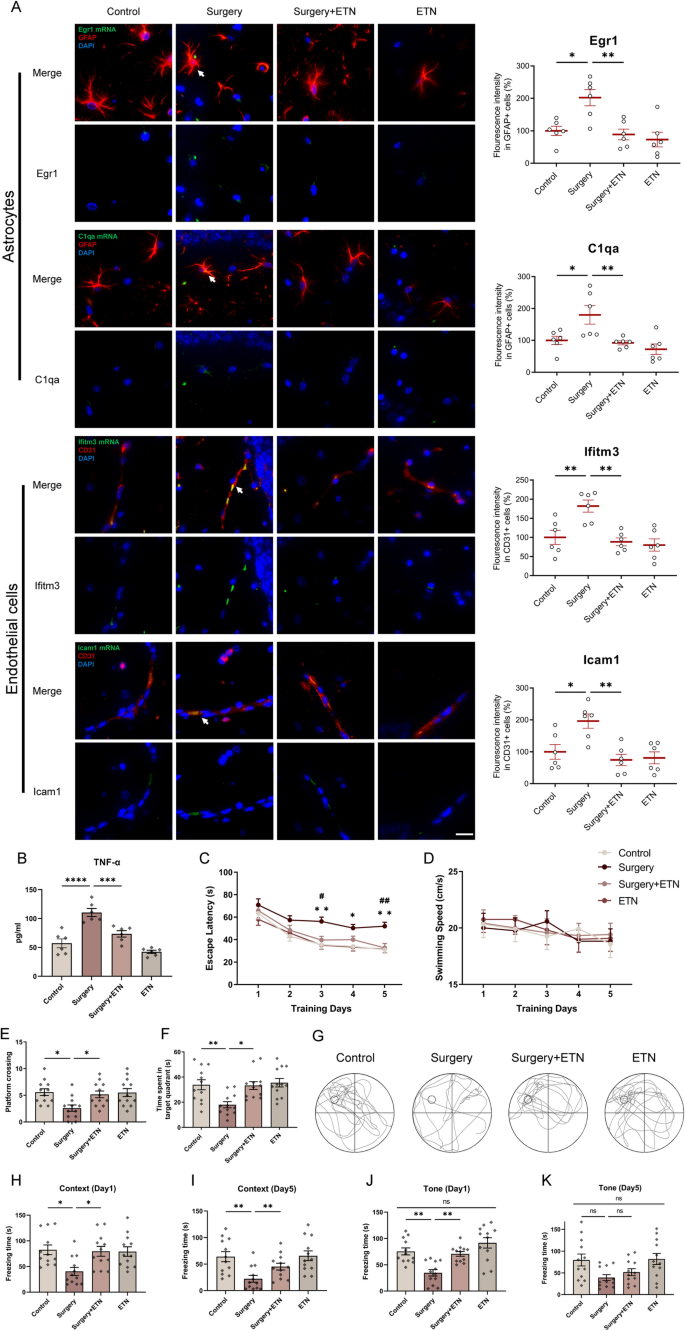
Targeted IAM intervention with TNF inhibitor improved PNCI in mice. A Representative IF/FISH images from hippocampus of mice brains (n = 6) stained with GFAP (for labeling astrocytes), CD31 (for labeling endothelial cells) and target gene mRNA (white arrow). GFAP (red), CD31 (red), Egr1 mRNA (green), C1qa mRNA (green), Ifitm3 mRNA (green), Icam1 mRNA (green), DAPI (blue). Scale bars, 25 μm. B The expression levels of TNF-α in hippocampus of mice brains (n = 6 mice/group). C The mice in surgery group had a longer escape latency on postoperative day 3–5 compared with control group, and mice in surgery + ETN group had a shorter escape latency on postoperative day 3 and 5 compared with surgery group. D There was no difference among four groups in swimming speeds. E The platform crossings in surgery group were decreased in spatial probe test compared with control or surgery + ETN groups. F Time spent in the platform quadrant in surgery group were decreased in spatial probe test compared with control or surgery + ETN groups. G,The typical trajectory of spatial probe test of four groups. H, I In context test, the freezing time decreased significantly in surgery group compared with control group on postoperative day 1 and 5. ETN specifically increased the freezing time at postoperative day 1 and 5. J, K The results of the tone test were consistent with context test. Results were presented as mean ± SEM (n = 12). Two-way ANOVA with post-hoc Bonferroni test, *p < 0.05, **p < 0.01, ***p < 0.001, ****p < 0.0001 compared with control group, #p < 0.05, ##p < 0.01 compared with surgery group
Finally, the cognitive function of aged mice after surgery and TNF inhibition was assessed with Morris water maze (MWM) and fear conditioning test (FCT). In the MWM test, escape latency decreased significantly with ongoing training in control group, and this trend appeared less pronounced in surgery group, which could be rescued by TNF inhibitor treatment (p < 0.05 or p < 0.01, Two-way repeated-measures ANOVA followed by Bonferroni post-hoc test, Fig. 11C). There was no difference in swimming speed among the groups, excluding motor impairment (p > 0.05, Fig. 11D). Spatial memory, assessed by platform crossings and time spent in the target quadrant, was impaired after surgery (p < 0.05 or p < 0.01), and could be rescued by TNF inhibitor treatment (p < 0.05, Fig. 11E, F). Representative probe trial tracks were shown in Fig. 11G. In the FCT, hippocampus-dependent (contextual) memory was significantly impaired at both 1 day (p < 0.05, Fig. 11H) and 5 days (p < 0.01, Fig. 11I) after surgery, and TNF inhibitor treatment rescued these context cognitive impairments (p < 0.05 or p < 0.01). For hippocampus-independent (tone) cognition, two-way ANOVA analysis revealed no significant interaction between treatment (etanercept vs. saline) and condition (control vs. surgery, p > 0.05, Fig. 11J, K). Overall, these findings confirmed the establishment of the PNCI model, and the rescue effects of TNF inhibitor, highlighting the therapeutic potential of postoperative IAM and TNF signaling.