Improved parasite sequences as a result of SWGA
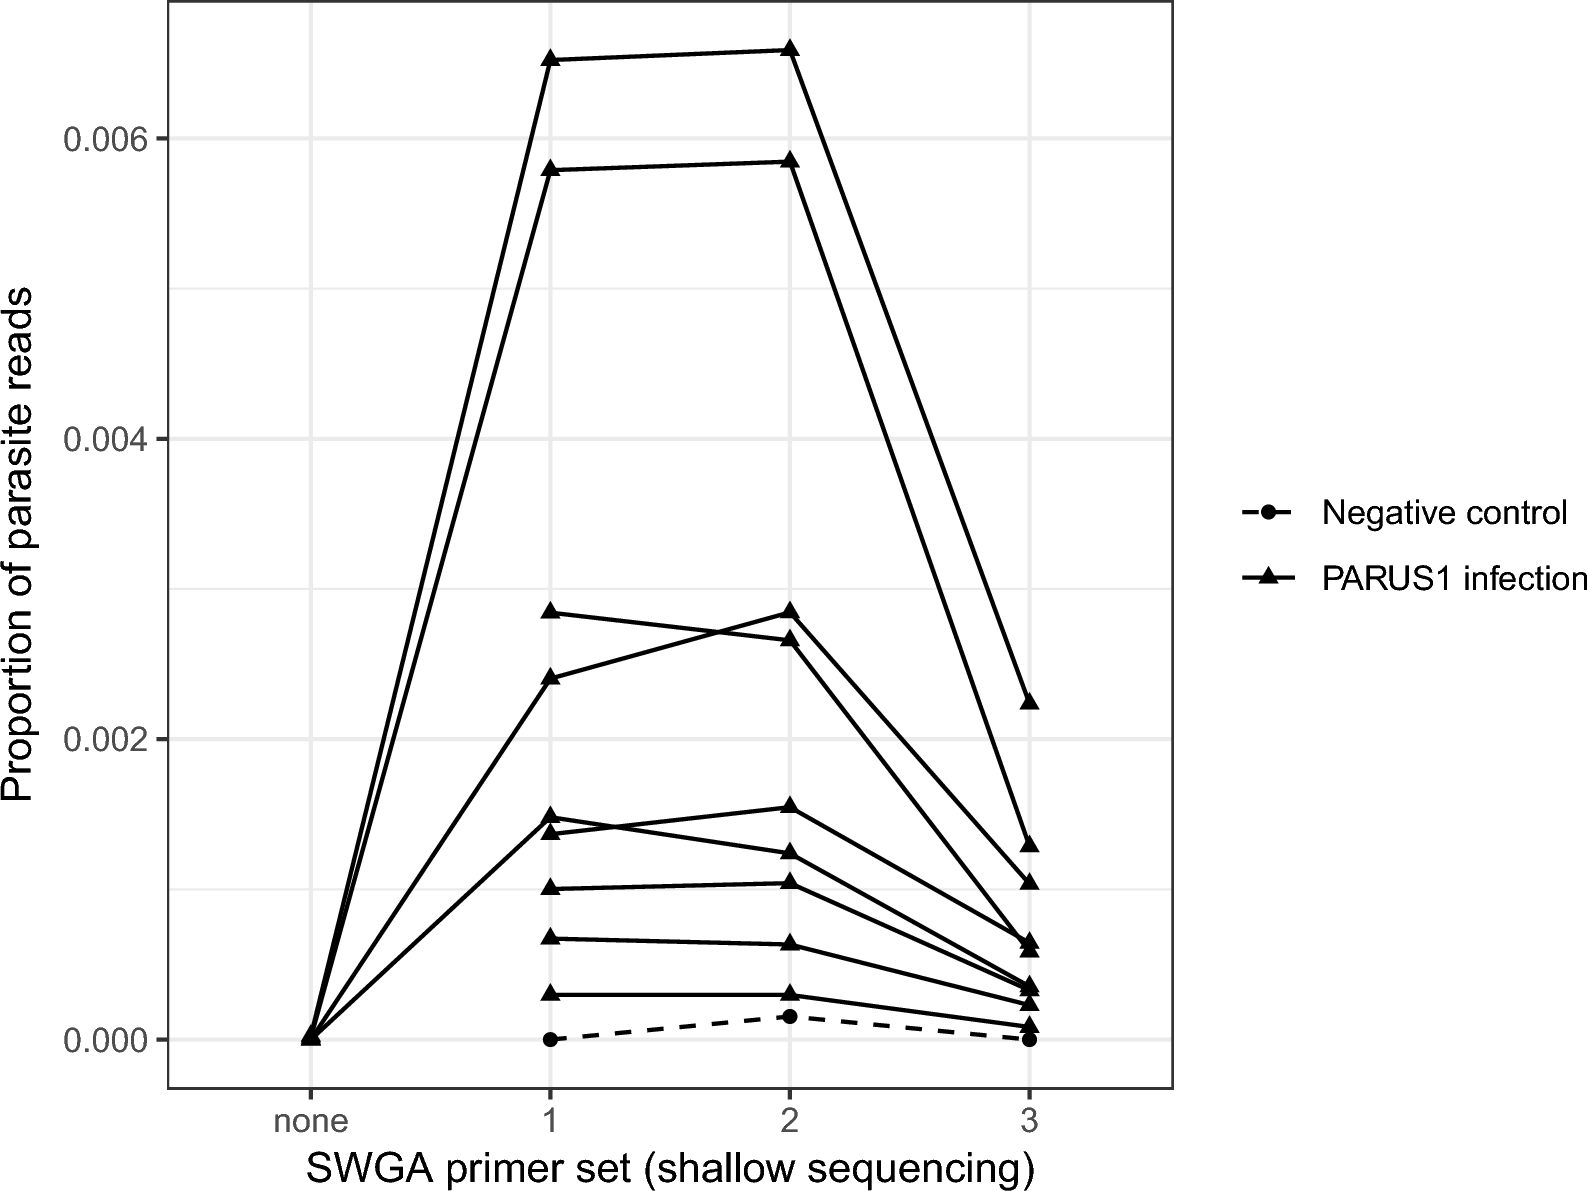
The four unamplified samples were sequenced to an average (± standard error [SE]) depth (i.e. total number of reads) of 73,614 ± 5047 reads (forward and reverse); of those, 72,243 ± 4849 reads passed quality filtering and were used for mapping. Nearly all reads were successfully mapped to the blue tit genome (approx. 99.9%), with only two reads from one unamplified sample, one read from another sample and none from the remaining two samples mapped to the parasite genome. SWGA increased the proportion of reads mapping to the parasite genome in all four samples (Fig. 1). For example, the unamplified sample with two parasite-mapping reads out of 80,839 total reads (2.5 × 10⁻⁵ or 0.0025%), increased to approximately 0.65% of reads mapping to the parasite genome with primer sets 1 and 2 on the shallow sequencing run. The shallow sequencing run of the amplified samples was sequenced to a depth (± SE) of 365,104 ± 11,496 reads (excluding negative controls which were sequenced to a depth of 13,900 ± 4484 reads).
The proportion of reads that mapped to the Haemoproteus majoris parasite genome in unamplified (SWGA primer set “none”) DNA extracted from H. majoris (PARUS1 lineage)-infected blue tits (Cyanistes caeruleus) and DNA that underwent SWGA with one of three primer sets (1–3). Triangles denote individual samples, and the same samples sequenced under different conditions are connected with a solid line. Three negative controls (water) were amplified in each of the three SWGA primer set reactions (1 reaction per primer set) and are represented as filled circles connected with a dashed line. SWGA, Selective whole genome amplification
Primer sets
Primer sets 1 and 2 produced a higher proportion of reads mapping to the parasite genome than primer set 3 in the shallow sequencing run (Fig. 1). Mean read depth was positively correlated with breadth of coverage, the latter measured as the proportion of the genome with at least 1X coverage (r > 0.99 for all host and primer combinations). Mean read depth and breadth of coverage were higher for mapping to the host genome than the parasite genome in all cases (Fig. 2). For parasite mapping, primer sets 1 and 2 had greater breadth of coverage than primer set 3 (F2,16 = 15.58, p < 0.001), and this was independent of sample year (i.e. age of the sample; F2,6 = 0.47, p = 0.646; Fig. 2).
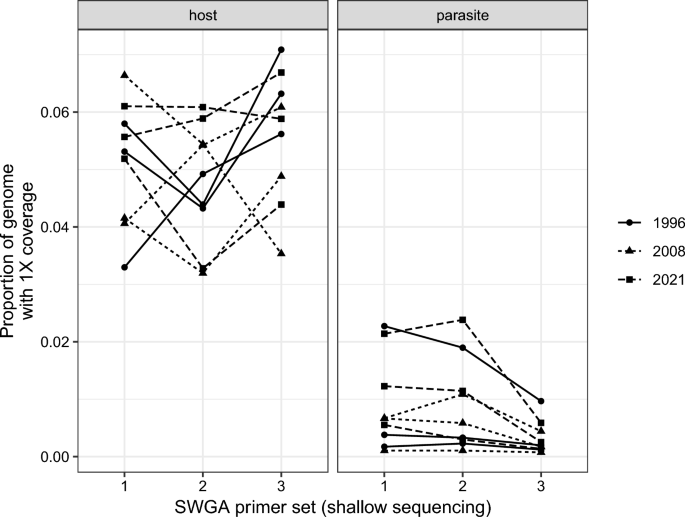
Breadth of coverage measured as the proportion of the host or parasite genomes with at least 1X depth of coverage by SWGA primer set and sample year. Breadth of coverage is positively correlated with mean read depth (r > 0.99), and is higher for mapping to the host genome than to the parasite genome. SWGA primer sets 1 and 2 had higher breadth of coverage (and mean depth of coverage) than primer set 3. SWGA, Selective whole genome amplification
The negative control for primer set 1 had 906 reads that passed quality filtering, of which 189 mapped to the blue tit and none mapped to the parasite. The negative control for primer set 2 had 32,478 reads, of which 13,841 mapped to the blue tit and five mapped to the parasite genomes. Finally, the negative control of primer set 3 had 48,152 reads, of which eight mapped to the blue tit genome and none to the parasite genome. Consistent with these relatively small numbers of mapped reads, we did not find bands in the agarose gels for any of the three negative controls, suggesting that there was no contamination during the SWGA reactions.
Deep sequencing with primer set 2
We chose primer set 2 for deep sequencing as it seemed to work as well as primer set 1 and better than primer set 3 (Fig. 1). We re-sequenced the libraries of the nine samples prepared with SWGA primer set 2 on a NextSeq 2000 (56,426,167 ± 6,373,964 [SE] reads per sample) resulting in 53,238,047 ± 15,405,467 reads per sample that passed quality filtering. The mean (± SE) depth of coverage was 11.3 ± 1.85 for the host genome and 1.17 ± 0.446 for the parasite genome per sample. The mean (± SE) breadth of coverage (i.e. proportion of the genome with at least 1X depth of coverage) was 0.743 ± 0.020 for the host genome and 0.334 ± 0.075 for the parasite genome per sample (Fig. 3). The average (± SE) proportion of reads mapping to the parasite genome decreased slightly from 0.0025 ± 0.0008 in the shallow sequencing run to 0.0018 ± 0.0005 in the deep sequencing run (F1,8 = 36.79, p < 0.001).
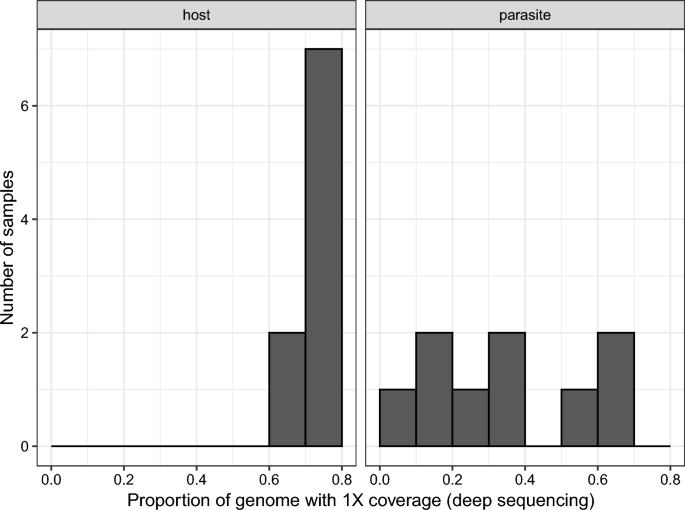
Breadth of coverage measured as the proportion of the host or parasite genomes with at least 1X depth of coverage after deep sequencing of samples amplified by SWGA. Most samples had high breadth of coverage across the host genome; variation among samples was greater for the parasite genome, as would be expected given that there is variation in parasitemia. SWGA, Selective whole genome amplification
An important aspect of any genome sequencing technique for population genomics is sequencing of the same genomic regions among samples so that genetic variants can be identified. We determined the consistency among samples by correlating the average sequencing depth of coverage over 10-kb windows between samples for the host and parasite genomes separately. The mean (± SE) correlation coefficient (r) among these 10-kb windows was 0.929 ± 0.007 for the host genome and 0.472 ± 0.028 for the parasite genome among samples. To understand the degree of overlap in parasite sequencing in a best-case scenario (i.e. where parasite genome sequencing works very well), we calculated the number of nucleotide positions with at least 1X depth of coverage in common between the two best sequenced infections. The two best sequenced parasite infections shared 10,821,340 nucleotide positions (approx. 45% of the reference genome) with at least 1X depth of coverage. Individually, the two infections had 14,090,382 (approx. 59% of the reference genome) and 14,646,363 (approx. 61% of the reference genome) nucleotide positions sequenced to 1X depth of coverage.
We generated separate variant files for the nine host individuals and the nine parasite infections. The raw host variant file had 16,517,700 variants (14,276,887 SNPs and 2,344,956 indels; some sites are classified by the software as both SNPs and indels so their total is greater than the number of variants); on average (± SE) there was less than one host individual missing per variant (0.912 ± 0.0004), and variant depth (123.19 ± 0.031) and quality (1012.78 ± 0.486) were high. The raw parasite variant file had 872,832 variants (787,509 SNPs and 86,449 indels); on average (± SE) about seven of nine parasite infections were missing per variant (6.737 ± 0.0015), and variant depth (14.52 ± 0.017) and quality (436.02 ± 0.645) were lower, but still relatively high. We then restricted both variant files to variants with no more than three missing individuals (host individuals or parasite infections), a minimum depth of five and a minimum quality of 30; this resulted in a filtered host variant file with 14,827,899 variants (12,806,876 SNPs and 2,118,287 indels) and a parasite variant file with 20,954 variants (17,192 SNPs and 3803 indels). For population genetics inference, one needs to know the number of sites that vary among individuals in the population (VCF, such as that used in the present study, typically calculates the number of sites that vary from the reference; however, the reference often does not come from the target population and in the case of our parasite it is not the same genetic lineage [reference is lineage WW2; samples are lineage PARUS1]). Therefore, we also counted the number of sites with more than one allele in the samples (i.e. sites that varied among individuals in the population) and found 14,512,339 such sites among the host individuals and 7068 among the parasite infections.
The 7068 variable sites for the parasites are conservative in the sense that we filtered the VCF file to include variants with six samples (infections), not all of which sequenced equally well (Fig. 3); restricting the filtering to parasite samples that sequenced well would likely reveal more variants. Therefore, we explored restricting the VCF file to the four best sequenced infections and varying the minimum read depth per variant from 1X to 5X and found additional variable sites (Table 1).
Using the larger filtered VCF file (14,512,339 and 7068 variable sites for the hosts and parasites, respectively), we found variation among the samples. A PCA of the filtered host variants captured 39.05% of the cumulative genetic variation over the first three principal components, while a PCA of the filtered parasite variants captured 49.3% of the variation over the first three principal components; both hosts and parasite genetic diversity revealed some degree of clustering over the three time periods investigated (Fig. 4).
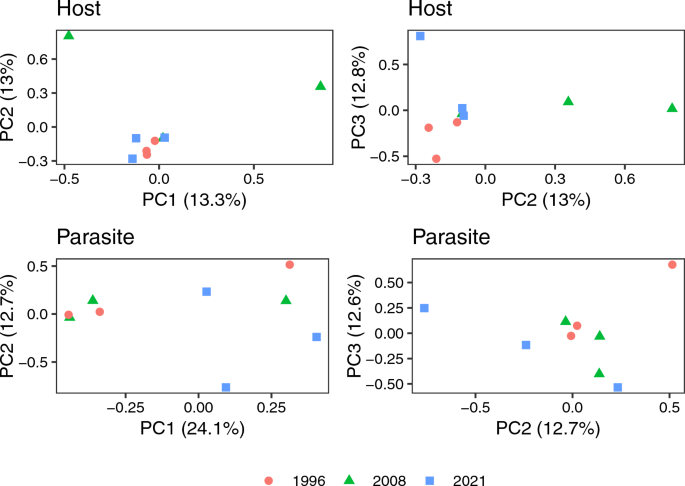
Principal components analysis of host (top two panels) and parasite (bottom two panels), with the shape and color of each individual sample corresponding to the year the sample was collected. The left side panels show the first two PCs while the right panels show the second and third PCs. All axes show the percentage of the genetic variation each PC explained in the analysis. PC, Principal component
Unmapped reads
Because the reference was a different lineage of H. majoris than the samples we sequenced (reference lineage is WW2; samples are lineage PARUS1), some of the unmapped reads may have been parasite reads that did not map because of a high degree of divergence relative to the reference (particularly intronic regions). To explore this possibility, we examined the mean GC content of reads that mapped to the bird, the parasite and remaining unmapped reads for each of the deep sequenced samples. We found unmapped reads to have much lower GC content than bird mapped reads, and similar GC to the parasite mapped reads, suggesting that they may contain unmapped parasite reads (Fig. 5). In the deep sequenced samples, the proportion of non-host reads that did not map to the parasite (i.e. plausibly including parasite reads that were too divergent to map to the parasite reference genome) was on average (± SE) 0.549 ± 0.051 (Additional file 1: Table S2), which is a substantial proportion.
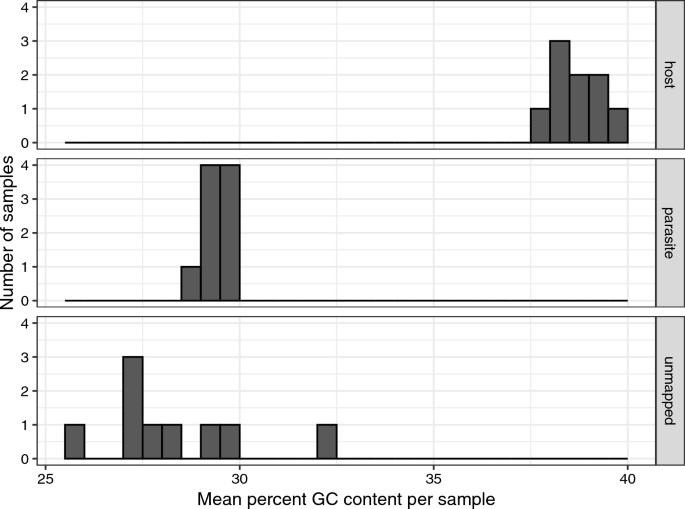
A histogram of the percentage GC content of reads that mapped to the host or the parasite, or were unmapped is presented for each sample. Parasite reads had much lower GC content than host reads and unmapped reads were more similar in GC content to the parasite reads than to the host reads
Sequencing success and parasitemia
We quantified parasitemia (number of infected red blood cells after examining approximately 10,000 red blood cells) for five infected birds (Additional file 1: Table S1). Despite a low sample size, parasitemia was strongly positively correlated with both the proportion of the reference genome over which the infection was sequenced to at least 1X coverage (r = 0.99, t = 12.04, df = 3, p = 0.001) and mean depth of coverage (r = 0.96, t = 6.12, df = 3, p = 0.009).