Enhancing L-malate production of the M4-ΔiclR/pck strain
Our initial objective was to enhance L-malate production by utilizing metabolic engineering on the M4-ΔiclR/pck strain [27]. We hypothesized that glycerol uptake could be a bottleneck in the process. Glycerol enters the cell via facilitated diffusion through the glycerol transporter protein (GlpF), and is then assimilated into cellular metabolism through phosphorylation by the glycerol kinase enzyme (GlpK) [49]. To test our hypothesis, we tried to enhance glycerol uptake by overexpressing the E. coli glpK (Table S1) in the previously reported genetic background (M4-∆iclR/pck) and using pure glycerol in Erlenmeyer Flasks (Fig. 1). We found that L-malate production and molar yields significantly improved in the strain overexpressing the glpK gene (M4-∆iclR/pck–glpk strain), reaching 9.71 ± 0.46 g/L at 72 h, while the control M4-∆iclR/pck strain produced 4.69 g/L of L-malate, a value similar to that reporter by [27], and consequently half of the production of the strain that additionally overexpressed glpk (Fig. 1a). This improved performance is indeed related to the predicted rapid uptake and consumption of glycerol, as evidenced by the decrease in glycerol concentration in the culture, which fell from 13.06 ± 0.25 g/L in the inoculation medium to 4.72 ± 0.36 g/L after 24 h. This is almost half the amount observed in the reference strain (Fig. 1b). The pH decreased in line with the accumulation of L-malate in the culture medium, reaching 5.8 ± 0.1 in the M4-∆iclR/pck–glpk strain (Fig. 1c). The growth of the strain overexpressing GlpK was also higher at this point-time, but remained unchanged up to 72 h (Fig. 1d). Therefore, most of the glycerol consumed from 24 to 72 h was transformed into L-malate. Moreover, succinate (1.45 ± 0.18 g/L) and acetate (1.61 ± 0.12 g/L) were also produced from glycerol (Fig. 1e, f). The L-malate molar yield (mol/mol of consumed glycerol) after 72 h was also significantly higher (0.58 ± 0.05 mol/mol) than that of the control strain (0.31 mol/mol), and the total organic acids molar yield from consumed glycerol was 0.90 ± 0.05 (mol/mol) (Fig. 2).
Comparative plots of the parameters analyzed during glycerol fermentation using the M4-∆iclR/pck control strain (n = 1), M4-∆iclR/pck-glpK (n = 3) at 0, 24, 48, and 72 h. Dot plots represent the average and standard deviation bars of: L-malate (a), glycerol (b), pH (c), biomass (d), succinate (e) in g/L, and acetate (f)
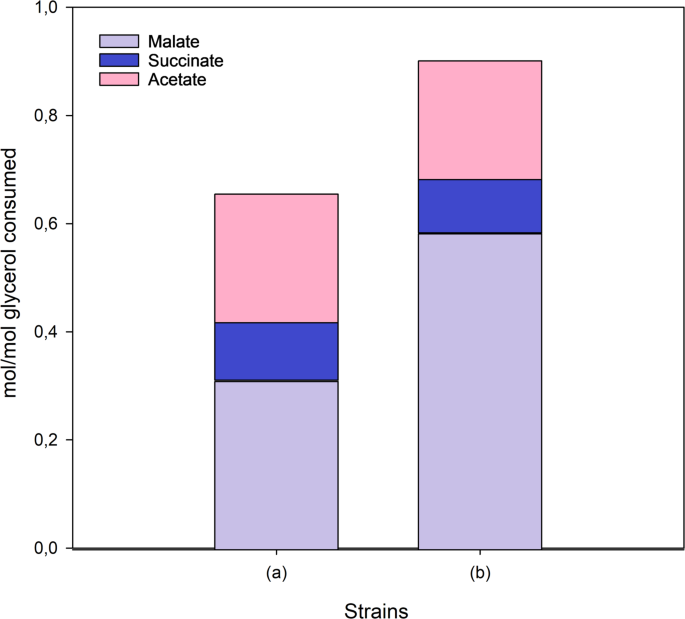
Cumulative bar graphs of C4 metabolites and acetate molar yields (mol produced/mol glycerol consumed) at 72 h by the M4-∆iclR/pck strain n = 1 (a) and M4-∆iclR/pck-glpK (n = 3) (b). Standard deviations for all parameters were < 0.09
The increase in biomass and L-malate production in the M4∆iclR/pck-glpK strain can be explained by its higher glycerol uptake rate compared with the reference strain, which does not overexpress the GlpK enzyme. In the M4∆iclR/pck-glpK strain, the increase in glycerol consumption rate during the log phase was 0.46 g. L-1.h⁻¹, which is significantly higher than that of the reference strain (0.21 g L⁻¹ h⁻¹). This higher carbon uptake led to increased biomass and L-malate production as an end product of the linearized TCA cycle. Although the final glycerol uptake is similar in both strains, the higher L-malate production at 72 h indicates an increased CO₂ intake in the stationary phase due to the anaplerotic reaction catalyzed by Pck (PEP + CO₂ → OAA + ATP).
Optimizing L-malate production in the M4-∆iclR/pck-glpK strain
The optimization of culture conditions is critical to scale up a biotransformation process from Erlenmeyer Flasks to bioreactors. To this end, we used the Micromatrix microbioreactor platform (Applikon, Netherlands), which allows the simultaneous monitoring and control of temperature, oxygen, and pH using small working volumes (3 mL in our case). A full-factorial screening was designed for the identification of independent factors that significantly influenced the L-malate molar yield at 24 h as a response variable using the optimized strain M4-ΔiclR/pck-glpK (Fig. 3). The factors evaluated were inoculum biomass, DO, and glycerol concentration in the initial culture medium (Table S2). This full factorial screening (Supporting information, Table S2) was carried out using either pure or crude glycerol to investigate possible differences in influential factors when using the two grades of glycerol. The analysis revealed that the initial biomass had a significant positive impact on L-malate yield in both cases (Fig. 3), and therefore OD570 1.1 was selected as the inoculum biomass for further experimentation. Glycerol concentration was also a positive significant factor using crude glycerol within the analyzed concentration range (9 to 15 g/L) (Fig. 3a, b), but no statistical differences were found with pure glycerol (Fig. 3c, d). This effect is likely due to components other than glycerol in the crude glycerol extract. On the other hand, controlled DO at a range from 20% to 100% was not a significant factor using either crude or pure glycerol, and therefore, 20% DO was chosen for scaling up the process (Fig. 3). The inoculum biomass and crude glycerol concentration were also significant factors when pH and final biomass were set as response variables (data not shown).
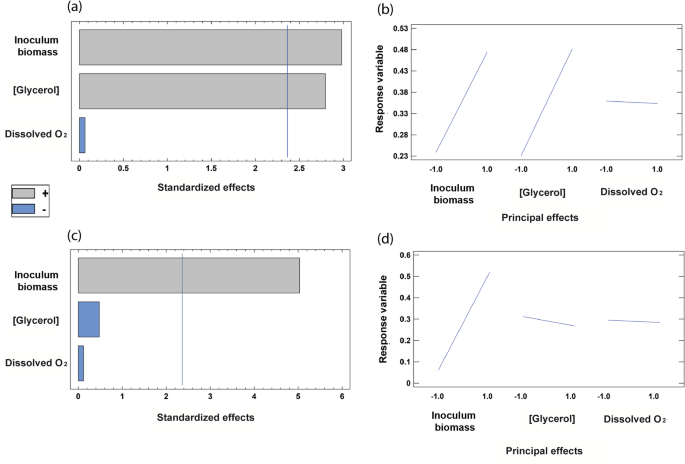
Pareto bar chart of the full-factorial screening for the identification of influential independent factors with L-malate yield as a response variable. The strain M4-∆iclR/pck–glpK was assayed using crude (a, b) or pure (c, d) glycerol. Initial glycerol concentration, biomass, and % dissolved oxygen were the response variables. Standardized (a, c) and principal (b, d) effects are shown. The vertical blue line represents the statistically significant value with a 95% confidence interval. The bars of components with a negative effect on malate yield are in blue, and those of components that have a positive effect on malate yield are shown in grey
Dark fermentation: scaling up the production of L-malate in a bioreactor and in silico metabolic modeling and flux balance analysis (FBA)
To scale up L-malate production, the mini-bioreactor system MiniBio (Applikon® Biotechnology) was used for monitoring and/or control of pH, temperature, and dissolved oxygen. Based on the results of the full-factorial screening previously described, the following parameters were set: DO controlled at 20% of air saturation, and an inoculum of induced bacteria at an OD570 of 1.1 (0.363 g CDW/L). The minimal medium was first supplemented with ∼12.5 g/L pure or crude glycerol as the only organic carbon source to test the scalability from Erlenmeyer flasks [27].
These assays showed that L-malate reached similar maximal concentrations in the bioreactor as in the Erlenmeyer flasks (9.55 g/L with crude glycerol and 8.89 g/L with pure glycerol), but with higher productivity, obtaining the maximum values at 24 and 48 h, respectively, versus 72 h in Erlenmeyer flasks (Fig. 4a, b). Almost all of the crude glycerol had been consumed by 24 h, concomitantly with the maximum production of L-malate (Fig. 4a). As previously reported by [27], once the glycerol had been consumed, the bacteria used up the L-malate and decreased in the culture medium. In contrast, pure glycerol was fully consumed by 48 h, coinciding with the maximum L-malate production. (Fig. 4b). This suggests that the composition of the crude glycerol extract is suitable not only for E. coli growth [42], but also for L-malate production. Regarding pH, similar trends were observed when using either type of glycerol. There was an increase over three hours concomitant with a decrease in biomass. This was followed by acidification alongside malate production (Fig. 4c, d). In these experiments, pH was monitored but not controlled. The main reason for this was to keep dark fermentation as simple as possible. Given that the L-malate yield was quite high (0.65 ± 0.13 mol/mol) when 13 g/L of crude glycerol was used, we reasoned that scaling up would be easier and cheaper without pH control.
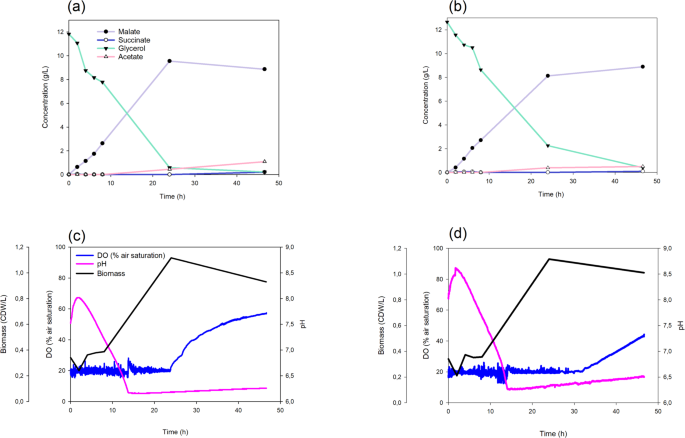
Comparative fermentation of pure and crude glycerol by the strain M4-∆iclR/pck–glpK strain in the Minibio bioreactor system (n = 1). Scatter plots showing the concentration of metabolites using crude (a) or pure (b) glycerol. Scatter plots of DO, pH, and biomass using crude (c) or pure (d) glycerol as a carbon source
Oxygen was consumed steadily at the set point until the carbon source was depleted. At this stage, oxygen consumption ceased, and its concentration in the culture medium increased (Fig. 4c, d). These results support the use of the engineered E. coli strain to consume crude glycerol from a biodiesel refinery and produce L-malate. This process is even more efficient than using pure glycerol.
In order to investigate the metabolic rewiring of the strains used in this work, the experimental data were applied to metabolic reconstructions and simulations. For this, an iterative constraint matrix approach was performed to evaluate extracellular compounds by calculating metabolic fluxes using a metabolic-based model to generate the final metabolic flux distribution inside the cell under different scenarios. This allowed us to predict some non-experimentally measured parameters [50]. The strategies of metabolic engineering, together with the optimization of the culture conditions (glycerol grade, reactor configuration, and DO), revealed that fluxes from glycerol assimilation towards L-malate production have been improved from E. coli M4-ΔiclR (with pure glycerol medium) to the final M4-ΔiclR/pck-glpK mutant (with crude glycerol medium) (Table 1). FBA calculations reveal that CO2 production (Ex_ CO2) lowers in each step of optimization, and actually, becomes a net uptake of 3.13 mmol/g CDW h in M4-ΔiclR/pck-glpK strain. This in silico model indicates that there must be a net carbon uptake in the optimized strain because it is necessary for the carbon closure value (1.05) (Table 1). In theory, this additional uptake could come from CO2 or HCO3− from crude glycerol, which were not experimentally measured. Regardless, the optimized metabolic phenotype displays minimized biomass, and maximized L-malate production and glycerol consumption. These differences are also apparent by examining the energetic metabolic pathways fluxes (mmol/g CDW in bracket): in the M4-ΔiclR/pck-glpK strain with crude glycerol, the source of ATP synthesis increased in glycolysis by phosphoglycerate kinase (PGK) (17.4), PCK (PPCK in Escher-map and CobraPy model) (13.2) when compared to the M4-ΔiclR strain with PGK (13.6) and PPCK (1.27). In contrast, the ATP Synthase (ATPS4r) activity diminished from 83.5 to 47.88 in the optimized strain (Table 1), which indicates that the oxidative phosphorylation is lower in this case. Flux variability analysis for ATP-related reactions shows that the flux range for PPCK in M4-ΔiclR was very low (1.27–3.48) and 0 in all of the strains overexpressing PPCK (Metabolic model results are available in Data availability statement). These results indicate that there is a unique pFBA solution for ATP synthesis in all of the constraints based-models for the strains overexpressing PPCK. In this strain, Pck is predicted to transform phosphoenolpyruvate (PEP) into oxalacetate (OAA), contributing to CO2 assimilation and ATP production. This is consistent with previous reports that E. coli overexpressing Pck with glucose in anaerobiosis had an intracellular ATP concentration that was approximately twice as high, increasing the ATP/ADP ratio via substrate phosphorylation rather than oxidative pathways, and this occurred concomitantly with CO₂ fixation [51, 52]. Our in silico analysis corroborates these results when using the optimized strain with crude glycerol in anaerobiosis, and also explains why a high O₂ concentration is not a significant factor, as was experimentally deduced from the full factorial design of experiment (Fig. 3). Regarding NADH production, GAPD fluxes increased from 13.8 to 17.4 and diminished in the NADH transhydrogenase (NADHTRHD) from 51.9 to 30.3 in the M4-iclR and M4-iclR/pck-glpK strains respectively (Table 1), confirming the NADH production is balanced with the malate dehydrogenase (MDH) activity.
In summary, FBA analysis provides insight into metabolism, confirming that the engineered strain is a crucial step in optimizing crude glycerol fermentation. The model predicts a minimal O2 consumption by reducing metabolic energetic pathways, increasing the efficiency of C and energy utilization (avoiding fermentative end-products), and maximizing the C-flux towards L-malate. This optimized strain facilitates the scaling-up and the application of different bioprocess operations to increase L-malate production and productivity.
Effect of crude glycerol concentration on the production of L-malate in bioreactor and fed-batch fermentation
We continued to explore the optimization of the biotransformation in bioreactor comparing two different crude glycerol concentrations (12.91 ± 1.71 g/L and 19.12 ± 0.15 g/L) to set the optimum (Fig. 5). We found that L-malate production and yield at 24 h was higher using 19 g/L of glycerol (11.41 ± 2.88 g/L and 0.80 ± 0.09 molar yield), with no succinate or acetate production. To the best of our knowledge, this is the highest E. coli L-malate production using either pure or crude glycerol. However, almost half of the initial glycerol remained in the culture medium (Fig. 5c). On the other hand, when 12.9 g/L of glycerol was used, L-malate concentration and molar yield were slightly lower (8.94 ± 1.54 g/L and 0.65 ± 0.13 mol yield respectively), but 75% of glycerol was consumed (Fig. 5c). The pH evolution and oxygen intake were similar when using either concentration (Fig. 5a and b), with the highest L-malate concentration correlating with the lowest pH. Therefore, a better yield or L-malate concentration will depend on the initial glycerol concentration. Depending on the downstream application of the L-malate produced in the fermentation, either initial glycerol concentrations would be appropriate, since a lower concentration leads to a higher L-malate yield, and a higher concentration leads to a higher L-malate concentration.
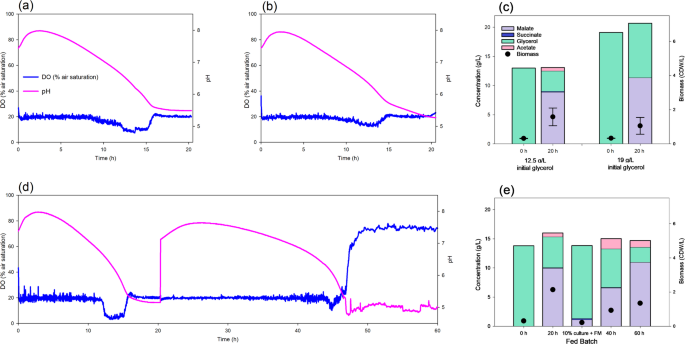
Fermentation of crude glycerol by the M4ΔiclR/pck-glpK strain. Dissolved oxygen and pH evolution using a culture medium supplemented with glycerol 12.5 g/L (a) or 19 g/L (b). (c) Bar diagram showing the concentrations of metabolites and biomass at 0 and 20 h (n = 3). (d) Dissolved oxygen and pH in a fed-batch fermentation (e) Bar diagram of the concentration of metabolites and biomass in the fed-batch fermentation. At 20 h 90% of the fermented culture was removed and refreshed with the same volume of the initial medium for a new batch
At an industrial scale, fed-batch fermentation is a usual strategy [43]. To test the applicability of this strategy, one fed-batch fermentation was also carried starting with 12.5 g/L of glycerol and removing 90% of the culture medium after 20 h the inoculation and adding the same volume of fresh M9 crude glycerol medium (Fig. 5d and e). In this assay, the pH increased slightly to 7.8, and then dropped to 5 between 24 and 48 h, showing a similar trend to that observed between 0 and 24 h. Oxygen consumption remained constant up to 48 h, after which it decreased (Fig. 5d). In the first step, production of L-malate was also similar to that previously obtained in the single batch fermentation, reaching 10.07 g/L (Fig. 4d). However, L-malate concentration after 20 h of the second batch was significantly lower (6.68 g/L) but increased up to 11.09 g/L at 40 h. The production rate was lower, although the final concentration was higher in this second batch. This difference in production rate was probably due to the initial biomass in the first (OD570 = 1.1) and second (OD570 = 0.6) batches. Further studies would be needed to adjust the optimal biomass concentration by, for instance, removing less than 90% of the culture medium in the second batch. This study therefore validates the scaling up of L-malate production in bioreactors using E. coli and crude glycerol.
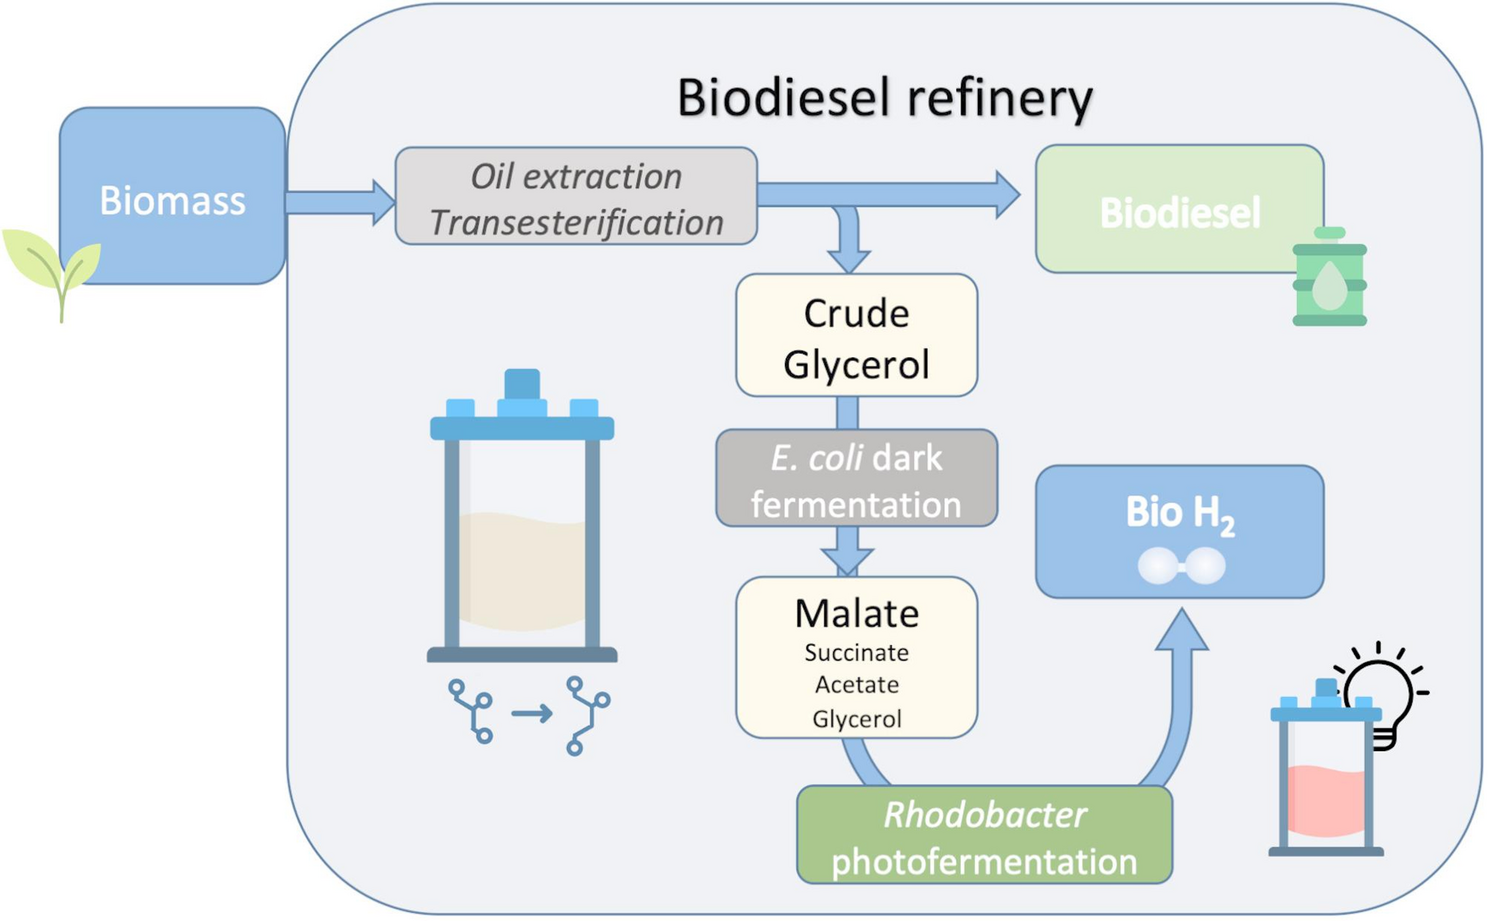
Bio-H2 production by photofermentation using the L-malate-enriched culture medium from glycerol dark fermentation
One of the drawbacks of biotechnological L-malate production is the purification and downstream processes required to obtain the highly purified extracts needed for certain industrial applications. Nevertheless, the fermented medium obtained from crude glycerol by DF in this study contains mainly L-malate, as well as small amounts of succinate, acetate, and non-consumed glycerol. This medium can be used in an additional fermentative process to produce an added-value product, such as bio-H2. This would be of particular interest in a biodiesel refinery, as it would transform a by-product into another clean energy source, creating an integrated process capable of producing two clean bioenergy sources from biomass: biodiesel and bio-H2. In this study, we propose a procedure that uses non-purified, crude glycerol to produce an L-malate-enriched medium. This medium is then used to formulate an RCV culture medium for producing bio-H₂ via photofermentation using the R. capsulatus S2 strain. To this end, we assayed increasing final concentrations of L-malate from 1 to 8 g/L in the RCV L-malate medium. We found that R. capsulatus grew and produced H₂ in all the conditions except when 6–8 g/L of L-malate was used, where H₂ production was negligible (< 5 mmol/L). The optimum was achieved using 3 g/L of L-malate with a H2 production of 55.14 ± 3.80 mmol/L and 62.97 ± 5.85 mmol H2/g CDW) (Fig. 6a). The analysis of the culture after photofermentation showed that the consumption of organic acids was almost 90% with 1 and 2 g/L L-malate in RCV medium, and 73% was consumed with 3 g/L L-malate. However, when higher L-malate concentrations were used, very low bio-H2 synthesis and growth were observed, probably due to an inhibition by the excess of L-malate or other components of the spent M9 culture medium. In this sense, although there was some L-malate consumption, most of the glycerol remained after photofermentation (Fig. 6a). In the 3 g/L L-malate – RCV medium, not only L-malate, but also acetate, succinate, and most of the glycerol content were consumed, which represents 87% of the carbon sources (Table 2). This means that the yield was around 1.5 mol H2/mol (C2-C4 consumed) and the productivities 0.6 mmol/L h and 0.7 mmol/g CDW h. To find out the optimum fermentation time point, the culture medium containing 3 g/L of L-malate was tested every 24 h from inoculation to 120 h. This analysis showed that 92 h was the optimal time point, at which 58.0 ± 6.0 mmol/L of bio-H₂ was achieved. Bio-H₂ dropped from 92 to 120 h (Fig. 6b), probably due to some remaining hydrogenase activity in the R. capsulatus strain used in this study. For example, it was reported that R. capsulatus B10 wild type uses 35 mM lactate and 7 mM sodium glutamate in a 1 L photo-bioreactor yielded 1.45 mol H2/mol lactate [53], which is very similar to the yield obtained in this work (1.48 mol H2/mol with a consumption of 36.5 mM C2-C4 compounds in this work) (Table 2). In terms of productivity [54], reported 0.56 mmol H2/L h using R. capsulatus DSM 1710 at 27.5 °C with light power 287 W/m2, which are similar conditions to those of this work (0.59 mmol H2/L h). Other R. capsulatus strain (KU002) produced 1264 mL H2/L, a similar value to that obtained in this work (1041 mL/L) but with higher productivity (XXX6.8 mL H2/L h). In this case, the author also used L-malate as a carbon source and improved the productivity by optimizing pH, temperature, and light intensity [53]. Recent publications have used several carbon sources (glucose, acetate, butyrate), obtaining variable productivity values (0.15–2.3 mmol/L h) [55, 56] reported a higher productivity (1.388 mmol H2/L h OD and 1500 mL/L culture) using the S2 strain and similar conditions to those of this work (RCV with 30 mM L-malate in diazotrophic conditions, 30 °C at 63 h). This difference is probably due to the higher light intensity (60 W) used by Barahona et al.
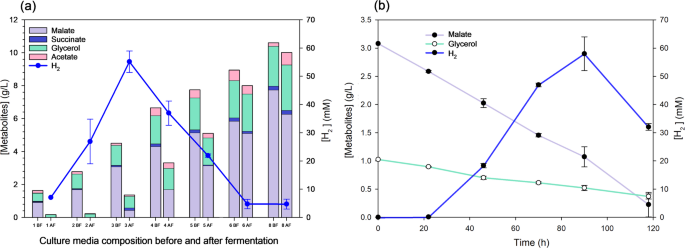
H2 production by photofermentation with R. capsulatus using L-malate from dark fermentation with E. coli (a) Stacked bar chart of metabolites concentrations (Y left axis) before (BF) and after (AF) photofermentation at 96 h using RCV L-malate-medium supplemented with 1, 2, 3, 4, 5, 6 and 8 g/L of L-malate from E. coli fermentation (X axis). H2 produced after fermentation is also shown (Y right axis). (b) Dot and line plots of malate and glycerol concentrations (Y left axis) and H2 production (Y right axis) at 22, 48, 72, 96, and 120 h after inoculation (0 h)
Another widely used PNSB in hydrogen production is the R. sphaeroides species. This bacterium has been reported to produce hydrogen at a broad range of rates (0.29–8.7 mmol/L h) using different organic compounds (acetic, butyric, xylose, glucose, lactate, L-malate), or food wastes (oil palm, brewery effluent, restaurant effluent, etc.) [35]. The wide range of substrates, bioreactor configurations, and environmental conditions (including light intensity, temperature, pH, etc.) significantly affects H2 production and productivity, as also described for R. capsulatus and other PNSBs [55, 57]. Nevertheless, to the best of our knowledge, no publications have reported the consumption of glycerol and L-malate for H₂ production in R. capsulatus or other PNSBs. These evidences make this work very interesting in terms of productivity, reproducibility, and the scalability of photofermentative H2 process when a defined L-malate medium is used. The identification and construction of new PNSB strains by genetic engineering [58], together with bioprocess engineering studies, are promising strategies to improve H2 rates [41, 56, 58].