Experimental setup
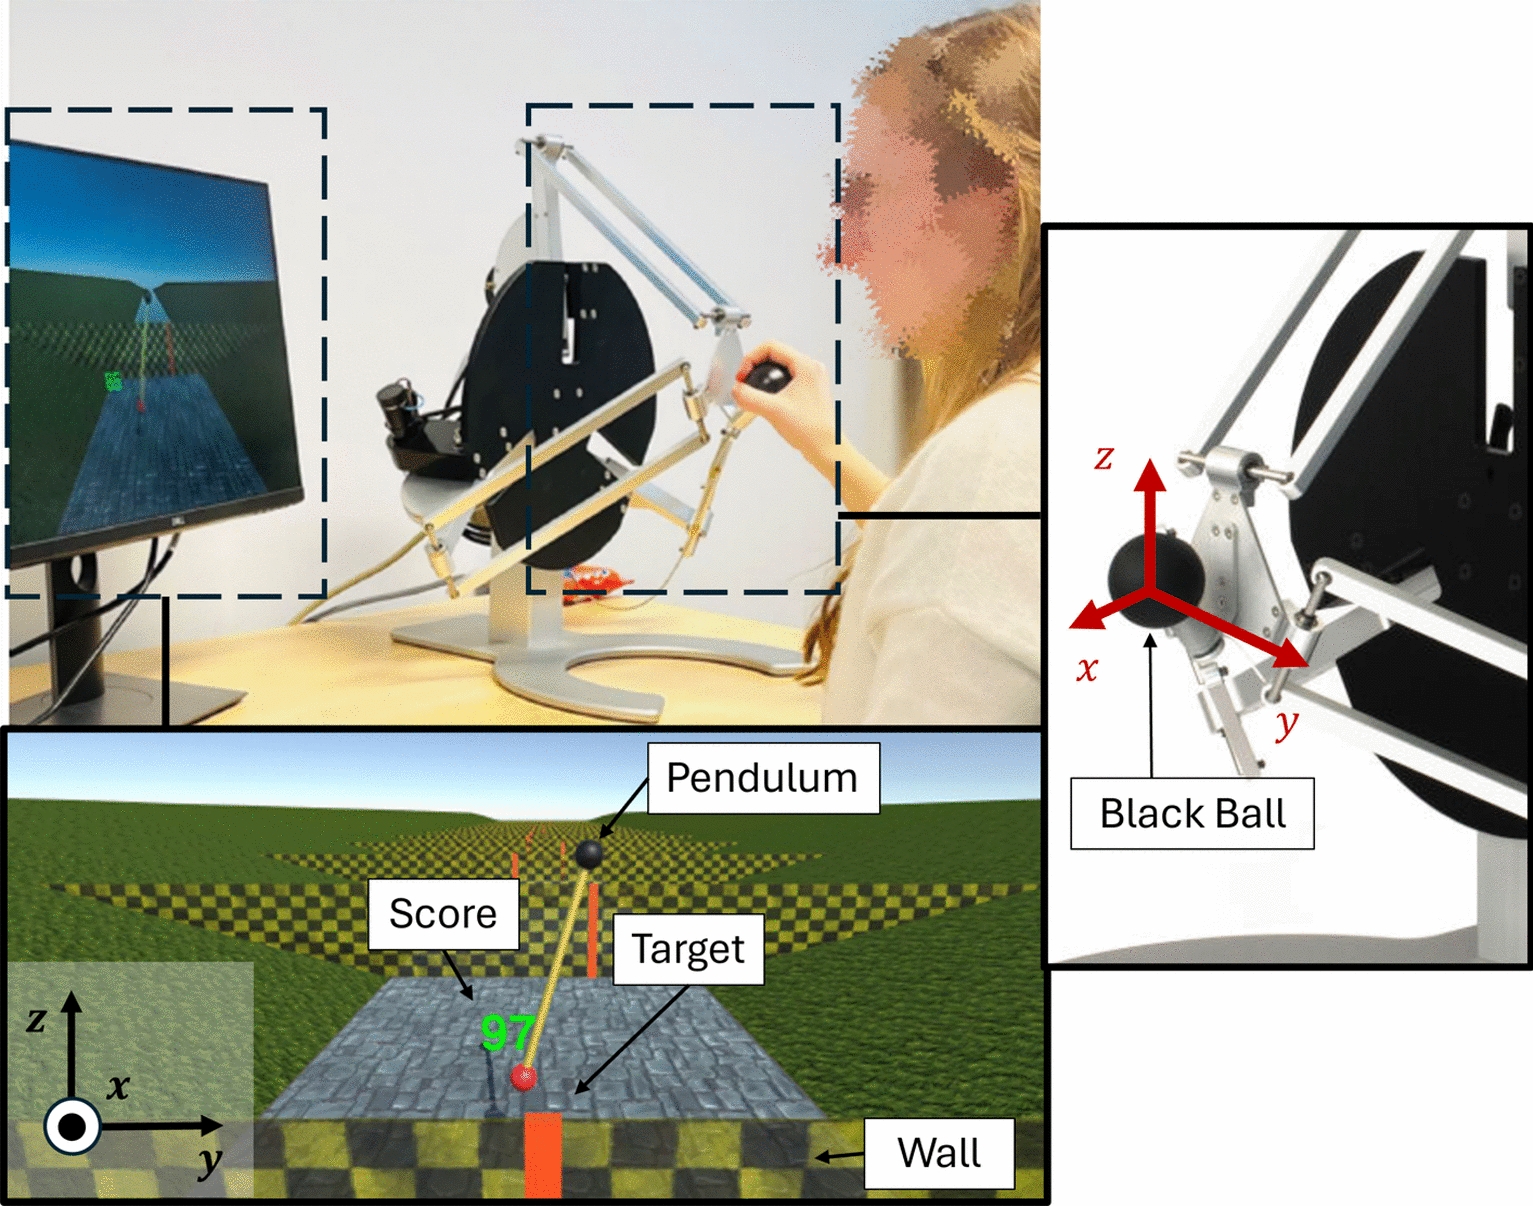
The experimental setup included a (Delta.3) haptic robot (Force Dimension, Switzerland) placed on a desk next to a display monitor (Fig. 1). The device is capable of measuring positions and providing forces up to 20.0 N in the three translational directions (x, y, and z axes, Fig. 1). The device control was implemented in C++, operating at 4 kHz. Motion data was recorded at 1.67 kHz.
The experimental setup (up left) consists of the screen and the (Delta.3) (Force Dimension, Switzerland). Down left: Game screenshot with the pendulum, walls in black and yellow, targets as vertical red lines, and the score in green numbers. Right: The device could be controlled by holding the black ball attached to the robot end-effector
The pendulum game
The game, inspired by the work of [44] and created in Unity 3D (Unity Technologies, USA), consisted of controlling a virtual pendulum to hit moving targets approaching the participant. The pendulum consisted of a black ball (pivoting point) and a red ball (pendulum mass), with a rigid link connecting both balls, as shown in Figs. 1 and 2. The pendulum’s pivoting point could be moved horizontally and vertically (y and z axis in Fig. 2) by displacing the haptic device’s end-effector (black ball in Fig. 1 Right; 1:1 movement mapping). The pendulum could only swing in the vertical plane (y–z), and therefore, movements of the haptic device in the x-direction were not mapped to the pendulum.
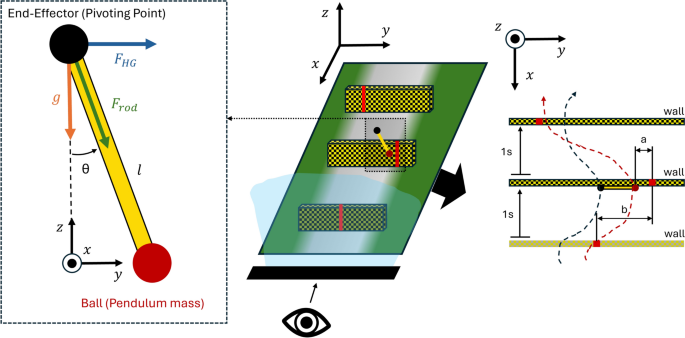
Left: Front view of the pendulum with forces applied on the pivoting point. (F_{HG}) represents the force from the haptic guidance while (F_{rod}) is the force from the pendulum dynamics. Center: 3D representation of the game. Right: Top view representation of the game with exemplary trajectories of the pivoting point and the pendulum mass, in black and red dashed lines respectively. The red lines within the walls represent the targets. The variable b represents the target position with respect to the centerline, while the variable a represents the absolute error between the pendulum mass and the target
The task consisted of hitting vertical targets with the pendulum mass. The targets were located on walls approaching the participants in the x direction, i.e., perpendicular to the screen plane. The walls were spaced by 1 m and their speed was set to 1 m/s. The targets could appear in three different positions: the center point of the wall or ± 0.12 m to the right/left. The target’s width was 0.02 m, and the pendulum ball and pivoting point diameter were set to 0.03 m.
By moving the pendulum pivoting point through the device end-effector, participants influenced the swing of the pendulum, which behaved according to the equation of motion of a simple pendulum:
$$begin{aligned} ddot{theta }=-frac{1}{l}((ddot{z}+g)sin {theta } + ddot{y}cos {theta })- frac{c}{ml^2}dot{theta }, end{aligned}$$
(1)
where y and z are the horizontal and vertical coordinates of the robot end-effector position and (ddot{theta }) the angular acceleration of the pendulum’s internal degree of freedom (DoF). Since the internal DoF was located at the pendulum’s pivoting point, (theta ) was defined relative to the pendulum rod, as illustrated in Fig. 2. The robot’s coordinates were referenced with respect to its initial position after calibration, similar to the one shown in Fig. 1right. The pendulum mass was set to (m = 0.6) kg, the rod length to (l = 0.25) m, gravity to (g = 3.24) m/(s^2), and the constant (c = 3.00e^{-6}) N(cdot )s/rad. These parameters were adjusted and chosen in order to minimize passive stabilization of the pendulum and maintain task difficulty.
As the pendulum crossed a wall, a score based on the absolute distance of the pendulum’s mass to the center of the target in the y-direction (|Error|) was briefly displayed for 0.5 s to provide feedback regarding participants’ performance. The score ranged between 0 and 100 and was calculated as:
$$begin{aligned} Score = {left{ begin{array}{ll} 0 & text {if } |Error| ge 0.2,m, \ 100-500cdot |Error| & text {if } |Error| < 0.2,m. end{array}right. } end{aligned}$$
(2)
Each phase of the experiment was organized into wall sets, with 20 walls presented per set (see the Study protocol Section). A final score, based on the average of all 20 scores, was shown at the end of each set to inform participants of their overall performance in that set.
Haptic rendering and haptic guidance
To enhance the ecological validity of the task — ensuring the experimental conditions closely replicate real-world scenarios — we incorporated haptic rendering throughout the whole experiment, i.e., the provision of the forces originating from the pendulum dynamics on the device end-effector. Participants could feel the pendulum force dynamics ((F_{rod})), calculated as:
$$begin{aligned} F_{rod}=m((ddot{z}+g)cos {theta }-ddot{y}sin {theta }+dot{theta }^2l), end{aligned}$$
(3)
using the same constants as in Eq. (1).
Participants allocated to the Experimental group were also provided with haptic guidance during training to physically assist them in the target-hitting task. This was achieved by first calculating an optimal end-effector trajectory between the pendulum state at the moment of target wall collision and the target at the following wall, and then enforcing this trajectory using a Proportional-Derivative (PD) controller.
The optimal end-effector trajectory was calculated every time the pendulum hit a target wall using the ACADO toolkit [45]. The cost function included terms to maximize accuracy (i.e., minimize the distance between the pendulum ball and the next target’s centerline), maximize the pendulum stabilization (i.e., penalizing the velocity components of the pendulum ball), and minimize end-effector acceleration based on the current state of the pendulum, as described in the Appendix B.
The PD controller aimed to minimize the distance between the end-effector and the reference trajectory in the y-direction at each time point by applying a guiding force (F_{HG}) at the end-effector. We only provided guidance in the y-axis as it was sufficient to achieve the target-hitting tasks. By not guiding in the z-direction, we also reduced the potential masking effects of the guidance on the perception of the haptic rendering of the pendulum dynamics. The resulting equation for the PD controller is as follows:
$$begin{aligned} F_{HG} = K_p e(t) + K_dfrac{d}{dt}e(t), end{aligned}$$
(4)
where the y-axis error between the actual and the reference trajectory was denoted as e(t), and the proportional ((K_p)) and derivative ((K_d)) gains were set to 75.0 N/m and 15 N(cdot )s/m, respectively. The guiding force was added to the haptic rendering force ((F_{rod}) in Eq. (3)). The order of magnitude of the guidance force was around four times the haptic rendering.
Participants
Forty-two unimpaired participants performed the experiment. Data from two participants were excluded from further analysis. One participant exhibited errors three standard deviations higher than the average of all participants. We encountered a technical problem when recording the data of a second participant, leading to missing data within the dataset. Thus, 40 participants were included in the analysis (age = (27 pm 6,yrs); 19 identified as female, 21 identified as male; no participants identified as non-binary). The target sample size of approximately 40 participants was determined based on a power analysis, as detailed in Appendix A. Handedness was assessed using the Short-Form Edinburgh Handedness Inventory [46], resulting in 35 right-handed, four left-handed, and one ambidextrous participant. All participants signed the informed consent to participate in the study, which was approved by the TU Delft Human Research Ethics Committee (HREC).
Participants were allocated into two training groups: Control or Experimental. The Experimental group received haptic guidance during some parts of the training phase (see the Study protocol Section), while the Control group practiced without any physical assistance. To promote an even distribution between groups, we used an adaptive randomization method. We randomly allocated the first twenty participants into one of the two training groups and distributed new ones into each group based on their sex and results from the Locus of Control questionnaire (see the Outcome metrics Section), similar to [7]. The Locus of Control was employed as it directly relates to the perception of control, which aligned with the groups’ training conditions (guidance vs. no guidance).
Study protocol
The experiment was conducted in two locations: Delft University of Technology, Delft, the Netherlands, and Alten Netherlands B.V., Rotterdam, the Netherlands. The experimental setup and protocol were identical in both locations. Minor environmental differences (e.g., room layout, lighting) were not expected to systematically affect performance. The overview of the experimental protocol can be found in Fig. 3.
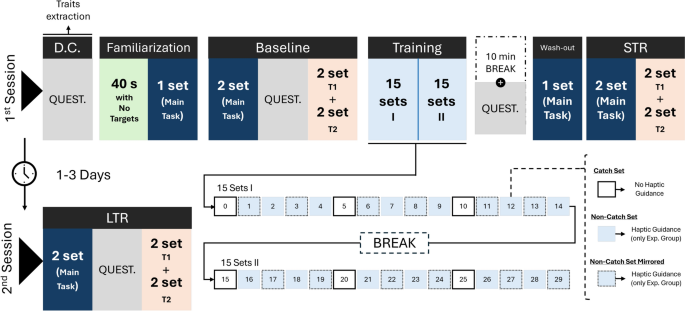
The study protocol included two sessions spaced by 1 to 3 days. A set comprised 20 targets. D.C.: Data collection, QUEST.: Questionnaires, s: Seconds, T1: Position transfer task, T2: Dynamics transfer task, STR: Short-Term retention, LTR: Long-Term retention, Exp.: Experimental
The experiment took place in two sessions on different days, with one to three days between sessions, following recommendations to evaluate motor learning [3]. At the beginning of the first session, participants were invited to sit at the set-up table. The chair height was adjusted based on personal preferences to ensure a comfortable arm movement within the robot’s workspace. The haptic device was placed at a reachable distance with a relaxed posture on the dominant hand’s side. The screen was placed on the opposite side of the device in front of the participant. Participants were informed about the goal of the pendulum task at the beginning of the first session. No extra information was given during the rest of the experiment.
The experiment began by inviting participants to fill out the first block of questionnaires, including demographic data collection and the questionnaires to quantify the personality traits (see the Outcome metrics Section). Participants were then invited to familiarize themselves with the haptic device and the virtual environment for 40 s. During this familiarization phase, they were asked to move the pendulum freely in the virtual environment without loading any target. They could observe the pendulum moving and feel the haptic rendering of the pendulum dynamics through the haptic device end-effector. Once the 40 s were over, participants were instructed again about the game goal: move the pendulum such that the red ball hits each wall as close as possible to the target’s center. They were then invited to play a first set of 20 targets.
Once the familiarization was completed, the main experiment began. Participants underwent three main phases during Session 1: baseline, training, and short-term retention. During these phases, participants performed one or three different tasks. The main task consisted of playing 20 targets in a specific order. Each time the main task was played, targets were set in the same sequence of positions, except during the training phase, in which some of the sets were mirrored (further explained later in this section). Participants also played two transfer tasks to asses the generalization of the acquired skill. Those tasks were similar to the main task but included slight design variations. In the position transfer task, the targets were randomly re-located (still appearing every 1 s) to introduce new movement sequences. During the dynamics transfer task, the target positions were kept the same as during the main task, but the pendulum dynamics were changed. While the appearance of the pendulum did not change, the pendulum rod length was reduced by 70% in Eq. (1) and (3). This variation affected the pendulum’s natural frequency, which increased from 0.573 Hz to 0.685 Hz. For both transfer tasks, the goal remained the same: Use the pendulum mass to hit each target.
The baseline included two sets of 20 targets for the main task. The game did not stop between sets within the same task, but there was an extended pause of three seconds in which no new targets were loaded. After the second set was finalized, participants completed a new set of questionnaires to assess motivation and agency. To keep our analysis focused on answering the listed hypotheses, the analysis of motivation and agency are out of the scope of this work. Participants were then asked to play the game two more times, for two sets of the position transfer task and two sets of the dynamics transfer task, with an on-demand break offered between the two tasks.
After the baseline trials were complete, participants began the training. They completed two rounds of 15 sets of the main task of 20 targets each. Participants had the opportunity to take a break between rounds. During training, the Experimental group received haptic guidance on top of the haptic rendering. However, to avoid participant reliance on the guidance, guidance was removed during the first set and once every five sets (“catch sets”). In addition, to avoid only learning the specific movement patterns and target positions, mirrored sets were interspersed within the non-catch sets for both groups. The position of the targets during these sets was mirrored with respect to the walls’ y-axis. The distribution of “catch sets” and mirrored sets can be found in Fig. 3. Participants were informed that they might or might not be assisted during training to promote active participation. The Control group only experienced the haptic rendering from the pendulum dynamics during training.
Immediately following the last training set, participants took a 10-minute break. During this time, they filled in a new set of questionnaires. The Experimental group was asked questions about their subjective experience with the robotic guidance, i.e., how disturbing, frustrating or restrictive it was perceived (see the Outcome metrics Section). Following the break, a washout set of the main task was conducted by both groups to mitigate any temporary effects from training with haptic guidance, e.g., “slacking” [47].
Right after the washout set, participants performed the short-term retention phase. The structure was similar to the baseline but without the questionnaire. Participants returned after one to three days to perform a long-term retention phase, which was structured identically to the baseline tests.
Outcome metrics
Personality traits questionnaires
Before the familiarization phase, participants completed a battery of questionnaires assessing the selected personality traits to study. These personality traits included the LOC scale [34], the Transform of Challenge and Transform of Boredom sub-scales from the Autotelic personality questionnaire [33], and the Achiever and Free Spirit sections of the Hexad Gaming style questionnaire [39]. All the questionnaires, except for the LOC, were formed by seven-point-based questions and normalized between 0 and 1 (low to high level of trait/characteristic). The LOC questionnaire was formed by 23 multiple-choice questions, and the overall score for the whole questionnaire ranged from 0 to 23. To improve interpretability and facilitate later modeling (see the Statistical analysis Section), this range was normalized from -1 to 1 to reflect the continuum between Internal LOC (-1) and External LOC (1), which are widely recognized classifications in literature and commonly used to interpret behavior. In addition, the LOC scores usually follow an approximate Gaussian distribution centered near zero. This makes this range statistically practical and close to the centered scale. Internal and external LOC differ in whether outcomes from an action are attributed to oneself or external circumstances, respectively. The employed questions for all the questionnaires can be found in the Appendix C.
Human-robot interaction experience questionnaire
Three questions were filled in by only the Experimental group after training. These questions related to frustration, disturbance, and restrictiveness perception during the training (see Appendix C). They were answered on a seven-point scale, which was then normalized between 0 and 1 (low to high).
Task performance: absolute error
To assess motor learning, the distance between the pendulum’s mass position and each target’s centerline at the time of pendulum-wall contact was calculated (|Error|), in meters. This was used as our performance metric and one value per wall was obtained.
Human-robot interaction: interaction force
To assess participants’ interaction with the haptic device, the human-robot interaction force was estimated. This estimate was computed using Reaction Torque Observers based on recorded motor currents and the robot dynamic model, as implemented in [44]. For the analysis, we used the average force per target in Newtons. We calculated this average force within the interval from consecutive midpoints between walls.
Statistical analysis
To evaluate the hypotheses outlined in the Introduction Section, we used Linear Mixed Models (LMMs). These models were fitted using the (texttt{lmer}) function from the (texttt{lmerTest}) package in (texttt{R}). Statistical significance was set at (p < 0.05), and p-values were adjusted for multiple comparisons using Bonferroni correction.
The employed LMMs were selected as outlined in Appendix D. We group them throughout the current section depending on the hypotheses they are tailored to evaluate. Table 1 summarizes the variables that can be included in the models. Task performance (|Error|) and human-robot interaction force (|IntForce|) metrics were analyzed as dependent variables depending on the model. Logarithmic transformations were applied to correct skewed distributions and achieve normality requirements.
Models to infer motor learning (M1.1 and M1.2)
To evaluate the impact of personality traits and the training condition on motor learning outcomes across different experimental phases (related to hypotheses H1 and H2) we employed two models, one for each dependent variable. These models include independent variables regarding the training group, the task type, the stage, and the personality traits (see description in Table 1). Given the extensive number of variables and potential interactions, a stepwise comparison between models of different complexity was performed using the Akaike Information Criterion (AIC) and Bayesian Information Criterion (BIC) to prevent overfitting and ensure stability (see Appendix D).
For the performance metric (|Error|), the following model (M1.1) with the smallest AIC and BIC was chosen:
$$begin{aligned} log_{{10}} |{text{Error}}| & = Group times (Task + Stage) \ & + (TC_{c} + LOC_{c} ) \ & times (Task + Stage + sIndex) \ & + Task times Stage + Group \ & times TC_{c} times Stage + (1|ID) \ & + (1|wIndex:NewWalls). \ end{aligned} $$
In this equation, the normalized and centered results from the Transform of Challenge ((TC_c)) and Locus of Control (LOCc) were included as traits of interest, as others did not show statistical significance during model selection. Therefore, the hypothesis related to the Achiever gaming style (H1.3) is not supported by the data. A nested random effect for wall index (wIndex : NewWalls) was adjusted to account for changes in wall positioning during the position-based transfer task.
A similar model (M1.2) was developed for the interaction force metric. Notably, this model included an additional interaction term, (Group times LOC_c times Stage). When compared with other configurations, the model with this extra interaction led to a lower AIC and slightly increased BIC (see Appendix D). In view of these competing results, previous literature was used to guide the choice. This extra relationship was considered of interest as LOC was found to correlate to the interaction force metric during the training phase when the haptic guidance was active (see [43]). The final model has the form:
$$ begin{aligned} log _{{10}} |{text{IntForce}}| & = Group times (Task + Stage) \ & + (TC_{c} + LOC_{c} ) \ & times (Task + Stage + sIndex) \ & + Task times Stage + Group times TC_{c} \ & times Stage + Group times LOC_{c} \ & times Stage + (1|ID) \ & + (1|wIndex:NewWalls). \ end{aligned} $$
Note that while this model does not include the Free Spirit gaming style, results from an alternative model (see Appendixes D and E) suggest a potential relationship between this trait and interaction force outcomes, which can be considered of interest for hypothesis H1.4. Yet, fully evaluating this effect would require studying the model complexity beyond the current study’s scope, complicating the understanding of the results. As such, we leave a thorough investigation of H1.4 for future work.
Human-robot interaction perception model (M2)
To investigate whether subjective perceptions of human-robot interaction (HRI) influenced task performance (H3), we employed the following model:
$$ begin{aligned} log _{{10}} |{text{Error}}| & = (AC_{c} + FS_{c} + TC_{c} + LOC_{c} ) \ & times HRIQuestion times Stage \ & + (1|ID) + (1|wIndex), \ end{aligned} $$
where the HRIQuestion represents the normalized and centered response to each of the specific HRI perception questions. The normalized and centered version of four of the traits were considered of interest for this model, i.e., the Achiever ((AC_c)) and Free Spirit ((FS_c)) gaming styles, Transform of Challenge ((TC_c)), and Locus of Control ((LOC_c)). All the phases were included in this dataset (baseline, training, short- and long-term retention) while the transfer tasks were excluded as HRI questions were asked exclusively after the training phase, which did not include the transfer tasks.