Cucumber cultivars characterized by NFR
To demonstrate the potential effects of cultivar-dependent variation in shoot architecture on cucumber yield, we selected four commercially available Japanese cultivars (‘Josho’, ‘S-30’, ‘G-Flush’, and ‘Yusho’), which are recognized for their different levels of vigor. The experiment was conducted in 2021, with plants grown in a greenhouse under the conditions shown in Fig. 1. We assessed node numbers and found that ‘Josho’ had formed more nodes than all other cultivars by the end of cultivation period (Fig. 2A). Then, we analyzed changes in the NFR, calculated as the number of nodes formed per unit of daily average temperature, throughout the experiment (Fig. 2B). The NFR was higher in ‘Josho’ than in the other cultivars, particularly ‘S-30’ and ‘Yusho’. The mean NFRs were 2.2 × 10⁻² nodes °C–1 day–1 for ‘Josho’ and approximately 1.5 × 10⁻² nodes °C–1 day–1 for the other cultivars. A similar trend was observed in a separate short-term experiment conducted in a different greenhouse and year (Fig. S2), suggesting that the observed differences are cultivar-dependent rather than condition-dependent. We also noted cultivar-specific variation in the position of open female flowers along the stem. In ‘Josho’, open female flowers tended to appear at nodes farther from the shoot tip compared to the other cultivars (Fig. S3), implying more rapid stem growth. These findings indicate that the cultivars are distinguishable by their shoot architecture, particularly in terms of NFR and node number.
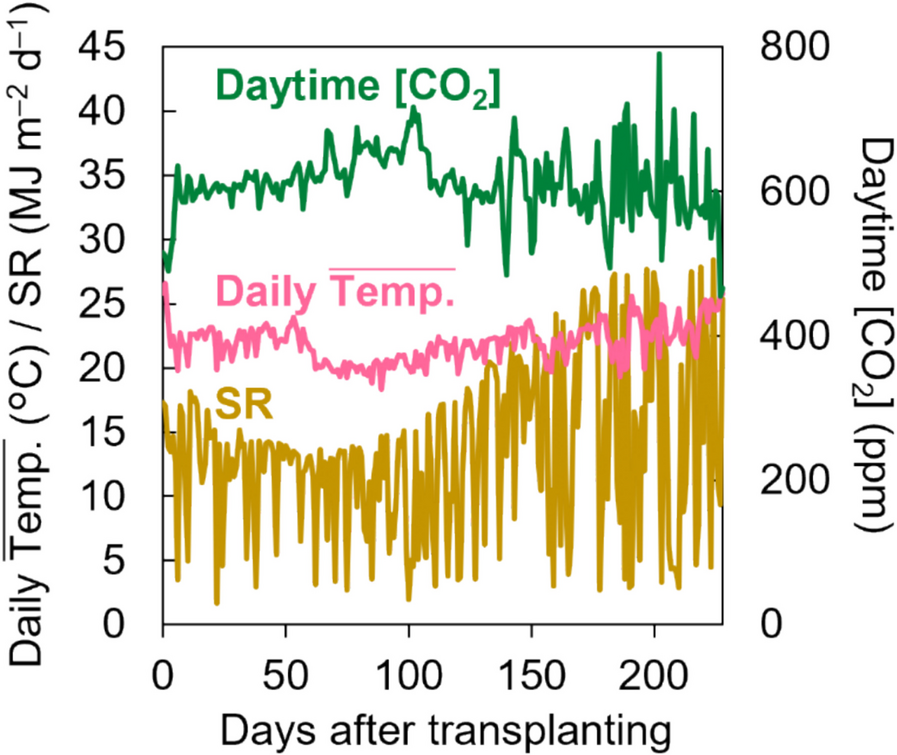
Growth conditions during cultivation. Daytime CO2 concentration, daily average temperature within the greenhouse, and cumulative daily solar radiation are shown
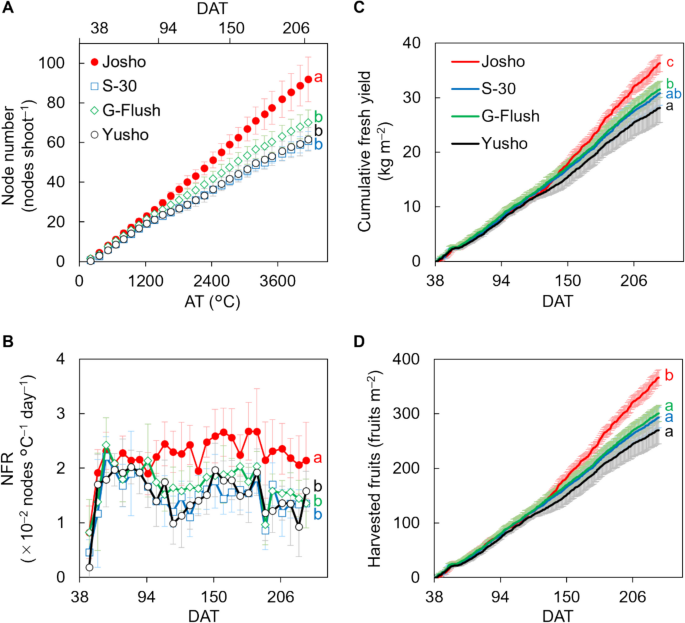
Node formation rate (NFR) and fruit yield of each cultivar. A Changes in the number of nodes. Node number was expressed as a function of accumulated temperature (AT). B Changes in the NFR in response to AT. C Cumulative fresh yields. D Total amount of harvested fruit. Data are means of six (A, B) or nine (C, D) plants with 95% confidence intervals (CIs). Different letters indicate significant differences in the final value (A, C, and D) or average NFR throughout the experiment (B) (P < 0.05, Tukey’s test)
Comparison of fruit yield among cultivars
Final fresh yield was highest in ‘Josho’ (approximately 36.3 kg m–2), consistent with its elevated NFR compared to the other cultivars (Fig. 2C). The number of harvested fruits followed a similar pattern: ‘Josho’ produced around 360 fruits per unit area, whereas the other cultivars yielded approximately 300 or fewer (Fig. 2D). Mean harvested fruit weight was around 100 g fruit–1 (Fig. S4A). The ratio of aborted fruits, which were excluded from yield calculations, was higher in ‘Josho’ (approximately 7.4%) than in the others (1.0% or less, Fig. S4B). Female flowering rates were broadly similar across cultivars, although ‘G-Flush’ exhibited a slightly lower rate (Fig. S4C). These findings suggest that yield differences were primarily driven by variation in node formation, rather than by fruit abortion or female flowering frequency in the cultivars examined.
DM distribution
Next, we compared the cultivars in terms of how DM was partitioned to fruit. The experimental period was divided into five terms based on the timing of destructive measurements (term 1: 0–45 DAT; term 2: 45–66 DAT; term 3: 66–105 DAT; term 4: 105–142 DAT; term 5: 142–228 DAT), and DM partitioning was analyzed for each term. As shown in Fig. 3A, DM partitioning in ‘Josho’ during the first term was 0.15 g g–1 and remained around 0.5 g g–1 in later terms. In contrast, the other cultivars, particularly ‘Yusho’, showed higher early DM partitioning (approximately 0.2 g g–1) but failed to maintain these levels beyond the third term. In the final term, DM partitioning in ‘S-30’, ‘G-Flush’, and ‘Yusho’ declined to approximately 0.4 g g–1. As a result, the cumulative fruit dry yield relative to TDM in ‘Josho’ continued to increase, reaching 0.48 g g–1 by the end of the experiment. In comparison, the other cultivars peaked at around 0.44 g g–1 on 105 DAT and declined thereafter (Fig. S5A). Additionally, DM content per fruit was comparable across cultivars, confirming that fruit quality was consistent (Fig. S5B). Together, these results indicate that reduced node formation suppressed DM partitioning to fruit.
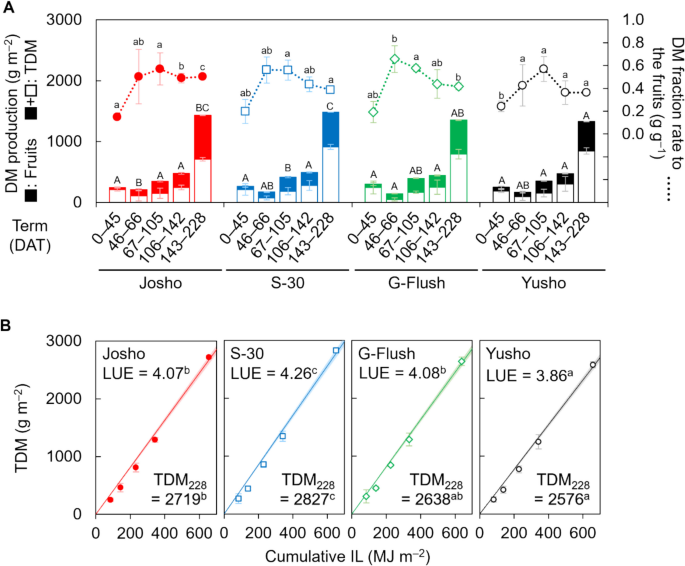
Dry-matter (DM) partitioning and productivity of each cultivar. A DM production and distribution of fruits analyzed for five intervals between destructive measurements. B Light use efficiency (LUE). Lines and shading indicate regression lines for TDM and their 95% CIs, respectively. LUE was estimated as a regression coefficient. Total DM (TDM) at the end of cultivation (TDM228) is also shown. Data are means of three (first to fourth destructive measurements) or nine (last measurement) plants with 95% CIs. Different letters indicate significant differences (P < 0.05; Tukey’s test) within the same intervals (A, lower case: DM fraction rate; upper case: TDM) or among cultivars (B)
DM productivity
Although yield differences among the cultivars could be attributable to variation in both shoot architecture and DM productivity, this did not appear to be the case in the present experiment. TDM across the five experimental terms was largely comparable among cultivars, except during the third and final terms (Fig. 3A). Notably, ‘S-30’, but not ‘Josho’, tended to exhibit higher TDM. In the third and final terms, TDM in ‘S-30’ reached 417 and 1,484 g m–2, respectively, while the values for ‘Josho’ were 348 and 1,431 g m–2. ‘Yusho’ showed the lowest TDM in the final term (1,329 g m–2). As LAI was maintained at approximately 2.4 m2 m–2 across all cultivars, cumulative IL was estimated to be similar among cultivars (around 650 MJ m–2; Fig. S6). Consequently, LUE varied as shown in Figure S7, with ‘S-30’ exhibiting the highest LUE (4.26 g MJ–1), followed by ‘G-Flush’ (4.08 g MJ–1), ‘Josho’ (4.07 g MJ–1), and ‘Yusho’ (3.86 g MJ–1). Similar trends were observed in TDM at the end of the experiment (Fig. 3B). The discrepancies between yield and TDM or LUE suggest that DM productivity had only a marginal effect on yield differences among cultivars. Indeed, correlation analysis of the yield components revealed no significant relationship between yield and DM productivity. In contrast, a strong correlation was observed between node formation and fruit yield (Fig. 4). These findings demonstrate that cultivar-dependent shoot architecture can influence fruit yield independently of DM productivity in cucumber plants.
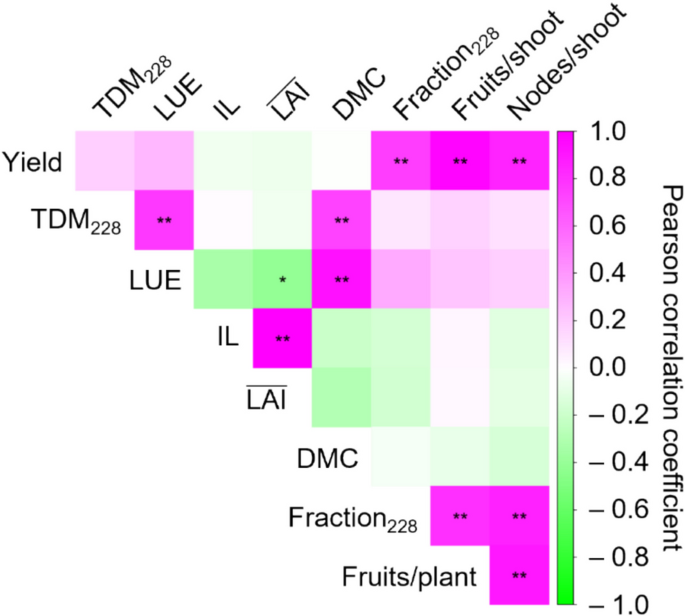
Assessment of the four cucumber cultivars based on yield components. Data obtained for each cultivar were pooled and correlations among yield components were analyzed. The correlation matrix is visualized as a heatmap. Asterisks indicate significant correlations (*P < 0.05, **P < 0.01; Benjamini–Hochberg adjustment). DMC, DM content of fruits
Transcriptomic diversity among cultivars
In cucumber plants, nodes are produced by the SAM while flowers develop from the leaf axil at each node [3], underscoring the importance of SAM activity for yield. Certain meristem identity-regulating genes determine whether the SAM exhibits determinate or indeterminate growth in Cucumis sativus [3]. These findings suggest genetic diversity among the shoot tips of the four cultivars. To explore this possibility, we performed mRNA-seq using RNA extracted from their shoot tips. We identified more than 500 differentially expressed genes (DEGs), assessed using the criteria |fold change|> 2 and false discovery rate (FDR) < 0.05, in pairwise comparisons between ‘Josho’ and the other cultivars (Figs. 5 and S8, and Dataset S1). We also examined the expression of genes previously reported to regulate SAM identity (Table S1), including PEBPs involved in floral meristem induction (CsFT, CsTFL1, CsTFL1d); subunits of protein complexes including CsFT or CsTFL1/CsTFL1d (CsNOT2a, CsFD, CsFDP, CsGF14-3, CsGF14-5); and transcription factors and their interactors involved in SAM maintenance and floral meristem differentiation (CsLFY, CsWUS, CsUFO, CsHAN1, CsHAN2, CsSTM, CsBP). We initially expected some of these genes to meet the criteria for differential expression, but none qualified as DEGs. However, CsTFL1 in ‘S-30’, CsGF14-3 and CsGF14-5 in ‘G-Flush’, and CsBP in all three cultivars showed modest reductions (approximately 30% on average) compared to ‘Josho’ (Dataset S2). To further investigate physiological differences, we conducted Gene Ontology (GO) enrichment analysis of DEGs common among ‘S-30’, ‘G-Flush’, and ‘Yusho’. We selected 42 downregulated and 16 upregulated genes and analyzed their enrichment in biological processes. Only one GO term was significantly enriched among upregulated genes, related to carbon fixation. This term included two DEGs: CsaV3_4G001210, which encodes a putative CP12 domain-containing protein, and CsaV3_6G048750, a putative RbcX homolog (Fig. S9A and Datasets S3 and S4). In contrast, downregulated DEGs were enriched for GO terms associated with heat response, cell division, and β-oxidation. These included putative condensin proteins (CsaV3_UNG044290, CsaV3_UNG075600, CsaV3_UNG088700, CsaV3_UNG225770), heat-shock proteins and co-chaperones (CsaV3_1G035820, CsaV3_1G035830, CsaV3_1G044020, CsaV3_3G006720, CsaV3_5G026520), a multiprotein bridging factor 1c (MBF1c) homolog (CsaV3_2G002310), an ankyrin repeat-containing protein (CsaV3_1G010260), and 3-hydroxyacyl-CoA dehydrogenase proteins (CsaV3_6G023960, CsaV3_6G024070, CsaV3_024110) (Fig. S9B and Datasets S3 and S4). These findings indicate that the shoot tips of the four cultivars differ at the transcriptional level, which may reflect genetic factors underlying the observed variation in NFR.
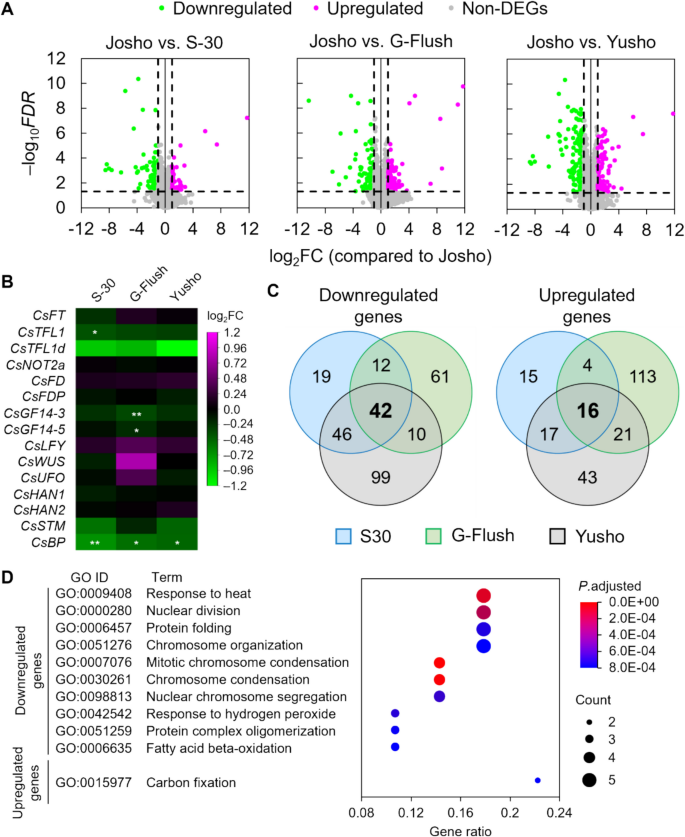
Comparison of the transcriptome in shoot tips between the ‘Josho’ cultivar and other cultivars via mRNA sequencing. (A) Volcano plots representing each pairwise comparison. Horizontal and vertical axes represent fold changes (FCs) and false discovery rates (FDRs), respectively, in logarithmic scale. See also Figure S8. (B) FCs of genes involved in shoot apical meristem (SAM) maintenance and floral meristem differentiation reported in previous studies (Table S1). Asterisks indicate the FDR and FC of each gene (*FDR < 0.05; **FDR < 0.01). (C) Venn diagrams representing the numbers of genes down- or upregulated in the ‘S-30’, ‘G-Flush’, and ‘Yusho’ cultivars compared to ‘Josho’. Common differentially expressed genes (DEGs) are shown in bold. (D) Gene Ontology (GO) enrichment analysis of biological processes. The top 10 GO terms are shown for the common down- and upregulated genes in ascending order of P values adjusted using the Benjamini–Hochberg method. Normalized count data and overall GO enrichment analysis results are provided in Datasets S1–S4