Animals
A total of 150 wild-type C57BL/6J mice, comprising 130 males and 20 females, were used in this study. This cohort included 120 young adult mice (2 months old; body weight: 20–30 g), 20 aged male mice (18 months old; body weight: 30–40 g), and 10 neonatal pups (6 days old). Young adult and aged mice were supplied by GemPharmatech Co., Ltd (Nanjing, China; License No. SCXK(Yue)2020-0054). Neonatal mice were obtained from the Guangdong Medical Laboratory Animal Center (Guangzhou, China). All the mice were housed in a specific pathogen-free facility under a 12-hour light/dark cycle with controlled temperature (24 ± 2 °C) and humidity (30–70%). The animals had ad libitum access to food/water and were group-housed (5 per cage). The mice were euthanized on day 14 via isoflurane overdose (RWD; Shenzhen, China; Cat# R510-22). Animal protocols were approved by the Institutional Animal Care and Ethics Committee of Guangdong Academy of Sciences (Approval No. K2024-01–130-480; February 20, 2024) and conducted in compliance with the NIH Guide for the Care and Use of Laboratory Animals (8th ed., 2011) and ARRIVE guidelines (Percie du Sert et al., 2020).
Isolation of human bone marrow mesenchymal stem cells (BM-MSC)
Heparinized bone marrow aspirates were obtained from healthy donors (recruited via the Third Affiliated Hospital of Sun Yat-sen University) after providing informed consent. BM-MSC were isolated via Ficoll-Paque (1.077 g/mL; GE Healthcare, Cat# 17−1440-02) density gradient centrifugation. The cells were cultured in MSC basal medium (Gibco, Cat# A11577-01) supplemented with BM-MSC growth supplement (Gibco; Cat# A13829-01). For migrasome inhibition, BM-MSC at 70% confluence were treated with blebbistatin (BLEB, 50 µM, 24 h; MCE, Cat# HY-13441). The study was approved by the Ethics Committee of the Third Affiliated Hospital of Sun Yat-sen University (Approval No. 2022-2; September 2, 2022) following ISSCR guidelines (2021).
Primary culture of thymic epithelial cells (TEC)
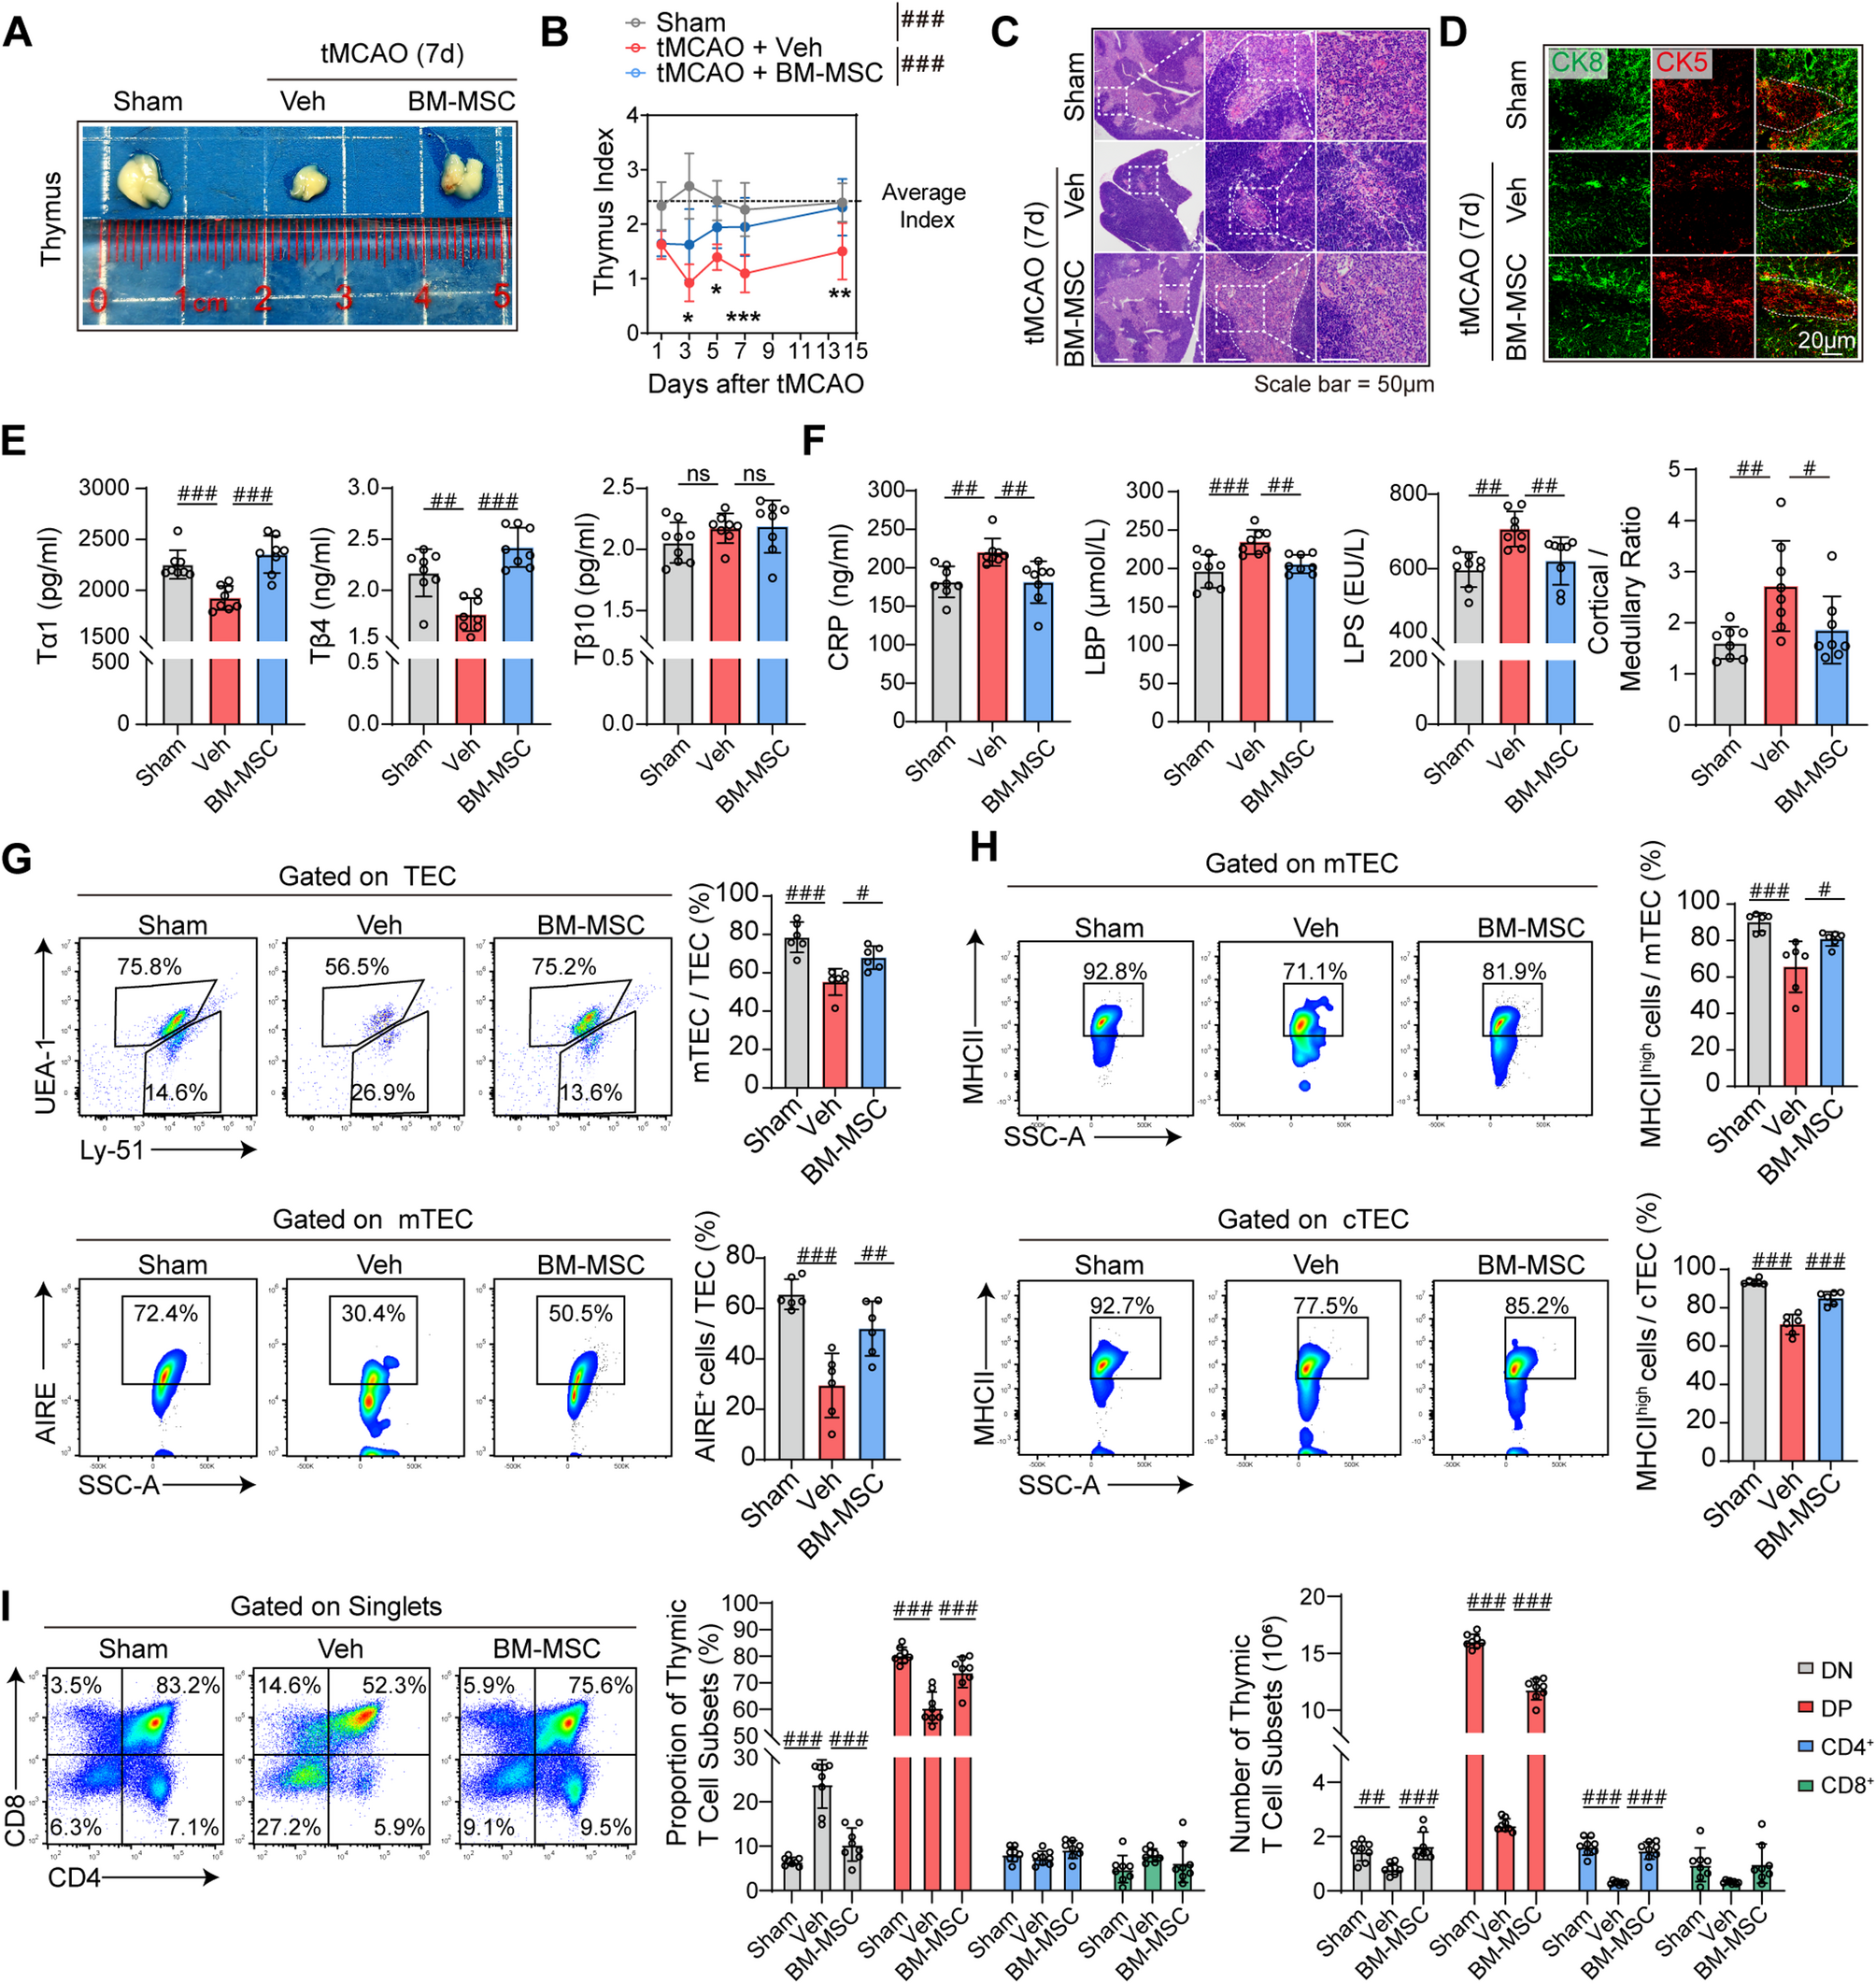
The primary culture of thymic epithelial cells was performed as previously described with modifications [51]. Primary cells were characterized by immunofluorescence staining for the epithelial markers CK5 and CK8 (Fig. S13A).
Materials
Six 2–5-day-old neonatal mice were used. The complete media used were as follows: DMEM/F12 supplemented with human HDL (100 µg/mL), transferrin (50 µg/mL), insulin (5 µg/mL), hydrocortisone (2.7 × 10⁻⁷ mol/L), EGF (20 ng/mL), sodium selenite (25 ng/mL), and T3 (1 × 10⁻¹⁰ mol/L). Primary digestion: 1.5 mg/mL collagenase IV (Sigma, Cat# C5138) + 500 U DNase I (Sigma, Cat# D5025) in 10 mL of PBS. Passage digestion: 0.25% trypsin + 15 KU DNase I in 10 mL of Ca²⁺/Mg²⁺-free PBS.
Primary culture protocol
The neonates were disinfected with 75% ethanol for 30 s and placed in a biosafety cabinet. Thymic glands were excised via midline thoracic incisions and transferred to DMEM/F12. The samples were minced into 1 mm³ fragments and washed twice with complete medium (300 × g, 5 min). The mixture was digested with primary digestion solution at 37 °C for 90 min with gentle agitation every 10 min. The mixture was subsequently centrifuged (300 × g, 5 min) and washed twice with medium. Thirty to forty fragments were plated in a 25 cm² flask with 5 mL of complete medium. Nonadherent debris was removed after 3 days. The epithelial cell islands emerged within 2‒3 days and reached 80% confluency within 2‒3 weeks.
Subculture protocol
At confluency, the cells were digested with 2 mL of passage mixture (37 °C, 15–20 min). The digestion was stopped with 200 µL of 1% soybean trypsin inhibitor (Sigma, Cat# T6522). The cells were subsequently centrifuged (300 × g, 5 min) and passaged at a 1:3 ratio in fresh medium.
Murine models of acute cerebral ischemic stroke
Focal cerebral ischemia was established via the transient middle cerebral artery occlusion (tMCAO) paradigm, which was modified from established protocols [52]. The animals were anesthetized with isoflurane (5% in 1 L/min gas flow for induction, 1.5% for maintenance in 30% O₂/70% N₂O) with the core temperature regulated at 37.0 ± 0.5 °C via a feedback-controlled heating pad. Preemptive analgesia consisted of meloxicam (2.0 mg/kg, s.c.) administered 1 h before incision, combined with local lidocaine infiltration (1.5 mg/kg) at the surgical margins. Postoperatively, meloxicam (0.5 mg/kg, s.c.) was injected daily from 24 to 72 h to manage inflammatory pain. Through microsurgical exposure of the carotid bifurcation, a silicone-coated monofilament (Doccol Corp, 6 − 0) was retrograde introduced into the external carotid stump and advanced 9–11 mm through the internal carotid artery to achieve MCA trunk occlusion. Laser Doppler perfusion imaging (PeriFlux 5000, Perimed AB) confirmed the efficacy of vascular occlusion through real-time cortical blood flow monitoring at bregma − 2 mm coordinates. Regional cerebral blood flow (CBF) was continuously recorded during the preischemia, ischemia, and 15-min postreperfusion phases (see Supplementary Fig. 1C for group-specific data). Animals demonstrating < 70% perfusion reduction from baseline (calculated as ischemic core CBF/preocclusion CBF ×100%) or exhibiting intraoperative mortality were eliminated per predefined exclusion criteria. After 60 min of ischemia, controlled reperfusion was achieved through withdrawal of the filament under antithrombotic surveillance. Sham controls underwent identical cervical dissection without vascular occlusion.
BM-MSC transplantation and migrasome administration in mice
For transplantation, 2 × 10⁶ BM-MSC (passages 5–8) in 0.2 mL of PBS were infused via the retro-orbital venous sinus 2 h post-tMCAO. For migrasome delivery, BM-MSC-derived migrasomes (10 mg/kg in 0.2 mL PBS) were administered through the same route at the same time point (2 h post-induction). This standardized protocol eliminates temporal variables as confounders in therapeutic efficacy comparisons.
Assessment of neurological function
Modified Garcia scores (0–3 scale across five domains: body proprioception, vibrissae touch, limb symmetry, lateral turning, and forelimb walking) were evaluated daily for 3 days after tMCAO.
Infarct volume analysis
Six serial coronal sections obtained at regular intervals (2 mm spacing) through the middle cerebral artery territory were subjected to immunohistochemical labeling using a monoclonal neuronal nuclei marker (NeuN; clone EP3978, dilution 1:1000; Abcam ab177487). Digital image analysis was performed on systematically sampled tissue sections by an independent researcher blinded to the experimental conditions via ImageJ 1.53e software (National Institutes of Health). Structural damage quantification accounts for tissue edema via the following calculation: Final infarct volume (mm³) = (Vcontra – Vipsi_noninfarct) × section thickness × sampling interval, where Vcontra represents the contralesional hemispheric volume and Vipsi_noninfarct indicates preserved neuronal tissue volume in the injured hemisphere.
Behavioral tests
Sensorimotor functions were assessed via rotarod and foot-fault tests performed 1–3 days before tMCAO and 3–5 days after tMCAO. Cognitive functions were evaluated with the Morris water maze (WTIM) (days 9–13 post-tMCAO) and novel object recognition test (ORTM) (day 11 post-tMCAO). A schematic timeline is provided in Supplementary Fig. 11A.
Novel object recognition
The test was conducted in an open-field arena containing two geometrically identical polypropylene objects. After a 60-min familiarization phase with identical objects, one object was replaced with a novel stimulus (matched in size but differing in surface texture) for a 10-min test phase. Exploration time (nose-point proximity ≤ 2 cm) was quantified via automated video tracking (EthoVision 15.0, Noldus). Cognitive performance was assessed by the normalized recognition index (RI = Tnovel/[Tnovel + Tfamiliar] ×100%) and discrimination index (DI = [Tnovel – Tfamiliar]/[Tnovel + Tfamiliar]).
Morris water maze test
Hippocampus-dependent spatial learning was evaluated on postoperative days 9–13 via a modified protocol. The apparatus consisted of a circular pool (150 cm diameter) filled with titanium dioxide-opacified water and a hidden acrylic platform (11 × 11 cm) submerged 20 mm below the surface. Hidden platform training (days 9–12): Four daily trials (60 s/trial) were conducted with randomized entry points. The mice were allowed 30 s on the platform after each trial, with spatial cues maintained in the testing room. Probe trial (day 13): The platform was removed, and the time spent in the target quadrant during a 60-sec session was recorded to assess spatial memory retention.
Rotarod
Preoperative acclimatization included 3 consecutive days of speed-ramping training (0–300 rpm over 360 s), with day 3 performance used as the baseline. Post tMCAO assessments (day 3) employed identical parameters (6-min acceleration phase followed by constant speed). Trials terminated when an animal disengaged from the rod or underwent ≥ 2 cycles of passive rotation. Motor persistence latency (fall/spin duration) was calculated as the average of three trials.
Foot fault
Rodents underwent preoperative gridwalk acclimatization for 3 consecutive days on a 40 × 20 cm elevated grid (4 cm² apertures), with baseline forelimb coordination quantified from day 3 performance metrics. Post-tMCAO assessments on day 3 involved 60-second trials recorded under controlled lighting. Total ambulatory steps and forelimb misplacements (limb descent below the grid plane) were manually quantified by two independent observers blinded to the treatment groups, with the error frequency expressed relative to motion intensity (faults per 100 steps).
Isolation of BM-MSC-derived migrasomes
BM-MSC cultures at 50% confluence provided conditioned media for vesicle isolation. Sequential differential centrifugation (1,000 g ×10 min →4,000 g ×20 min) was used to clarify the supernatants prior to ultracentrifugation (100,000 g ×70 min, Optima XE-100, Beckman Coulter) for EV enrichment. Migrasome harvesting required fibronectin-coated substrates (0.1 µg/cm², Corning® BioCoat™) with trypsinization (0.125% TrypLE™) at 50% confluence. The processed supernatants were subjected to staged clarification (1,000 × g/4,000 × g), followed by pelleting at 20,000 × g for 30 min. Contaminant elimination protocols involve iterative washing cycles (PBS + matching centrifugal forces).
Bulk RNA sequencing and data analysis
Thymic RNA was isolated via TRIzol-based protocols with RNA integrity validation (RIN ≥ 8.0, Bioanalyzer 2100). Sequencing libraries were prepared via the NEBNext Ultra II Directional RNA Library Kit (E7760S) following ribosomal RNA depletion (NEBNext rRNA Removal Kit). Pooled libraries were subjected to 150 bp paired-end sequencing on NovaSeq 6000 SP flow cells (Illumina, 40 M reads/sample). Differentially expressed genes were identified via DESeq2 (v1.40.2) with significance thresholds (FDR-adjusted p < 0.05, |log2FC|≥1). Functional annotation was performed through clusterProfiler (v4.4.4) via the current GO (2023–10 release) and Reactome (v84) databases.
Quality control of the bulk RNA-seq data was performed through principal component analysis (PCA), relative log expression (RLE) diagnostics, and expression distribution assessment (Fig. S14). PCA was conducted on the basis of the FPKM-normalized gene expression values across all the samples. The raw count matrices were processed via edgeR. Library size normalization was performed via calcNormFactors with TMM weighting, followed by calculation of variance-stabilized log₂ (CPM + 1) values. The RLE diagnostics were visualized via the EDASeq package. Expression distributions were evaluated through: density plots and boxplots of log₂-transformed raw counts (log₂ (count + 1)) to mitigate variance inflation from highly expressed genes. Analogous visualizations of log₂ (FPKM + 1) values to account for gene length and sequencing depth effects. This comprehensive suite of quality assessment analyses (PCA, RLE, expression distribution diagnostics based on the basis of counts and FPKM) demonstrates that our bulk RNA-seq data from thymic tissue are of high quality and free from major technical artifacts.
ScRNA-seq and data analysis
Thymic cell suspensions were prepared from a total of 12 mice (n = 4 biologically independent mice per group for Veh, BM-MSC, and Migrasome treatments). Cell suspensions were centrifuged at 800 × g for 5 min. Pelleted cells underwent CD45− based enrichment via anti-mouse CD45 MicroBeads and magnetic-activated cell sorting (MACS). To ensure sufficient cell numbers for capturing rare TEC subsets and to minimize inter-individual variation, CD45− enriched cells from the 4 mice within the same treatment group were pooled at equal quantities, resulting in one final sample pool per group for sequencing. The cells were sorted at a CD45⁻:CD45⁺ ratio of 5:1 to further enrich TEC.
Single-cell libraries were prepared with sorted cells (viability > 85%) loaded onto chromium microfluidic chips (10X Genomics) employing 3’ chemistry. All samples from the three groups were processed simultaneously in a single batch for tissue processing, cell sorting, library construction, and sequencing to prevent technical batch effects. Barcoding was performed via the Chromium Controller (10X Genomics). Reverse transcription and library construction were performed via the Chromium Single Cell 3’ v2 Reagent Kit (10X Genomics) per the manufacturer’s protocol. Libraries were sequenced on Illumina platforms (paired-end).
The raw sequencing data were subjected to quality control via fastp with adapter trimming and quality filtering (Q20 threshold). Processed reads were demultiplexed and aligned to the mm10 reference genome using Cell Ranger with default parameters. Digital gene expression matrices were generated through unique molecular identifier (UMI) counting.
Downstream analysis was performed in Seurat (v5.0) with sequential filtering: genes detected in < 3 cells were excluded, cells with < 1000 expressed genes were excluded and potential doublets identified by scDblFinder were removed. The cell clusters were annotated based on canonical markers. Differentially expressed genes (adjusted p < 0.05, |log₂FC|>1) underwent functional enrichment via clusterProfiler with gene length bias correction. Significantly enriched GO terms and KEGG pathways (FDR < 0.05) were reported. Pseudotime trajectories were reconstructed using monocle3 with default graph learning parameters.
Liquid chromatography-tandem mass spectrometry (LC‒MS/MS) analysis
The migrasome protein composition was characterized via liquid chromatography tandem mass spectrometry (LC‒MS/MS). Proteins were resolved via SDS‒PAGE (12% separating gel) and stained with Coomassie Brilliant Blue R-250. Gel slices containing target proteins were subjected to in-gel tryptic digestion (16 h, 37 °C) prior to analysis. Mass spectrometry was performed via a Q Exactive system (Thermo Fisher Scientific) with nanoelectrospray ionization (NanoFlex source). Raw spectral data processing, including protein identification and quantitative analysis, was executed through the PEAKS Studio platform (v8.5) under strict filtering criteria (FDR < 1%).
Histological analyses
Thymus samples were fixed in 4% paraformaldehyde (PBS, pH 7.4) for 48 h, followed by paraffin embedding. Next, 8-µm-thick sections were subjected to xylene-mediated deparaffinization and rehydration in graded ethanol. The tissue architecture was visualized through Mayer’s hematoxylin (6 min)/eosin Y (90 s) staining, with optical microscopy (Nikon Eclipse Ci-L) imaging at 40–400× magnification for cortical–medullary demarcation analysis.
Flow cytometric analysis
Flow cytometry was performed using a BD Biosciences FACS analyzer. The data were analyzed with FlowJo software (v10.8), and the gating strategies are detailed in Supplementary Fig. 3.
Sample preparation
Peripheral blood was collected in heparinized tubes, lysed with ACK buffer (Gibco, Cat# A1049201), and washed with PBS. Brain tissue: Ipsilateral hemispheres were digested with 0.25% trypsin-EDTA (37 °C, 25 min) and filtered through 70-µm strainers. Thymic epithelial cells were mechanically dissociated, digested with collagenase (37 °C, 30 min), and filtered through 70-µm strainers. Thymus/spleen immune cells: Mechanically homogenized and filtered through 70-µm strainers.
Staining protocol
Single-cell suspensions were fixed/permeabilized via the Intracellular Fixation & Permeabilization Buffer Set (Invitrogen, Cat# 00−5123-43, 00–5223-56). The following antibodies were used: PerCP-anti-mouse CD45 (1:400; Biolegend 103132, clone 30-F11), FITC-anti-mouse CD3 (1:400; Biolegend 100204, clone 17A2), PE-anti-mouse CD19 (1:400; Biolegend 152408, clone 1D3), PE/Cy7-anti-CD11b (1:400; Biolegend 101216, clone M1/70), BV421-anti-F4/80 (1:400; Biolegend 123132, clone 8M8), APC/Cy7-anti-Ly6G (1:400; Biolegend 108424, clone RB8-8C5), FITC-anti-Ki67 (1:200; BD 556026, clone B56), APC-anti-EPCAM (1:400; Biolegend 118213, clone G8.8), PE/Cy7-anti-Ly51 (1:400; Biolegend 108313, clone M5/114.15.2), anti-AIRE (1:400; Abcam ab243169, clone 5H12), and APC-anti-MHCⅡ(1:400; Biolegend 107607), FITC-anti-CD90 (1:400; Biolegend 328108, clone 5E10), APC-anti-CD34 (1:400; Biolegend 343509, clone 581), PE-anti-CD73 (1:400; Biolegend 344003, clone AD2), PE-anti-CD105 (1:400; Biolegend 120414, clone MJ7/18), APC-anti-mouse IL-2 (Biolegend, 503809), PE/Cyanine7-anti-mouse IFN-γ (Biolegend, 505825), APC/Cy7-streptavidin (Biolegend 405208), Ulex europaeus agglutinin-1 (UEA-1; Vector Labs B-1065).
Immunofluorescence staining
For in vivo experiments, the mice were euthanized at 7 or 14 days post-tMCAO and transcardially perfused with 10 mL of PBS followed by 10 mL of 4% paraformaldehyde (PFA, pH 7.4). The brains were sectioned coronally (25 μm thick), while the thymus tissues were embedded in optimal cutting temperature (OCT) compound and cryosectioned at 5 μm. In vitro experiments, TECs or BM-MSC were seeded on poly-L-lysine (Sigma, Cat# P2636)-coated coverslips. The cells were fixed with 4% PFA for 20 min at room temperature. Sections or fixed cells were permeabilized/blocked with PBS containing 0.03% Triton X-100 and 3% BSA for 1 h at room temperature. The sections were incubated with the following antibodies overnight at 4 °C: rabbit anti-NeuN (1:300; Abcam ab177487), mouse anti-MBP (1:300; Merck Millipore MABT1499), rabbit anti-EPCAM (1:1000; Servicebio GB11274), rabbit anti-CK5 (1:1000; Servicebio GB111246), mouse anti-CK8 (1:1000; Servicebio GB12233), mouse anti-Ki67 (1:500; Abcam ab279653), rabbit anti-P21 (1:500; Affinity Biosciences AF6290), and rabbit anti-Pin1 (1:500; Abcam ab192036). The washed samples were incubated for 1 h at room temperature (light-protected): Cy3-conjugated anti-rabbit (1:1000; Jackson 115–165–003), Alexa Fluor 488-conjugated anti-mouse (1:1000; Jackson 112–545–003), and Alexa Fluor 647-conjugated anti-rabbit (1:1000; Jackson 111–605–003) antibodies. The cell membranes were labeled with wheat germ agglutinin (WGA, 1 µg/mL; Invitrogen W7024).
Lentiviral infection of BM-MSC
TSPAN4 overexpression
To overexpress Tspan4 in BM-MSC, human TSPAN4 cDNA was cloned and inserted into the lentiviral transfer vector TK-PCDH-copGFP-T2A-Puro via NheI/BamHI restriction sites, whose sequence was as follows: gctagcATGGCTAGGGCATGCAGGCTGTCAAGTACCTGATGTTCGCCTTCAACCTGCTCTTCTGGCTGGGCGGATGTGGTGTGCTGGGCGTGGGCATCTGGCTGGCTGCCACCCAGGGCTCTTTCGCCACACTCAGCTCTAGCTTTCCAAGCCTTTCTGCCGCTAACCTGCTGATCATCACTGGTGCTTTCGTGATGGCAATCGGCTTCGTCGGCTGTCTGGGCGCTATCAAAGAGAACAAGTGCCTCTTGCTGACATTCTTTCTCTTGCTGCTGCTGGTGTTTCTGCTGGAGGCTACAATCGCCATCTTGTTCTTCGCCTATACCGACAAGATTGACAGGTACGCACAGCAGGACCTGAAGAAAGGCCTGCATCTGTATGGCACACAGGGTAACGTGGGCTTGACCAACGCCTGGTCTATCATTCAGACAGACTTCAGATGCTGCGGCGTGAGCAACTACACAGACTGGTTTGAGGTCTACAACGCTACCAGAGTGCCTGACAGCTGCTGCTGCTTGGAGTTTAGCGAATCTTGTGGACTGCATGCA.
TSPAN4 knockdown
A Tspan4-targeting shRNA was designed. From the three candidate sequences, the most efficient shRNA target sequence: GATCGTGGATAGCTACGACGTGATTCCTCGAGGAATCACGTCGTAGCTATCCATTTTTT was cloned and inserted into the lentiviral transfer vector pLVX-shRNA2-ZsGreen1-Puro via BamHI/EcoRI.
Pin1 overexpression
To overexpress Pin1 in BM-MSC, human Pin1 cDNA was cloned and inserted into the lentiviral transfer vector pLV-PGK-ZsGreen(GSP2A)PURO-CMV via XhoI-EcoRI restriction sites, whose sequence was as follows: CTCGAGGCCACCATGGCGGACGAGGAGAAGCTGCCGCCCGGCTGGGAGAAGCGCATGAGCCGCAGCTCAGGCCGAGTGTACTACTTCAACCACATCACTAACGCCAGCCAGTGGGAGCGGCCCAGCGGCAACAGCAGCAGTGGTGGCAAAAACGGGCAGGGGGAGCCTGCCAGGGTCCGCTGCTCGCACCTGCTGGTGAAGCACAGCCAGTCACGGCGGCCCTCGTCCTGGCGGCAGGAGAAGATCACCCGGACCAAGGAGGAGGCCCTGGAGCTGATCAACGGCTACATCCAGAAGATCAAGTCGGGAGAGGAGGACTTTGAGTCTCTGGCCTCACAGTTCAGCGACTGCAGCTCAGCCAAGGCCAGGGGAGACCTGGGTGCCTTCAGCAGAGGTCAGATGCAGAAGCCATTTGAAGACGCCTCGTTTGCGCTGCGGACGGGGGAGATGAGCGGGCCCGTGTTCACGGATTCCGGCATCCACATCATCCTCCGCACTGAGTGAGAATTC.
Pin1 knockdown
A Pin1-targeting shRNA was designed. From the four candidate sequences, the most efficient shRNA target sequence: GATCGGCCATTTGAAGACGCCTCGTTCTCGAGAACGAGGCGTCTTCAAATGGCTTTTTT was cloned and inserted into the lentiviral transfer vector pLVX-shRNA2-Puro via BamHI/EcoRI.
Lentivirus production and transduction
The recombinant plasmid was amplified from DH5α E. coli and purified via the NucleoBond Xtra Midi EF Kit (Macherey-Nagel, Cat# 740420). The transfer vector, packaging plasmid pSPAX2 (Addgene #12260), and envelope plasmid pMD2. G (Addgene #12259) were mixed at a 3:2:1 mass ratio in OPTI-MEM (Gibco, Cat# 31985070). PEI MAX transfection reagent (Polysciences, Cat# 23966) was added at a DNA: PEI ratio of 1:1. After 12 h, the medium was replaced with complete DMEM. The viral supernatant was harvested at 48 h post transfection and clarified by centrifugation (800 × g, 10 min). BM-MSC (passage 5) were transduced with viral supernatant (MOI = 20) in the presence of polybrene via centrifugation (1000 × g, 32 °C, 2 h), followed by 48 h of culture in fresh medium. The transduction efficiency was validated via RT‒PCR (primers in Table S1) and Western blotting with anti-rabbit-TSPAN4 (Signalway Antibody, ab109264, 1:1000) and anti-rabbit-Pin1(Abcam, ab192036, 1:1000) antibodies.
Western blot
Protein was extracted with RIPA buffer (Beyotime, Cat# P0013) and centrifuged (12,000 × g, 15 min, 4 °C). The protein concentration was determined via a BCA assay (Beyotime, Cat# P0012), with 40 µg of total protein loaded per lane. The samples were denatured (95 °C, 5 min) and separated on 12% SDS‒PAGE gels (80 V for 30 min, then 120 V for 60 min). Proteins were transferred to PVDF membranes (Merck Millipore, Cat# ISEQ00010) via wet transfer (100 V, 90 min, 4 °C). The membranes were blocked with 5% BSA/TBST for 1 h at RT. The following primary antibodies were used overnight at 4 °C: mouse anti-Ki67 (1:1,000; Abcam ab279653), rabbit anti-NAMPT (1:1,000; Affinity Biosciences DF6059), rabbit anti-P21 (1:1,000; Affinity Biosciences AF6290), rabbit anti-γH2A. X (1:1,000; Affinity Biosciences AF3187), rabbit anti-TSPAN4 (1:1,000; Signalway Antibody ab109264), rabbit anti-Pin1 (Abcam, ab192036, 1:1000), mouse anti-β actin (Servicebio, GB15001, 1:2000) and mouse anti-GAPDH (1:10,000; Proteintech 60004-1-Ig) antibodies. HRP-conjugated anti-mouse/rabbit IgG (1:5,000; Proteintech SA00001-1/SA00001-2) was added for 1 h at RT. The signals were developed with SuperSignal™ West Pico substrate (Thermo Fisher, 34580) and quantified via Image Lab 6.1 (Bio-Rad).
Real-time polymerase chain reaction (RT‒PCR) and TREC analysis
Total RNA was isolated via the EScience RNA Extraction Kit (Cat# RN001) according to the manufacturer’s instructions. The RNA purity was verified via a Nanodrop (A260/A280 = 1.8–2.2). One microgram of RNA was reverse transcribed in a 20 µL volume via the EScience Fast Reverse Transcription Kit (Cat# RT001), which contained 1 µL of cDNA, SYBR Green qPCR mix (Dongsheng Biotech, Cat# P2092a), and gene-specific primers (sequences in Supplementary Table S1) in a final volume of 20 µL. Amplification was performed on a QuantStudio 5 Real-Time PCR System (Applied Biosystems) under the following conditions: 95 °C for 30 s (initial denaturation); 40 cycles of 95 °C for 5 s (denaturation) and 60 °C for 34 s (annealing/extension); and melt curve analysis at 95 °C for 15 s, 60 °C for 60 s, and 95 °C for 15 s. The ΔΔCt method was employed with GAPDH as the endogenous reference, with the data normalized to the means of the control groups. For TREC quantification, genomic DNA was isolated from peripheral blood. TREC signal joints were quantified by qPCR using primers specific for the δRec-ψJα recombination event in C57BL/6J mice, with amplification of the T-cell receptor alpha constant region (TRAC) used the endogenous normalization standard (sequences in Supplementary Table S1). The ΔΔCt method was employed with TRAC as the endogenous reference, with the data normalized to the means of the control groups.
Negative staining transmission electron microscopy (TEM)
Thymus samples were fixed in 4% paraformaldehyde (PBS, pH 7.4) for 48 h, followed by paraffin embedding. Next, 8-µm-thick sections were subjected to xylene-mediated deparaffinization and rehydration in graded ethanol. The tissue architecture was visualized through Mayer’s hematoxylin (6 min)/eosin Y (90 s) staining, with optical microscopy (Nikon Eclipse Ci-L) imaging at 40–400× magnification for cortical–medullary demarcation analysis.
Enzyme-linked immunosorbent assay (ELISA)
Plasma was isolated from peripheral blood by centrifugation (15,000 × g, 15 min, 4 °C) and stored at −80 °C until analysis. Plasma levels of LBP, LPS, CRP, thymosin α1 (Tα1), thymosin β4 (Tβ4), and thymosin β10 (Tβ10) were measured via the following ELISA kits according to the manufacturers’ protocols: a mouse LBP ELISA Kit (MEIMIAN, Cat# MM-44515M1), a mouse LPS ELISA Kit (MEIMIAN, Cat# MM-0634M1), a mouse CRP ELISA Kit (MEIMIAN, Cat# MM-0074M1), a mouse Tα1 ELISA Kit (MEIMIAN, Cat# MM-44450M1), a mouse Tβ4 ELISA Kit (MEIMIAN, Cat# MM-64220H1), and a mouse Tβ10 ELISA Kit (MEIMIAN, Cat# MM-64224H1).
Statistical analysis
All the results are presented as the standard deviations (SDs). Prior to inferential testing, all datasets underwent dual diagnostic verification: normality assessment with the Shapiro-Wilk test (significance threshold α = 0.05) and homoscedasticity evaluation with Levene’s test (threshold P > 0.10 for variance homogeneity). Parametric tests (independent Student’s t-tests or one-way ANOVA) were applied strictly when both assumptions were satisfied. For data violating parametric assumptions (non-normality or heteroscedasticity), Wilcoxon rank-sum tests were systematically implemented for median comparisons between independent samples based on rank-transformed data. All post hoc pairwise comparisons following ANOVA were subjected to Benjamini-Hochberg false discovery rate (FDR) correction. To ensure unambiguous interpretation of FDR-adjusted q-values distinct from conventional p-values, a dedicated annotation system was adopted: #q < 0.05, ##q < 0.01, ###q < 0.001 (replacing asterisk-based notation). All the statistical tests were two-sided, with α = 0.05 defining significance. Analyses were performed via SPSS Statistics 25.0 package (Nonparametric Tests module v3.1).