Study design and patient population
This retrospective cohort study reviewed the medical records of patients diagnosed with LD-SCLC who underwent CCRT between September 2010 and January 2022 at Chung-Ang University Hospital. The inclusion criteria were as follows: pathologically confirmed SCLC, administration of standard etoposide/cisplatin (EP) based CCRT, mediastinum included in radiation field, and availability of enhanced abdominopelvic CT images obtained less than two weeks before CCRT initiation and less than four weeks after treatment completion. Although post-treatment CT scans were intended to be performed within four weeks after CCRT completion, the actual timing varied in clinical practice. In our cohort, the mean interval between treatment completion and post-treatment CT was 2.5 months, with a median of 2.0 months (range, 0–9.0 months). All patients underwent thoraco-abdominal-pelvic CT, brain magnetic resonance imaging, and positron emission tomography-CT at baseline, and staging was reassessed according to the American Joint Committee on Cancer (AJCC) 8th edition TNM classification to confirm limited-stage disease. Bone marrow biopsy was not routinely performed. The exclusion criteria were as follows: lack of baseline or post-treatment imaging, administration of non-standard treatment regimens, or lost to follow-up within three months of treatment initiation. This study was approved by the Institutional Review Board of the Chung-Ang University Hospital (No. 2207-009-19426), which waived the requirement for informed consent due to the retrospective nature of the study.
Assessment of body composition
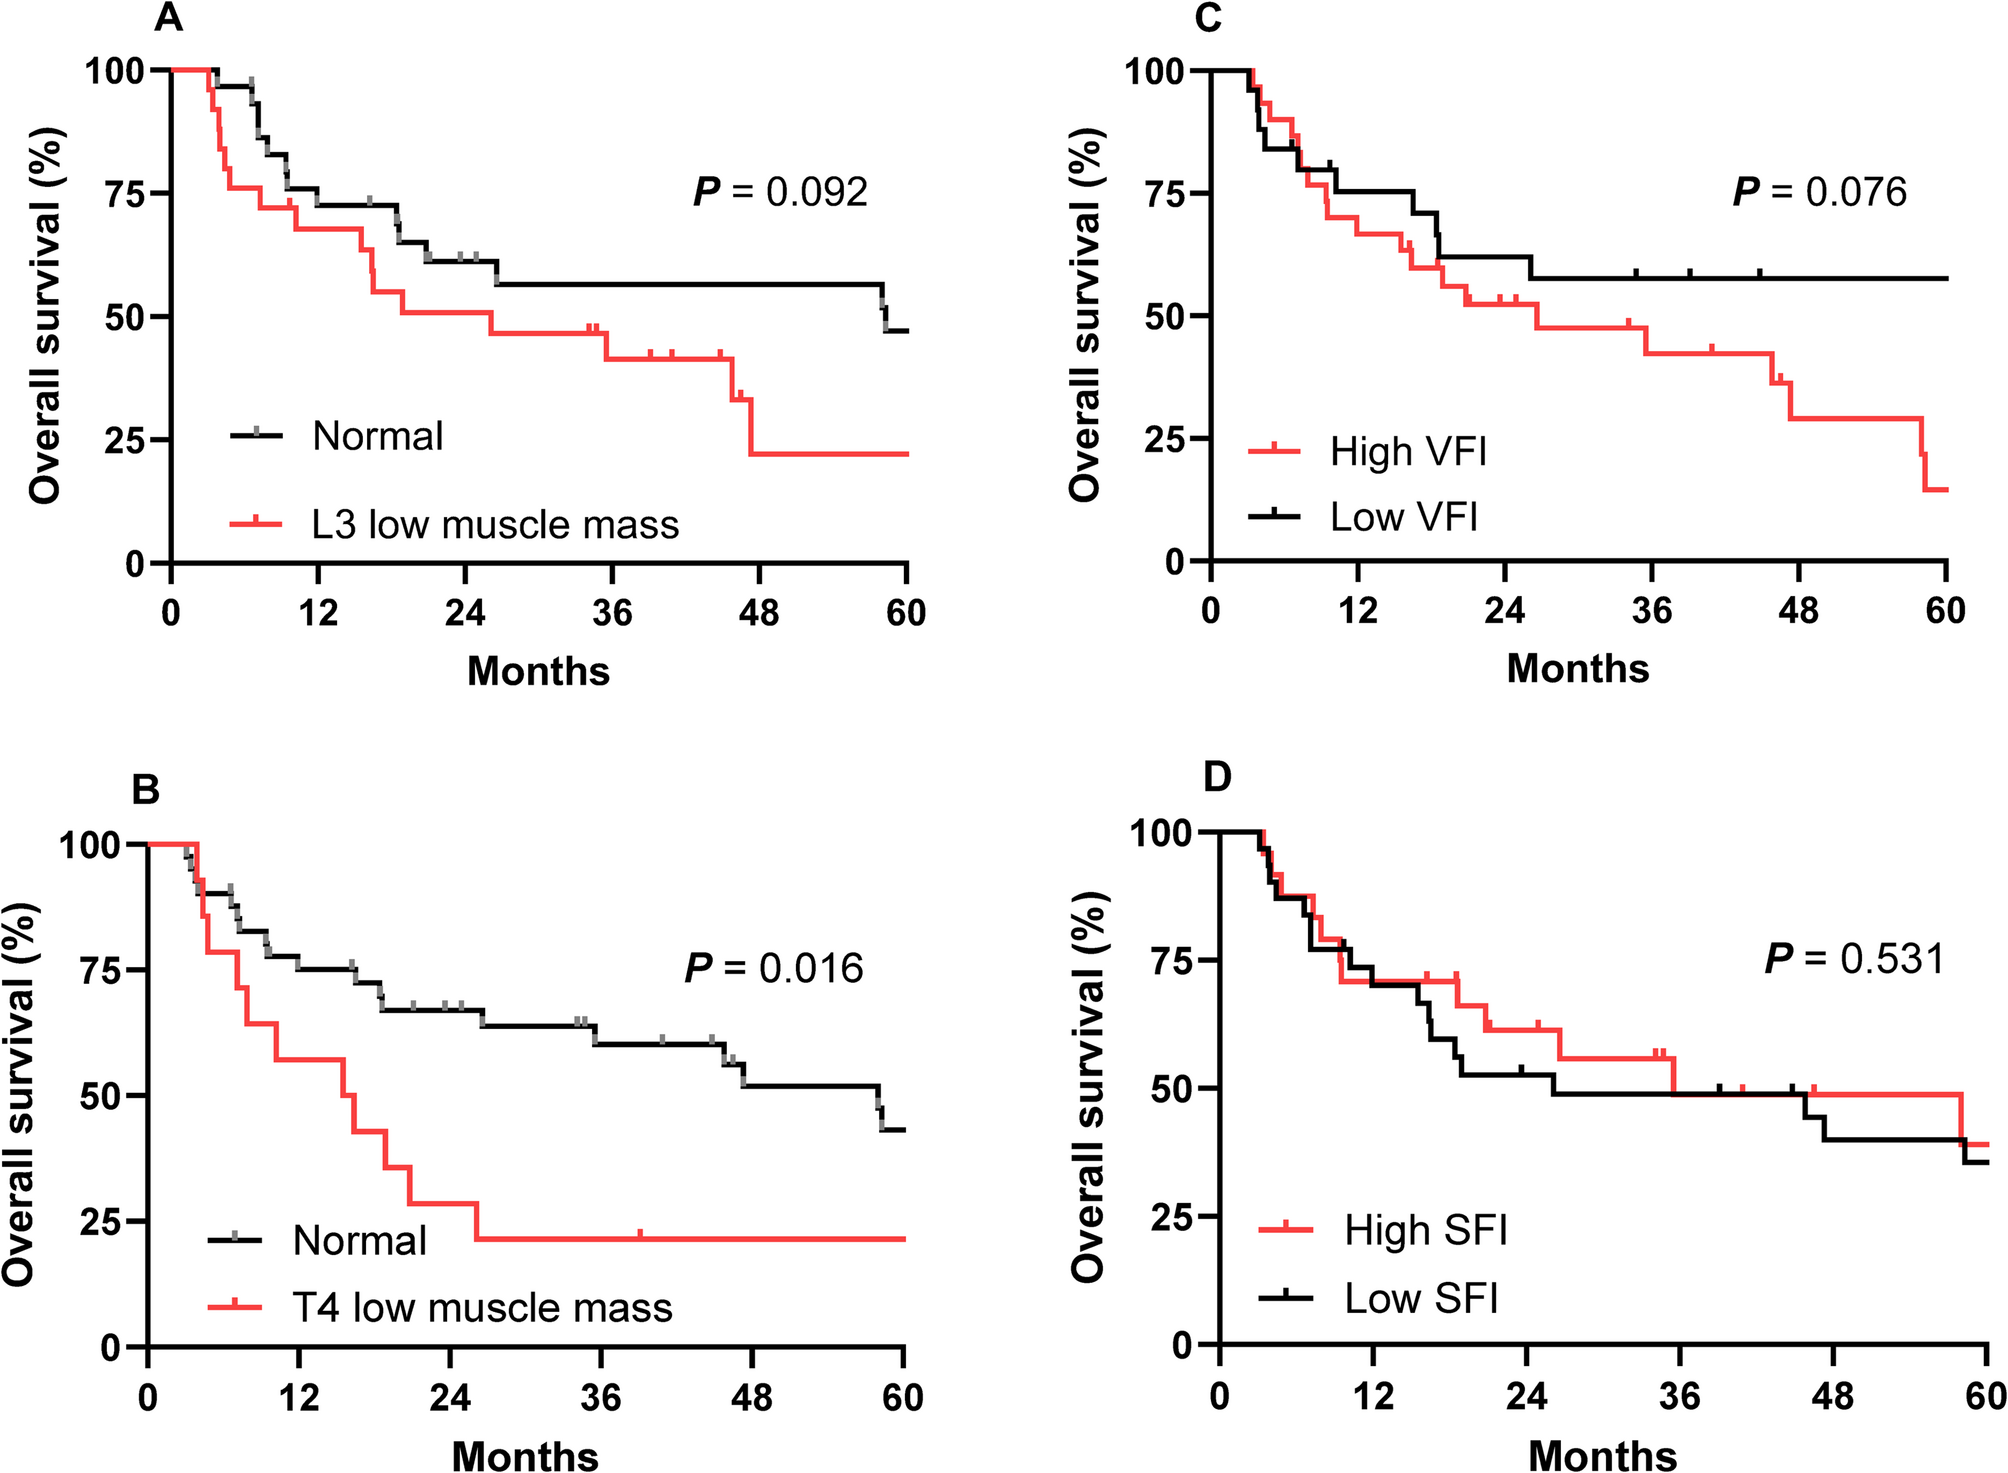
All abdominopelvic and thoracic CT scans used for body composition analysis were obtained with a standardized tube voltage of 120 kV, which is the institutional protocol at Chung-Ang University Hospital for both diagnostic and treatment-planning CT examinations. Body composition was assessed using CT at baseline, defined as within two weeks prior to CCRT initiation, and at post-treatment, defined as within four weeks after CCRT completion. Body composition analysis was performed using TeraRecon Aquarius iNtuition software (TeraRecon, Durham, NC, USA) to measure the skeletal muscle area (SMA), visceral fat area (VFA), and subcutaneous fat area (SCFA). These areas were automatically calculated from single axial CT slices at the third lumbar vertebra (L3) and fourth thoracic vertebra (T4), with both transverse processes visible. Areas were quantified based on predefined Hounsfield unit (HU) thresholds: SMA, −29 to + 150 HU; VFA, −150 to −50 HU; and SCFA, −190 to −30 HU [7]. In addition to absolute cross-sectional areas, the visceral fat area index (VFI) and subcutaneous fat area index (SFI) were calculated by normalizing VFA and SCFA to patient height squared (m²). The L3 SMI, which has been shown to correlate well with total body skeletal muscle mass, was calculated as the L3 SMA (cm2) divided by the square of the patient’s height (m2). L3 low muscle mass was defined as an L3 SMI < 49 cm2/m2 for men and < 31 cm2/m2 for women, according to criteria specific for Korean populations [8]. Patients were classified as having a high or low VFI and SFI using the mean baseline values as thresholds.
The cross-sectional areas of the thoracic skeletal muscles, including the pectoralis, intercostalis, paraspinal, serratus, and latissimus muscles were measured at the T4 level as described previously [9]. The T4 SMI was calculated by dividing the thoracic SMA (cm2) by the square of the patient’s height (m2). There is no established T4 SMI cutoff point for defining T4 low muscle mass; therefore, we divided the patients into quartiles according to the T4 SMI, and the lowest quartile was defined as the low muscle mass group, as described previously [9].
Body weight and height information were extracted from patient medical records. Body mass index (BMI) was calculated as weight divided by height squared (kg/m2), and patients were classified as underweight (< 20.0 kg/m2), normal (20.0–25.0 kg/m2), or overweight (>25.0 kg/m2). Body weight was measured within two weeks of the corresponding CT scan. Although the WHO classification defines underweight as a BMI < 18.5 kg/m², we applied a cutoff of 20 kg/m² based on prior studies in Asian and cancer populations, where this threshold has been associated with malnutrition, reduced treatment tolerance, and poor prognosis [10, 11].
Chemotherapy regimen
All patients received a standard EP regimen concurrently with thoracic radiotherapy. Cisplatin was administered at a dose of 25 mg/m²/day on days 1–3, and etoposide at 100 mg/m²/day on days 1–3, every 21 days. A total of four cycles were planned, and patients who tolerated treatment generally completed all four cycles. The treatment completion rate for concurrent chemoradiotherapy was 92.7% (51/55 patients); four patients discontinued chemotherapy early due to hematologic or non-hematologic toxicities but still completed radiotherapy.
Radiotherapy
All patients received definitive thoracic radiotherapy using either three-dimensional conformal radiotherapy or intensity-modulated radiotherapy. The total prescribed dose was 60 Gy, delivered in 30 fractions (2.0 Gy per fraction), once daily, five days per week. The mediastinum was included in the radiation field in all cases. All patients have completed scheduled thoracic radiotherapy. Prophylactic cranial irradiation was administered at the discretion of the treating physician after completion of CCRT.
Endpoints and clinical variables
The primary endpoints were the changes in body composition indices, including the T4 SMI and L3 SMI, VFI, and SFI from baseline to post-treatment, and the incidence of significant muscle loss. Secondary endpoints included changes in BMI and body weight, overall survival (OS), treatment response rate, and the association between skeletal muscle loss and prognosis. Tumor response was evaluated by applying the RECIST guidelines version 1.1 to CT scans acquired every six to eight weeks. Additional clinical and laboratory data included age, sex, Eastern Cooperative Oncology Group (ECOG) performance status scales, AJCC 8th edition stage group, chemotherapy regimen, serum albumin level, and survival status.
Statistical analysis
Data are presented as median (range), mean ± standard deviation, or number (percentage). Continuous variables were tested for normality using the Kolmogorov–Smirnov test. Paired t-tests or Wilcoxon signed-rank tests were used to compare baseline and post-treatment body composition parameters. Between-group differences were assessed using the Student’s t-test or Mann–Whitney U test for continuous variables and the chi-squared test or Fisher’s exact test for categorical variables. OS was defined as the time from the start of chemotherapy to the date of death from any cause and was estimated using the Kaplan–Meier method. Group comparisons of OS were performed using log-rank tests. Hazard ratios (HRs) and 95% confidence intervals (CIs) were calculated using the Cox proportional hazards model. Variables with P < 0.10 in univariate analysis were entered into multivariate analysis. All statistical analyses were performed using SPSS software version 25.0 (IBM Corp., Armonk, NY, USA); a two-tailed P-value < 0.05 was considered statistically significant.