Subjects
In total, 25 patients with SLE who fulfilled the 1997 revised criteria of the American College of Rheumatology [17] and the 2012 Systemic Lupus International Collaborating Clinics classification criteria [18] were included. Among them, five had NTS bacteremia. Twenty healthy volunteers without rheumatic disease served as non-SLE controls, and an additional five non-SLE patients with NTS bacteremia were enrolled. The demographic and clinical characteristics of patients with SLE and control subjects are summarized in Table 1. Sex was not considered a biological variable. The Institutional Review Board of Taichung Veterans General Hospital approved this study (CF21176A), and written informed consent was obtained from all participants in accordance with the Declaration of Helsinki.
Human PBMC isolation
PBMCs were isolated immediately after venous blood collection using Ficoll-Paque PLUS (GE Healthcare Biosciences AB, Sweden) density gradient centrifugation.
Salmonella infection
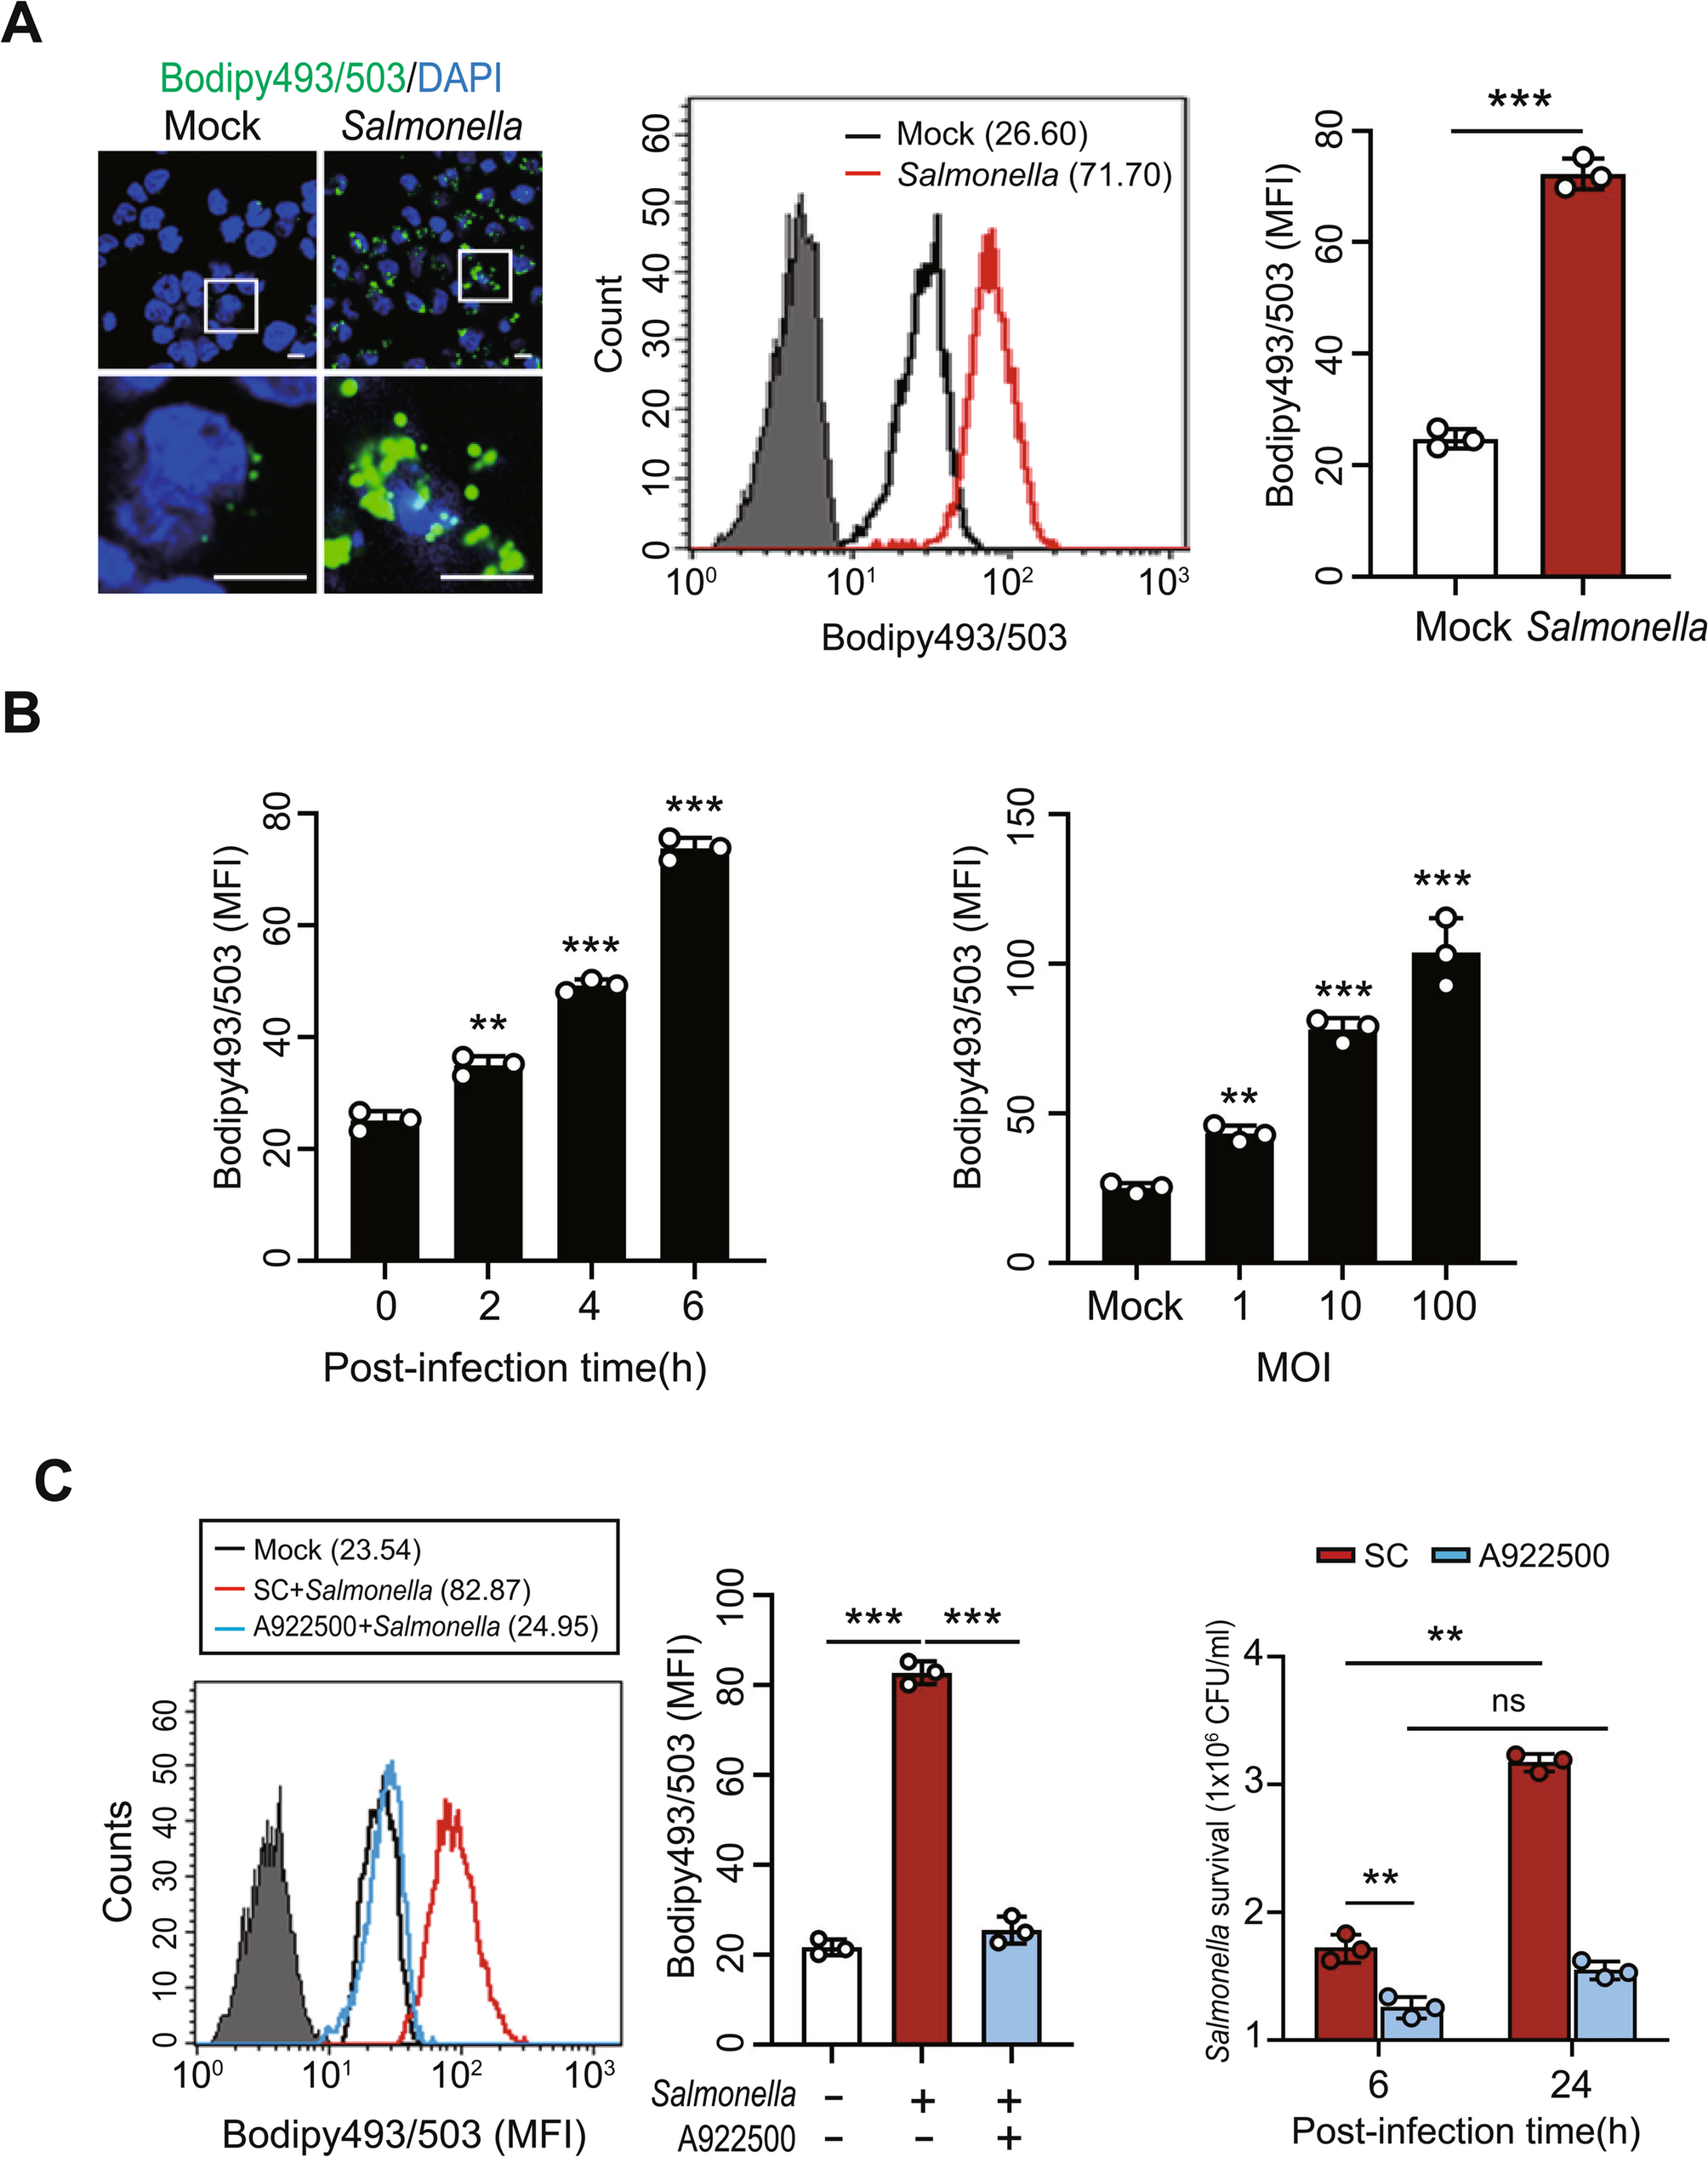
Salmonella enterica serovar Typhimurium strain ATCC14028 was cultured on LB agar plates at 37 °C in an incubator with 5% CO₂. Human PBMCs were infected with strain ATCC14028 at a multiplicity of infection (MOI) of 10. At 3 h post-infection, the cells were incubated with medium containing 50 µg/mL gentamicin for 1 h to eliminate extracellular bacteria, washed three times with phosphate-buffered saline (PBS), and then maintained in antibiotic-free medium. Bacterial growth was assessed by colony-forming unit (CFU) assays. At the indicated time points post-infection, cells were lysed in sterile PBS containing 0.1% Triton X-100 to release intracellular bacteria. The lysates were serially diluted, plated on LB agar plates, and incubated at 37 °C for 18–24 h to determine CFU counts.
EV isolation
Samples were centrifuged at 350 × g for 10 min at 4 °C to remove cell debris. For EV characterization and functional assays, 2.5 mL of each sample was diluted with 7.5 mL of PBS and concentrated using Amicon Ultra-0.5 centrifugal filter units (Millipore, 100 K cutoff) at 3000 × g for 30 min at 4 °C. The retentate (100 µL) was diluted with 1.4 mL of PBS and centrifuged at 10,000 × g for 30 min at 4 °C. The resulting pellets were resuspended in 1.5 mL of PBS and ultracentrifuged at 120,000 × g for 90 min at 4 °C. Finally, the pellets were resuspended in 50 µL of PBS and stored at − 80 °C [16].
IC isolation
ICs were isolated from the sera of patients with clinically active SLE, defined as those with an SLE Disease Activity Index of >6, by polyethylene glycol (PEG) precipitation as previously described [19]. Briefly, serum samples were mixed with an equal volume of ice-cold 6% (wt/vol) PEG 6000 (Sigma-Aldrich, USA) to achieve a final concentration of 3%, incubated for 60 min at 4 °C, and centrifuged at 2,000 × g for 20 min. The resulting precipitates were washed three times with sterile PBS and resuspended to the original serum volume in PBS. Anti-DNA enzyme-linked immunosorbent assay (ELISA) (CUSABIO, USA) was performed on both the PEG pellets and corresponding supernatants to confirm that the precipitated material contained DNA-binding ICs. More than 75% of total anti-DNA reactivity was recovered in the PEG pellet fraction of SLE sera, whereas pellets from healthy controls showed undetectable signal. The concentrations of PEG-precipitated ICs were determined using a circulating IC C1q ELISA (BioVendor, Czech Republic) and expressed as aggregated human IgG equivalents (µg Eq/mL).
ICs from three different patients with active SLE were quantified and diluted in PBS to a final concentration of 50 µg Eq/mL. For stimulation assays, 40 µL of the IC suspension was added to PBMC cultures and incubated for 24 h, unless otherwise indicated. Each experiment used ICs derived from one patient with SLE and was performed in triplicate; the full set of experiments was independently repeated with ICs from three different patients to confirm reproducibility and minimize donor-specific bias.
IC-primed pEV Preparation
Human platelets were isolated from peripheral blood by centrifugation at 230 × g for 15 min at 25 °C, followed by centrifugation at 1,000 × g for 10 min. The platelet pellets were resuspended in Tyrode’s buffer (Sigma-Aldrich, USA) containing one-sixth volume of acid citrate dextrose (Sigma-Aldrich, USA) and 1 µM prostaglandin I₂ (Sigma-Aldrich, USA), then centrifuged again at 1,000 × g for 10 min at 25 °C. The pellets were resuspended in Tyrode’s buffer containing 1 µM prostaglandin I₂ and 0.04 U/mL apyrase (Sigma-Aldrich, USA) and gently agitated on a shaker. Before stimulation, the platelets (4 × 10⁷ per tube) were washed once by centrifugation at 1,000 × g for 10 min and resuspended in fresh Tyrode’s buffer. SLE ICs (2 µg aggregated human IgG equivalents) were added to the platelet suspension and incubated for 2 h at 37 °C. The supernatants were then collected and sequentially centrifuged at 2,000 × g for 20 min, 10,000 × g for 30 min, and 100,000 × g for 70 min to isolate pEVs. The resulting pellets were washed in PBS and resuspended in 40 µL of sterile PBS for subsequent assays. The pEVs were quantified by nanoparticle tracking analysis and characterized by immunoblotting for CD41, CD63, CD9, and CD81. For stimulation experiments, approximately 1 × 10⁸ pEV particles were added to 2 × 10⁶ PBMCs and incubated for 24 h, unless otherwise indicated.
Transient transfection
Human PBMCs (1 × 10⁶ cells) were transiently transfected with 30 nM Toll-like receptor (TLR)7/8 siRNA (Dharmacon, Horizon, USA) or control siRNA using Lipofectamine RNAiMAX Transfection Reagent (Thermo Fisher Scientific, USA) according to the manufacturer’s instructions and incubated at 37 °C for 24 h. Knockdown efficiency of TLR7/8 was confirmed by immunoblotting.
Quantitative polymerase chain reaction (PCR) for TsRNAs
tsRNAs were extracted from PBMCs using the rtStar tRF&tiRNA Pretreatment Kit (Arraystar, USA) to remove RNA modifications. Twenty-five femtomoles of synthetic Caenorhabditis elegans miRNA (cel-miR-39; Thermo Fisher Scientific, USA) were added to each sample as an internal control. For cDNA synthesis, 250 ng of total tsRNA was reverse-transcribed using the rtStar cDNA Synthesis Kit (Arraystar, USA). Real-time PCR quantification of specific tsRNAs was performed with the LightCycler 480 SYBR Green I Master (Roche, Germany) and specific primers (Supplementary Table 1) and analyzed on the LightCycler 96 real-time PCR System (Roche, Germany) using the standard thermoprofile recommended by the manufacturer. Relative expression was calculated using the comparative threshold cycle (Ct) method and expressed as 2ΔCt, where ΔCt = [mean of control subjects (CttsRNA − Ctcel−miR−39)] − [patient (CttsRNA − Ctcel−miR−39)].
Immunofluorescence assay
Human PBMCs were fixed with 4% paraformaldehyde (Sigma-Aldrich, USA) for 10 min at room temperature, washed with PBS (Thermo Fisher Scientific, USA), permeabilized in PBS containing 1% bovine serum albumin (Thermo Fisher Scientific, USA) and 0.2% saponin (Sigma-Aldrich, USA), and then blocked in PBS containing 2% bovine serum albumin for 1 h. LDs were stained with 2 µM BODIPY 493/503 (Thermo Fisher Scientific, USA) for 30 min. Coverslips were mounted using SlowFade mounting medium (Thermo Fisher Scientific, USA), and images were acquired with an Olympus FV1000 confocal microscope. Image analysis was performed using FV10-ASW software version 4.2 (Olympus).
Flow cytometry
For LD analysis, PBMCs were stained with 2 µM BODIPY 493/503 (Thermo Fisher Scientific, USA) for 30 min at 37 °C in the dark, washed twice with PBS, and resuspended in PBS for acquisition. LD content was quantified by the mean fluorescence intensity (MFI) of the BODIPY 493/503 signal in the FITC channel. The gating strategy included: (i) exclusion of debris based on forward scatter (FSC) and side scatter (SSC) profiles, (ii) elimination of doublets using FSC-A versus FSC-H plots, and (iii) selection of viable PBMCs for analysis of BODIPY 493/503 fluorescence. Samples were acquired on a FACSCanto II flow cytometer (BD Biosciences, USA), and data were analyzed using CellQuest (version 6.0, BD Biosciences) or FlowJo (version 10.10.0, BD Biosciences).
Immunoblotting
Cells were lysed in RIPA lysis and extraction buffer (Thermo Fisher Scientific, USA) supplemented with protease inhibitors (Roche, Germany). Equal amounts (40 µg) of total protein were separated by SDS–polyacrylamide gel electrophoresis, transferred to polyvinylidene fluoride membranes (Millipore, USA), and incubated with primary antibodies followed by horseradish peroxidase–conjugated secondary antibodies (listed in Supplementary Materials). Signals were detected using enhanced chemiluminescence (Millipore, USA) and visualized with a CCD imaging system (GE Healthcare, USA). Band intensities were quantified using ImageJ software, with β-actin (Santa Cruz Biotechnology, USA) serving as the loading control. All experiments were performed in triplicate. Data are presented as mean ± standard deviation (SD). Statistical comparisons were made using a two-tailed unpaired Student’s t-test (GraphPad Prism version 8). Densitometric quantification is provided in Supplementary File 2.
RNA-seq analysis
Total RNA (1 µg) from neutrophils was used for library preparation with the TruSeq Stranded mRNA Library Prep Kit (Illumina, RS-122–2001/2002) according to the manufacturer’s protocol. mRNA was enriched using oligo(dT) beads, fragmented, and reverse-transcribed into cDNA. After adaptor ligation and PCR amplification, libraries were purified with the AMPure XP system (Beckman Coulter, USA), quality-checked with the Qsep400 System (Bioptic Inc., Taiwan), and quantified using a Qubit 2.0 Fluorometer (Thermo Fisher Scientific, USA). Paired-end sequencing (150 bp) was performed on an Illumina NovaSeq platform. Raw reads were quality-checked with FastQC and trimmed using Trimmomatic. Clean reads were aligned to the human reference genome (GRCh38) using HISAT2, and gene counts were generated with featureCounts. Differential gene expression analysis was performed with DESeq2, and significantly altered genes were defined as those with an adjusted P value < 0.05 and |log₂ fold change| ≥ 1.
RNA-protein pull-down assay
A single biotinylated nucleotide was attached to the 3′ terminus of the tRF-His-GTG-1 mimic or control using the Pierce RNA 3′ End Desthiobiotinylation Kit (Thermo Fisher Scientific, USA) according to the manufacturer’s instructions. Human neutrophils (2 × 10⁶ cells) were transiently transfected with 30 nM biotin-labeled tRF-His-GTG-1 mimic or control using Lipofectamine RNAiMAX Transfection Reagent (Thermo Fisher Scientific, USA) and incubated for 24 h at 37 °C. After incubation, cells were washed with PBS and lysed with lysis buffer. Following centrifugation at 12,000 × g for 15 min at 4 °C, the supernatant was collected and quantified for protein concentration. RNA-binding proteins associated with the tRF-His-GTG-1 mimic were isolated using the Pierce Magnetic RNA–Protein Pull-Down Kit (Thermo Fisher Scientific, USA) according to the manufacturer’s instructions. The immunoprecipitated proteins were analyzed by immunoblotting with the indicated antibodies.
Statistics
Results are presented as mean ± SD. Unpaired two-tailed Student’s t-tests and Mann–Whitney U tests were used for between-group comparisons. One-way analysis of variance with Bonferroni post hoc correction was applied for multiple comparisons. Correlations were assessed using Spearman’s correlation coefficient. P values of < 0.05 were considered statistically significant. All statistical analyses were performed using GraphPad Prism version 8.