Viability of M. mulieris in culture
We tracked the viability of M. mulieris cells from the sample preparation steps up to 24 h after incubation in a CO2 incubator, as this is critical to interpret the impact of M. mulieris cell exposure. The viability of M. mulieris was maintained during the sample preparation (1.5 × 10⁸ CFU/mL at T2, 1.1 × 10⁸ CFU/mL at T3) compared to the original bacterial culture (1.9 × 10⁸ CFU/mL at T1; Supplementary Fig. 1). However, 24 h of incubation in a CO2 incubator led to a 100-fold reduction in the viable CFU count (9.7 × 10⁵ CFU/mL, T4).
M. mulieris live bacteria, BFS, and bEVs significantly altered gene expression in cervicovaginal epithelial cells
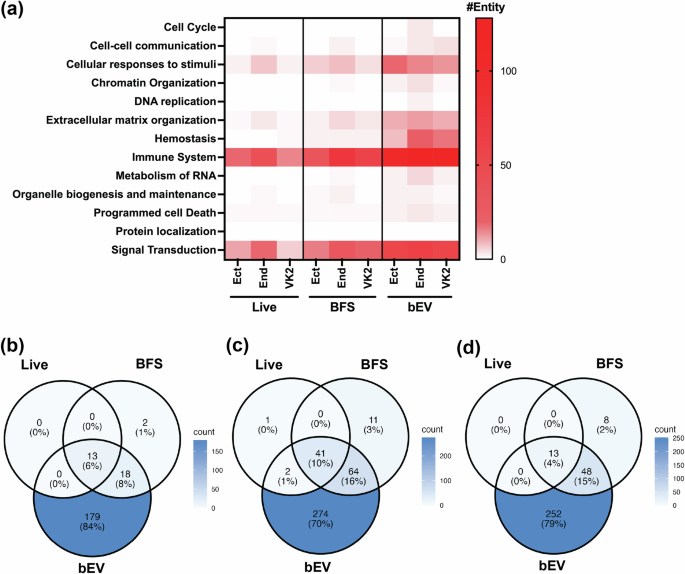
Exposure to live M. mulieris, their BFS, or bEV resulted in significant changes in gene expression in Ect, End, and VK2 epithelial cells (Supplementary Data 1–9). Among these, bEV exposure induced the highest number of differentially expressed genes (DEGs) (Live: 13, 44, 13; BFS: 33, 116, 69; bEV: 210, 381, 313 in Ect, End, VK2, respectively; Table 1). Most DEGs were upregulated, with pathway over-representation analysis revealing broader pathway alterations in bEV-exposed cells compared to exposure to live M. mulieris cells or their BFS (Fig. 1a, Supplementary Fig. 2). Common DEGs across all exposures (13, 41, and 13 common DEGs from Ect, End, and VK2; Fig. 1b–d, Supplementary Data 10) were SAA1, BIRC3, CXCL10, MMP9, and TNFAIP3. bEV exposure uniquely altered 179, 274, and 252 DEGs in Ect, End, and VK2 cells, respectively, with a significant enrichment in immune system-related pathways: Cytokine Signaling in Immune System, Signaling by Interleukins, and Interferon alpha/beta Signaling (Supplementary Data 11).
a Heatmap showing the number of entities associated with each main pathway category in the network view of the pathway over-representation analysis. Color intensity is proportional to the number of entities in each pathway, with darker colors representing higher numbers of entities. Venn diagrams representing the number of DEGs identified in response to three M. mulieris exposure in b Ect, c End, and d VK2 cell lines.
M. mulieris live bacteria, BFS, and bEVs altered more genes in vaginal compared to cervical epithelial cells
Gene set enrichment analysis (GSEA) was first used to understand the impact of M. mulieris on pathways at the highest hierarchical level (Fig. 2a). GSEA revealed that VK2 cells tended to exhibit the highest pathway FCs in response to M. mulieris exposures, with bEV exposure tending to result in the largest FCs compared to exposure to live bacteria and BFS (Fig. 2a). The three pathways with the highest FC with significant p values after M. mulieris bEV exposure (Supplementary Data 12) were cell-cell communication (overall FC = 1.14), ECM organization (overall FC = 1.13), and immune system (overall FC = 1.12) in VK2 cells.
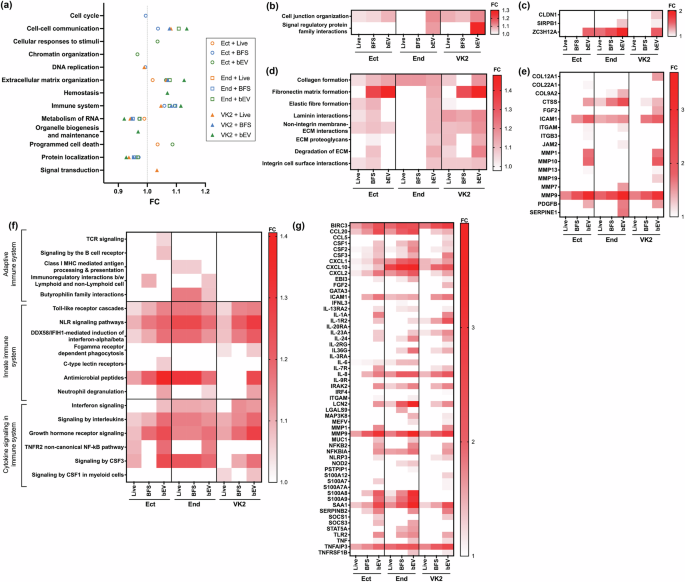
a A summary of the results from GSEA, visualizing the impact of M. mulieris on pathways at the highest hierarchical level. Fold changes (FCs) were calculated by comparing to the control group. Only cell line and exposure sets showing significant alterations are included in the plot. Different shapes represent cell lines (circle for Ect, square for End, and triangle for VK2), and colors represent the three M. mulieris exposures (orange for live, blue for BFS, and green for bEV exposure). b Heatmap showing the sub-pathways under the main pathway “Cell-cell communication” and c the DEGs involved in these sub-pathways. d Heatmap for sub-pathways under “Extracellular matrix organization” and e the DEGs involved in these sub-pathways. f Heatmap for sub-pathways under the “Immune system” and g the DEGs involved in these sub-pathways. For all heatmaps, darker colors indicate higher FC compared to the control group. Annotations representing significant alterations are visualized while non-significant changes are left blank (white) in the plots, and p values from VK2 treated with M. mulieris bEV group are summarized in Supplementary Data 13 (pathways) and Supplementary Data 14 (DEGs).
Under the cell-cell communication pathway, the sub-pathways cell-junction organization (FC = 1.1) and signal regulatory protein family interactions (FC = 1.3) were significantly overexpressed in VK2 cells exposed to M. mulieris bEVs (Fig. 2b; p values are summarized in Supplementary Data 13). Key DEGs involved included CLDN1 (FC = 1.2), SIRPB1 (FC = 1.1), and ZC3H12A (FC = 1.6) (Fig. 2c; p values are summarized in Supplementary Data 14). Under the ECM organization pathway, exposure to live M. mulieris, BFS, and bEV significantly impacted collagen formation, non-integrin membrane ECM interactions, ECM degradation, and integrin cell surface interactions in Ect and VK2 cells (Fig. 2d). In contrast, End cells were predominantly affected by bEV exposure, except for collagen formation, which was altered by all three exposures. Specifically, bEV exposure significantly increased the expression of matrix metalloproteinase (MMP) gene family, including MMP9 (FC = 2.9), MMP1 (FC = 1.7), MMP10 (FC = 2.0), MMP13 (FC = 1.1), and MMP19 (FC = 1.2) in VK2 cells (Fig. 2e). Additionally, gene involved in collagen formation and degradation, such as COL12A1 (FC = 1.5) and CTSS (FC = 1.4), and other ECM-related genes (ICAM1, FC = 1.8; FGF2, FC = 1.4; PDGFB, FC = 1.5) were significantly upregulated in VK2 cells following bEV exposure.
Under the immune system pathway, all three M. mulieris exposures primarily affected innate immune system and cytokine signaling pathways, rather than adaptive immune system pathways, particularly in VK2 cells (Fig. 2f). Among the innate immune system sub-pathways, all exposures significantly elevated TLR cascades, NLR signaling pathways, and DDX58/IFIH1-mediated induction of interferon alpha/beta in all three epithelial cell lines. The antimicrobial peptides pathway was elevated in Ect and End cells.
Among the cytokine signaling sub-pathways, signaling by interleukins and growth hormone receptor signaling were significantly altered by all exposures in the three epithelial cell lines. In contrast, Interferon signaling and CSF3 signaling pathways’ activation were specific to End cells. In VK2 cells, bEV exposure significantly upregulated key DEGs associated with these pathways, including: Innate immune pathways: TLR signaling (TLR2, FC = 1.5), NLR signaling (BIRC3, FC = 2.9; IRAK2, FC = 1.8; MEFV, FC = 1.1; NFKB2, FC = 1.5; NLRP3, FC = 1.3; TNFAIP3, FC = 2.6), DDX58/IFIH1-mediated interferon induction (NFKBIA, FC = 1.6; S100A12, FC = 1.3), and antimicrobial peptides pathway (LCN2, FC = 1.7; S100A7, FC = 1.1); Cytokine signaling and signaling by interleukins pathways: Signaling by interleukins (CCL20, FC = 1.5; CXCL8/IL-8, FC = 2.2; IL-24, FC = 1.5; SAA1, FC = 2.4; SERPINEB2, FC = 1.8; TNF, FC = 1.2); and Growth hormone receptor signaling: SOCS1 (FC = 1.3) (Fig. 2g).
TLR2 signaling mediated an inflammatory response to M. mulieris exposures
Given the diverse immune response elicited by live M. mulieris, its BFS, and bEVs, we sought to assess whether this response was dependent on the activation of TLR212, and/or TLR5 through its flagellin, as would be suggested by the microbial structure8. We used TLR blockades to determine if the induction of select immune mediators (IL-6, IL-8, CCL20), which were found to be upregulated in the RNA-seq analysis (Fig. 2g), was dependent on TLR2 and/or TLR5 activation. Consistent with the RNA-seq analysis findings, live M. mulieris, its BFS, and bEVs all increased the protein levels of the three immune mediators. However, there were differences in the responses by cell type and between the different bacterial exposures.
Exposure to live M. mulieris increased all three immune mediators in End and VK2 cells, with no significant changes observed in Ect cells (Fig. 3a–c). In End cells, TLR2 blockade significantly reduced the M. mulieris-induced immune mediators. Blockade of TLR5 also limited the ability of M. mulieris to induce an immune response, resulting in a significant reduction in IL-6 and IL-8 levels. While live M. mulieris increased IL-6, IL-8, and CCL20 levels in VK2 cells, the immune response was not as robust as observed in Ect or End cells. Only TLR2 blockade reduced IL-8 levels, and it did not affect IL-6 or CCL20 levels induced by live M. mulieris exposure in VK2 cells. Notably, TLR5 blockade did not significantly reduce any immune mediator levels in VK2 cells exposed to live M. mulieris.
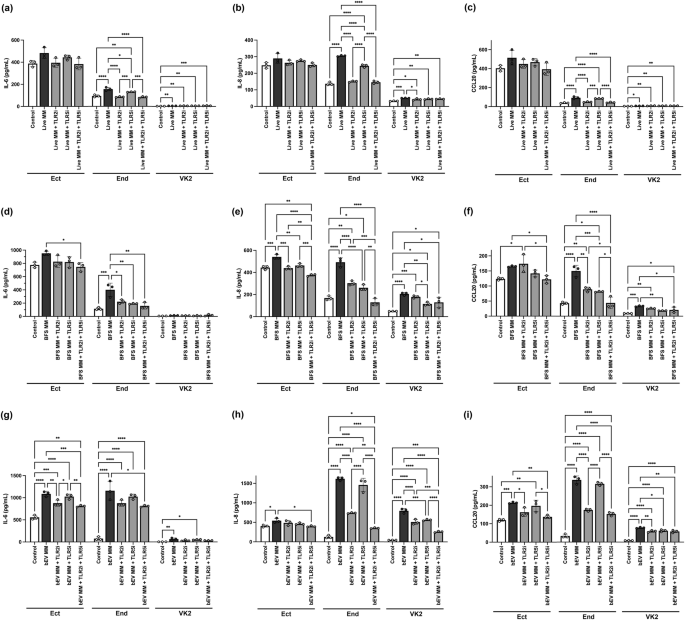
a IL-6, b IL-8, and c CCL20 levels in response to live M. mulieris exposure; d IL-6, e IL-8, and f CCL20 levels in response to BFS M. mulieris exposure; g IL-6, h IL-8, and i CCL20 levels in response to bEV M. mulieris exposure. The inhibitors for hTLR2 and hTLR5 are written as TLR2i and TLR5i. Bar plots represent the mean, the error bars for the standard deviation, and the dots represent the technical replicate (n = 3). One-way ANOVA was used, followed by Tukey’s multiple comparison test, with statistical significance denoted by “*” (p < 0.05), “**” (p < 0.01), “***” (p < 0.001), “****” (p < 0.0001).
M. mulieris BFS significantly increased IL-8 in Ect cells (Fig. 3d), all three mediators in Endo cells (Fig. 3e), and IL-8 and CCL20 in VK2 cells (Fig. 3f). In Ect cells, both TLR2 and TLR5 blockades significantly reduced IL-8 levels. In End cells, both TLR2 and TLR5 blockade reduced all three mediator levels, where statistical significance was observed for the reduction in all three mediators by TLR2 blockade and IL-6 and CCL20 levels by TLR5 blockade. In VK2 cells, the TLR2 blockade did not significantly reduce the levels of the immune mediators, but the TLR5 blockade significantly reduced the IL-8 and CCL20 levels. The combination of TLR2 and TLR5 blockades demonstrated a synergistic effect, reaching statistical significance for IL-8 and CCL20 levels in all cell lines and IL-6 levels in Ect and End cells.
M. mulieris bEVs significantly elevated the three immune mediators across the three cell lines (Fig. 3g–i). TLR2 blockade was sufficient to significantly reduce IL-6 and CCL20 levels in Ect cells, as well as IL-8 and CCL20 levels in End cells, with no significant impact from TLR5 blockade. In VK2 cells, TLR2 blockade significantly reduced IL-8 levels, and both TLR2 and TLR5 blockade significantly reduced CCL20 levels. An additive effect of TLR2 and TLR5 blockades was observed for IL-8 in all three epithelial cell lines.
As a quality control measure, neither TLR2 nor TLR5 blockades affected baseline immune mediators’ expression in any cell line (Supplementary Fig. 3a–c), except for a significant, but minor increase in CCL20 levels in Ect cells following TLR2 blockade compared to the control group, with a mean increase of only 10.5 pg/mL.
MMP9 production is induced by M. mulieris via TLR signaling
A key finding from the RNA-seq analysis was that M. mulieris increased expression of MMP9, a matrix metalloproteinase involved in ECM degradation and previously associated with PTB22. Since RNA-seq data showed that live M. mulieris, its BFS, and bEVs significantly upregulated MMP9 gene expression in all cervicovaginal epithelial cells tested in this study (Fig. 2e), we sought to determine whether any M. mulieris exposures also altered MMP9 protein levels by measuring the total MMP9 (including both active and inactive forms). We found that exposure to live M. mulieris, BFS, and bEV significantly increased MMP9 protein levels in VK2 cell culture supernatant (Fig. 4a–c), while MMP9 levels in Ect and End cells remained below the detection limit. No change in MMP9 production was noted with exposure to L. crispatus, an optimal vaginal bacterium (Supplementary Fig. 4).
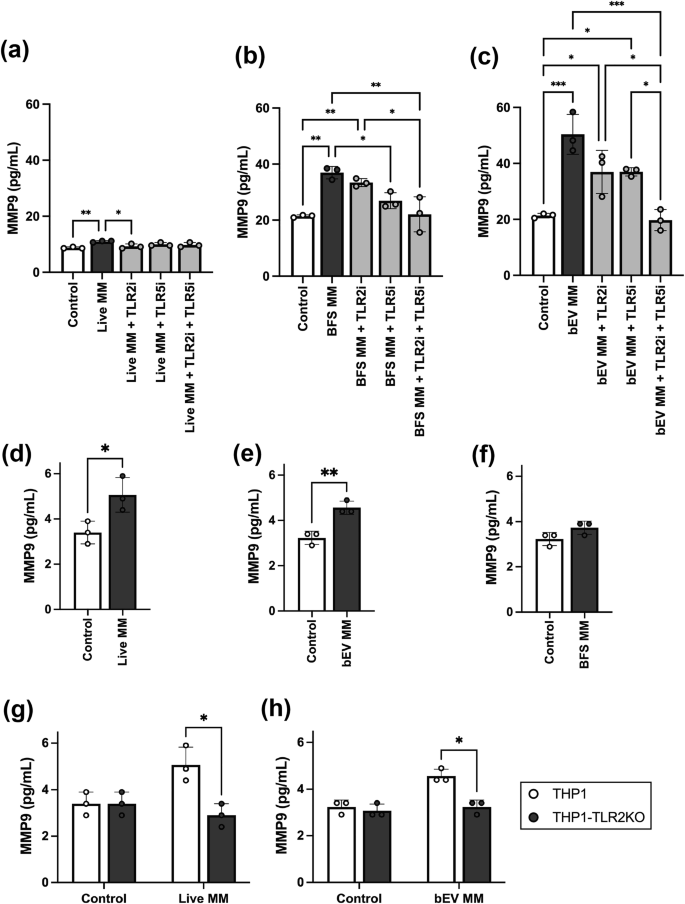
MMP9 protein levels were measured in the culture media of VK2 cells exposed to a live, b BFS, and c bEV M. mulieris exposures, with and without the addition of hTLR2 and/or hTLR5 inhibitors (denoted as TLR2i and TLR5i). One-way ANOVA was used to compare MMP9 concentrations between groups. For statistically significant results (p < 0.05), post-hoc tests were applied. d MMP9 protein levels measured in the culture media of THP1 wild-type cells in response to d live, e bEV, and f BFS M. mulieris exposures. Unpaired t-tests were used to compare MMP9 concentrations between control and M. mulieris exposures. g MMP9 protein levels measured in the culture media of THP1 wild type and THP-TLR2KO exposed to g live and h bEV. mulieris exposures. White bars represent the results from THP1 cells, and black bars represent the results from THP1-TLR2KO cells. Bar plots represent the mean, the error bars for the standard deviation, and the dots represent the technical replicate (n = 3). Two-way ANOVA was applied to assess the impact of TLR2 knockout. The statistical significance was denoted by “*” (p < 0.05), “**” (p < 0.01), and “***” (p < 0.001).
The increase in MMP9 by live M. mulieris was significantly reduced by TLR2 blockade but not by TLR5 blockade (Fig. 4a). In contrast, the increase in MMP9 by M. mulieris BFS was significantly reduced by TLR5 blockade and, to a lesser extent, by TLR2 blockade (Fig. 4b). The combination of TLR2 and TLR5 blockades further decreased the MMP9 levels induced by M. mulieris BFS. The increase in MMP9 by M. mulieris bEVs was only significantly reduced when both TLR2 and TLR5 blockades were combined (Fig. 4c).
As a quality control measure, we confirmed that the addition of TLR2 and/or TLR5 inhibitors did not alter baseline MMP9 protein expression (Supplementary Fig. 3d).
To confirm the role of TLR2 in mediating M. mulieris-induced MMP9 production, we assessed MMP9 levels following exposure to live M. mulieris cells, BFS, and bEV in THP1 wild-type and THP1 TLR2-deficient cells (THP1-TLR2KO). Exposures to both live M. mulieris (Fig. 4d) and bEV M. mulieris (Fig. 4e), but not BFS (Fig. 4f), significantly increased MMP9 production. The absence of TLR2 significantly reduced MMP9 production in response to exposures to live M. mulieris (Fig. 4g) and M. mulieris bEVs (Fig. 4h).
M. mulieris abundance correlates with MMP9 levels in vaginal swabs from pregnant women
We compared MMP9 protein levels in vaginal samples from two groups: 20 pregnant women with a high abundance of L. crispatus and no detectable M. mulieris (high LC group) and 10 pregnant women with low L. crispatus and high M. mulieris abundance (high MM group). As shown in Table 2, there were no significant differences between the groups in race, age, gestational age at sample collection, infant birth weights, or gestational age at delivery between the groups (p > 0.05). The high MM group had significantly higher MMP9 levels than the high LC group (Fig. 5a). However, vaginal MMP9 concentration did not show a direct correlation with M. mulieris abundance (p = 0.38, r = 0.16). Within the high MM group, CST IV-A and CST V subtypes exhibited a trend toward higher MMP9 levels (Fig. 5b).
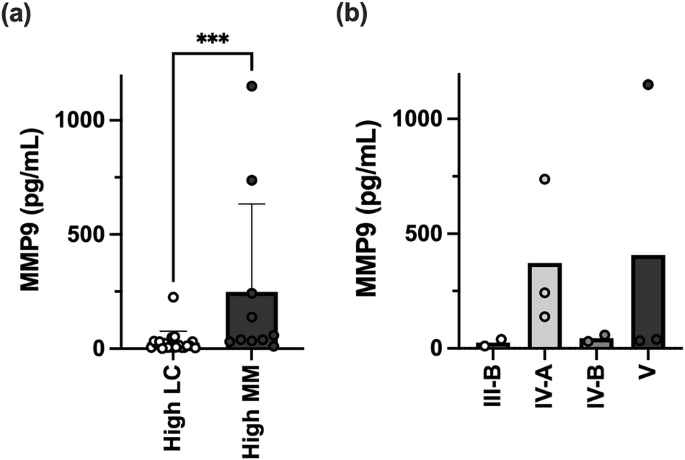
a A bar plot showing the MMP9 concentrations measured in vaginal swab samples from subjects in the high LC and high MM groups. Bar plots represent the mean and the error bars for the standard deviation. The Mann–Whitney test was applied to compare MMP9 levels between the two groups, with statistical significance indicated by “***” (p < 0.001). b Within the high MM group, MMP9 concentrations were visualized by finer CST groupings.