Mojtaba Khamenei, the second son of the assassinated Ali Khamenei, is being heavily tipped to succeed his father as supreme leader of Iran, which would pitch a hardliner into the task of steering the Islamic republic through the most turbulent…
LAHORE, Mar 04 (APP):Punjab Chief Minister Maryam Nawaz Sharif chaired a meeting of the Provincial Apex Committee to review the overall security situation in the province, here on Wednesday.
The meeting expressed gratitude over the success of…
Keir Starmer has told MPs that “hanging on to President Trump’s latest words is not the special relationship” after criticism of his stance on the Iran conflict.
A day after Donald Trump dismissed Starmer as “not Winston Churchill”,…
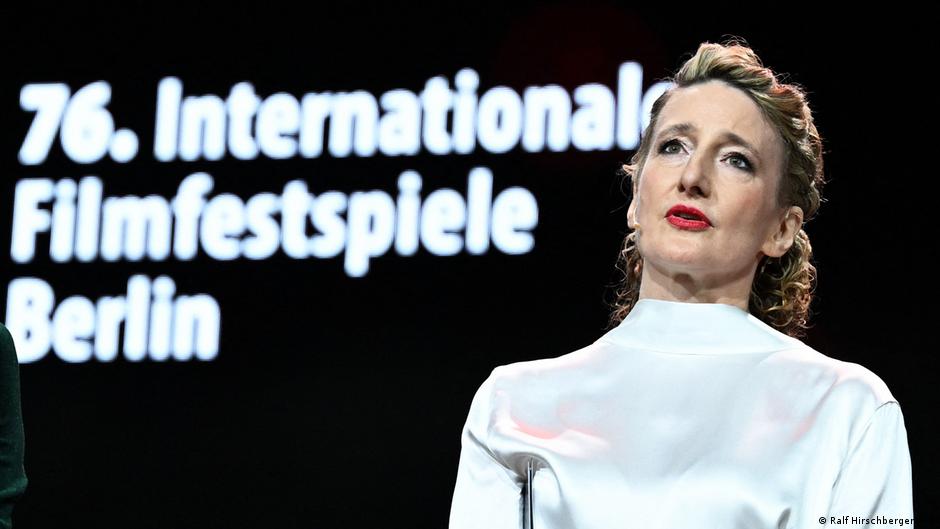
Berlin International Film Festival director Tricia Tuttle will remain head of the Berlinale, but must accept certain guidelines, as reported by German press following a crisis meeting held by the Berlin International Film Festival’s…
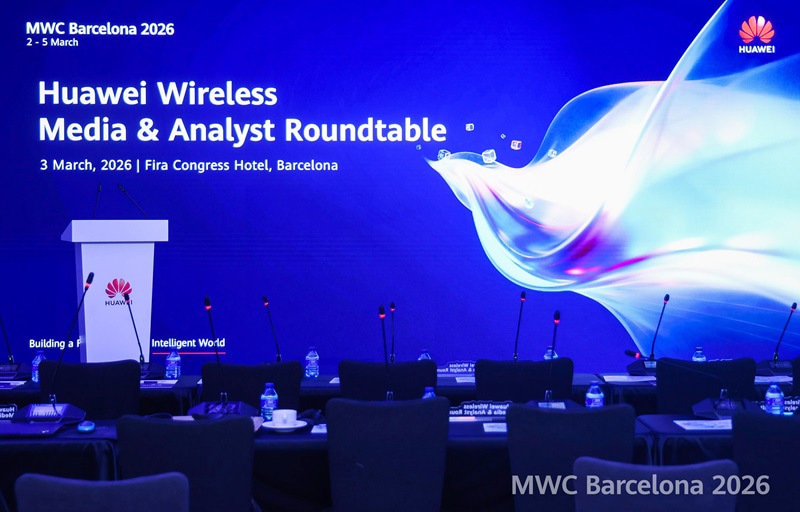
[Barcelona, Spain, March 4, 2026] During MWC26 Barcelona, Eric Zhao, Vice President and Chief Marketing Officer of Huawei’s Wireless Solution delivered a keynote speech titled “Embracing the Agentverse, Unveiling the Agent-Oriented Network” at the Wireless Media & Analysts Roundtable. He stated: “Mobile AI is sparking a paradigm shift across the communications industry. With a trillion-scale surge in Agentverse connections on the horizon, mobile networks need an urgent upgrade. To unlock the full potential of 5G-A, the industry should accelerate end-to-end upgrades and innovation, building multidimensional network capabilities that can meet the demands ahead.”
Eric Zhao, Vice President & Chief Marketing Officer, Wireless Solution, Huawei
Agents Reshape Mobile Network Demands
Agents are rapidly evolving from personal assistants into engines of industrial automation and broad societal change, unlocking unprecedented economic value. On the consumer side, AI already generates more than 60% of online content, and AI shopping and AI-created video are becoming mainstream. In industries, “silicon-based productivity” agents are making fully automated manufacturing possible through autonomous learning and the precise coordination of thousands of robots. By 2030, the global market is expected to reach trillions of intelligent connections worldwide.
The rise of AI-driven networks is pushing requirements to a new level:
Multi-directional bandwidth: Networks must evolve from today’s asymmetric uplink/downlink model to symmetric, high-bandwidth connectivity to enable smooth, real-time multimodal AI interactions.
Deterministic reliability: Jitter must be minimized to avoid safety risks when embodied robots (VTLA) collaborate across modalities. This requires end-to-end high-reliability transmission and two-way interaction to ensure data integrity.
Building Agent-Oriented Mobile Networks to Unlock Network Potential
To meet these challenges, Huawei proposes agent-oriented networks:
Agentic MBB Network: This Huawei’s new solution upgrades devices and algorithms. The industry’s first 256T U6GHz AAU delivers 1 Gbps downlink, 1 Tbps uplink, and ultra-low latency, while paving the way for 6G. Global intelligent coordination optimizes resources across time, frequency, and space to improve edge-user experience.
Token Block Pipeline: A new AI-MOS experience standard maps multimodal demand to network KPIs. Huawei’s Token Block pipeline enables layered, modality-aware transmission for truly differentiated, deterministic experiences.
A2A-T Intent Interface: This interface dedicated to the communications industry can translate business intent into network actions. While ensuring security, automated agent calls cut integration from months to days, enabling on-demand access to 5G-A capabilities.
Eric Zhao concluded: “We tend to overestimate the effect of a technology in a short run and underestimate the effect in the long run. With the mobile AI revolution and trillion-scale Agentverse connections ahead, even today’s vision may be conservative.” This is a structural shift that demands urgent action. Huawei calls on the global industry to collaborate, accelerate agent-oriented networking, fully unlock 5G-A potential, and embrace Agentverse.
MWC Barcelona 2026 will be held from March 2 to March 5 in Barcelona, Spain. During the event, Huawei will showcase its latest products and solutions at stand 1H50 in Fira Gran Via Hall 1.
The era of agentic networks is now approaching fast, and the commercial adoption of 5G-A at scale is gaining speed. Huawei is actively working with carriers and partners around the world to unleash the full potential of 5G-A and pave the way for the evolution to 6G. We are also creating AI-Centric Network solutions to enable intelligent services, networks, and network elements (NEs), speeding up the large-scale deployment of level-4 autonomous networks (AN L4), and using AI to upgrade our core business. Together with other industry players, we will create leading value-driven networks and AI computing backbones for a fully intelligent future.
For more information, please visit: https://carrier.huawei.com/en/minisite/events/mwc2026/