2 January 2026

A foster carer, who has worked for Powys County Council for 18 years, has received an MBE in the New Year Honours.
Mair Wilson, who says she is part of a team providing care with her husband Roy, their own…

2 January 2026
A foster carer, who has worked for Powys County Council for 18 years, has received an MBE in the New Year Honours.
Mair Wilson, who says she is part of a team providing care with her husband Roy, their own…
Kamoa-Kakula smelter is Africa’s largest copper smelter with a capacity of 500,000 tonnes of copper per annum
Kamoa-Kakula 2026 sales set to exceed production as 20,000 tonnes of stockpiled copper in concentrate is smelted and sold as 99.7%-pure copper anodes at current record copper prices
Kakula Mine Stage Two dewatering complete; selective mining of eastern side of Kakula Mine recommenced ahead of schedule
Kolwezi, Democratic Republic of the Congo–(Newsfile Corp. – January 2, 2026) – Ivanhoe Mines (TSX: IVN) (OTCQX: IVPAF) Executive Co-Chairman Robert Friedland and President and Chief Executive Officer Marna Cloete announced that the first copper anodes were produced by Kamoa-Kakula’s on-site, state-of-the-art 500,000-tonne-per-annum direct-to-blister copper smelter on December 29, 2025, approximately five weeks after the commencement of the smelter’s heat-up and one week after the first feed of concentrate.
Watch the video showing first feed of concentrate and casting of the first batch of anodes at the Kamoa-Kakula copper smelter: https://vimeo.com/1150929862/8c8a54cbda?share=copy&fl=sv&fe=ci
Ivanhoe Mines’ Founder and Executive Co-Chairman Robert Friedland commented:
“The first production of copper anodes from our world-class smelter is a defining moment for Kamoa-Kakula… This achievement is the culmination of a $1.1 billion investment, 18 million man-hours of disciplined execution, and an outstanding health and safety record that reflects the professionalism and commitment of everyone involved.
“This facility will proudly deliver the highest-quality Congolese copper anodes to the international markets, setting a new global benchmark for scale, efficiency, and sustainability. I want to extend my sincere thanks to the extraordinary Kamoa Copper team, as well as our contractors and partners from across the world whose expertise, innovation, and teamwork made the design and delivery of this state-of-the-art facility possible. Together, we have built something exceptional that will serve global consumers for generations to come.”
Smelter ramp-up underway to achieve a steady-state annualized rate of 500,000 tonnes of 99.7%-pure copper anode, making it the largest copper smelter in Africa.
The ramp-up of the Kamoa-Kakula copper smelter will continue throughout 2026, with completion expected towards year-end. As announced on December 3, 2025, Kamoa-Kakula’s copper production is estimated at between 380,000 and 420,000 tonnes of copper in 2026, with the mid-point of 400,000 tonnes of copper representing approximately 80% of the smelter’s total capacity.
Kamoa-Kakula’s management team will prioritize the processing of concentrates produced by the Phase 1, 2, and 3 concentrators through the on-site smelter, with any excess concentrate toll-treated at the Lualaba Copper Smelter (LCS), near Kolwezi, in the Democratic Republic of the Congo (DRC).
Heat-up and completion of hot commissioning of the smelter furnace, as well as boiler, steam systems, acid circuit and the concentrate dryer were completed in line with expectations. The furnace successfully reached its operating temperature of 1,250 degrees centigrade (2,282 degrees Fahrenheit) for five days prior to the first feed of concentrate.
Prior to the first feed of concentrate into the smelter, Kamoa-Kakula’s on-site concentrate inventory contained approximately 37,000 tonnes of copper. Total unsold copper in concentrate at the smelter, held in stockpiles and the smelting circuit, is expected to be reduced to approximately 17,000 tonnes during 2026 as the smelter ramps up. Therefore, 2026 copper sales are expected to be approximately 20,000 tonnes higher than copper production as the on-site inventory of unsold copper concentrate is destocked, predominantly during H1 2026. As destocking occurs, Kamoa-Kakula’s management aims to capitalize on near-record-high copper prices.
The installation of the uninterruptible power supply (UPS) facility was completed prior to the first feed of concentrate into the smelter, which took place on December 21, 2025. The 60-megawatt (MW) UPS is designed to provide up to two hours of instantaneous back-up power to the smelter, protecting the operation from voltage fluctuations in the domestic DRC grid. In addition, construction of Kamoa-Kakula’s 60 MW on-site solar (PV) facilities continues to progress well. The solar site, with battery storage, is expected to be the largest of its kind in Sub-Saharan Africa. The solar facilities are expected to be operational from Q2 2026, providing 24 hours a day of uninterruptible power, in addition to the approximately 180 MW of on-site diesel-powered, back-up generator capacity already in place.

A view over the casting wheels during the first batch of anodes produced by the Kamoa-Kakula Copper Smelter on December 29, 2025.

Kamoa-Kakula’s Copper Smelter is the largest copper smelter in Africa with an annualized nameplate capacity of 500,000 tonnes of 99.7%-pure copper anodes.

Kamoa-Kakula’s operating margins are set to expand due to reduced logistics costs from the smelter, as well as sales of by-product sulphuric acid
Kamoa-Kakula’s margins are expected to expand as the smelter ramps up, as concentrates produced by Phase 1, 2, and 3 concentrators are smelted on-site, rather than being exported unbeneficiated. Kamoa-Kakula’s logistics costs are expected to approximately halve as the copper content per truck-load exported more than doubles, from approximately 45% contained copper in concentrate to 99.7%-pure copper anodes. Further savings are expected to be also achieved through the significant revenues generated from sulphuric acid sales.
In addition to the first production of copper anodes, the Kamoa-Kakula smelter also produced its first batch of by-product sulphuric acid. The smelter is expected to produce up to 700,000 tonnes per annum of high-strength sulphuric acid at steady-state operations, which will be sold locally.
Sulphuric acid is in high demand by other mining operations across the Central African Copperbelt, especially following the export ban of acid by Zambia in September 2025. Spot acid prices have reached as high as $700 per tonne in Kolwezi in recent months. The first sale of acid by Kamoa-Kakula has already taken place, with the first delivery expected in the coming weeks.
Construction of copper smelter delivered with industry-leading health and safety record
Kamoa-Kakula’s projects team extended their industry-leading health and safety record during the construction of the smelter. During the 18 million hours worked, only one lost time injury (LTI) was recorded, an exceptionally rare industry achievement. Therefore, the lost-time injury frequency rate (LTIFR) for the delivery of the smelter was approximately 0.054 per million hours worked.
The last project delivered by Kamoa-Kakula’s project team was the Phase 3 concentrator, which was completed in mid-2024 without a single LTI recorded.
Stage Two dewatering of Kakula Mine complete; selective mining on the eastern side commenced ahead of schedule in late December
Stage Two dewatering activities are complete, with the first pair of high-capacity submersible dewatering pumps (Pumps 3 and 4) running dry. As announced on December 3, 2025, following an underground survey, Pumps 3 and 4 were repositioned lower in late November to enable an additional Stage Two dewatering. Since then, the water level has declined by a further 19 metres to the level shown in Figure 1. The second pair of Stage Two pumps (Pumps 1 and 2), which are approximately 20 metres lower in elevation compared with Pumps 3 and 4 are expected to run dry in January 2026.
Stage Three dewatering activities will take over from Stage Two dewatering, and consist of re-commissioning the existing, water-damaged underground horizontal pump stations, which are used for steady-state operations. The rehabilitation work consists of fitting new pump motors, substations and electrical cabling. All required equipment is on site, and installation will begin once access to the horizontal pump stations becomes available.

Figure 1. A schematic of the underground water levels at the Kakula Mine as at December 22, 2025, overlaid with the underground pumping infrastructure.
There is currently 5,600 litres per second of installed pumping capacity at the Kakula Mine, excluding the Stage Two pumping infrastructure. Stage Three dewatering activities are expected to continue into Q2 2026 and will not be on the critical path for Kakula’s mining operations.
In addition, the western side of the Kakula Mine has been dewatered, enabling the mining of higher-grade areas. Head grades from mining areas on the western side of Kakula are expected to increase from 3.5% copper in January to approximately 4.0% copper by the end of Q1 2026. In addition, selective mining on the eastern side of the Kakula Mine began ahead of schedule at the end of December.
Qualified Persons
Disclosures of a scientific or technical nature at the Kamoa-Kakula Copper Complex in this news release have been reviewed and approved by Steve Amos, who is considered, by virtue of his education, experience, and professional association, a Qualified Person under the terms of NI 43-101. Mr. Amos is not considered independent under NI 43-101 as he is Ivanhoe Mines’ Executive Vice President, Projects. Mr. Amos has verified the technical data disclosed in this news release.
Ivanhoe has prepared an independent, NI 43-101-compliant technical report for the Kamoa-Kakula Copper Complex, which is available on the company’s website and under the company’s SEDAR+ profile at www.sedarplus.ca:
The technical report includes relevant information regarding the assumptions, parameters, and methods of the mineral resource estimates on the Kamoa-Kakula Copper Complex cited in this news release, as well as information regarding data verification, exploration procedures and other matters relevant to the scientific and technical disclosure contained in this news release.
About Ivanhoe Mines
Ivanhoe Mines is a Canadian mining company focused on advancing its three principal operations in Southern Africa; the Kamoa-Kakula Copper Complex in the DRC, the ultra-high-grade Kipushi zinc-copper-germanium-silver mine, also in the DRC; and the tier-one Platreef platinum-palladium-nickel-rhodium-gold-copper mine in South Africa.
Ivanhoe Mines is exploring for copper in its highly prospective, 54-100% owned exploration licences in the Western Forelands, covering an area over six times larger than the adjacent Kamoa-Kakula Copper Complex, including the high- grade discoveries in the Makoko District. Ivanhoe is also exploring for new sedimentary copper discoveries in new horizons including Angola, Kazakhstan, and Zambia.
Information contact
Follow Robert Friedland (@robert_ivanhoe) and Ivanhoe Mines (@IvanhoeMines_) on X.
Forward-looking statements
Certain statements in this release constitute “forward-looking statements” or “forward-looking information” within the meaning of applicable securities laws. Such statements and information involve known and unknown risks, uncertainties, and other factors that may cause the actual results, performance, or achievements of the company, its projects, or industry results, to be materially different from any future results, performance, or achievements expressed or implied by such forward-looking statements or information. Such statements can be identified using words such as “may”, “would”, “could”, “will”, “intend”, “expect”, “believe”, “plan”, “anticipate”, “estimate”, “scheduled”, “forecast”, “predict” and other similar terminology, or state that certain actions, events, or results “may”, “could”, “would”, “might” or “will” be taken, occur or be achieved. These statements reflect the company’s current expectations regarding future events, performance, and results and speak only as of the date of this release.
Such statements include, without limitation: (i) statements that 2026 copper sales are expected to be approximately 20,000 tonnes higher than copper production as the on-site inventory of unsold copper concentrate is destocked, predominantly during H1 2026; (ii) statements that the Kamoa-Kakula smelter is Africa’s largest copper smelter with a capacity of 500,000 tonnes of copper per annum; (iii) statements that total unsold copper in concentrate at the smelter, held in stockpiles and the smelting circuit, is expected to be reduced to approximately 17,000 tonnes during 2026 as the smelter fully ramps up; (iv) statements that the ramp-up of the Kamoa-Kakula copper smelter will continue throughout 2026, with completion expected towards year-end; (v) statements that head grades from mining areas on the western side of Kakula are expected to increase from 3.5% copper in January to approximately 4.0% copper by the end of Q1 2026; (vi) statements that Kamoa-Kakula’s copper production is estimated at between 380,000 and 420,000 tonnes of copper in 2026, with the mid-point of 400,000 tonnes of copper representing approximately 80% of the smelter’s total capacity; (vii) statements that Kamoa-Kakula’s management team will prioritize the processing of concentrates produced by the Phase 1, 2, and 3 concentrators through the on-site smelter, with any excess concentrate toll-treated at the Lualaba Copper Smelter; (viii) statements that Kamoa-Kakula’s 60 MW on-site solar site, with battery storage, is expected to be the largest of its kind in Sub-Saharan Africa and that the solar facilities are expected to be operational from Q2 2026, providing 24 hours a day of uninterruptible power; (ix) statements that once fully ramped up, the smelter’s overall copper recovery is expected to be 98.5%; (x) statements that Kamoa-Kakula’s margins are set to expand as logistics costs approximately halve as the copper content per truck-load exported more than doubles, from approximately 45% contained copper in concentrate to 99.7%-pure copper anodes. Further savings are also expected to be achieved through the significant revenues generated from sulphuric acid sales; (xi) statements that Stage Three dewatering activities are expected to continue into Q2 2026 and will not be on the critical path for Kakula’s mining operations, and; (xii) statements that head grades from mining areas on the western side of Kakula are expected to increase from 3.5% copper in January to approximately 4.0% copper by the end of Q1 2026.
Forward-looking statements and information involve significant risks and uncertainties, should not be read as guarantees of future performance or results, and will not necessarily be accurate indicators of whether such results will be achieved. Many factors could cause actual results to differ materially from the results discussed in the forward-looking statements or information, including, but not limited to: (i) uncertainty around the rate of water ingress into underground workings; (ii) the ability, and speed with which, additional equipment can be secured, if an as required; (iii) the continuation of seismic activity; (iv) the full state of underground infrastructure; (v) uncertainty around when future underground access can be fully secured; (vi) the fact that future mine stability cannot be guaranteed; (vii) the fact that future mining methods may differ and impact on Kakula operations; and (viii) the ultimate conclusion of the assessment of the cause of the seismic activity at Kakula and the impact of same on the final mining plan at the Kamoa Kakula Copper Complex. Additional factors also include those discussed above and under the “Risk Factors” section in the company’s MD&A for the three and nine months ended September 30, 2025, and its current annual information form, and elsewhere in this news release, as well as unexpected changes in laws, rules or regulations, or their enforcement by applicable authorities; changes in the rate of water ingress into underground workings; recurrence of seismic activity; the state of underground infrastructure; delays in securing full underground access; changes to the mining methods required in the future; the failure of parties to contracts with the company to perform as agreed; social or labour unrest; changes in commodity prices; and the failure of exploration programs or studies to deliver anticipated results or results that would justify and support continued exploration, studies, development or operations.
Although the forward-looking statements contained in this news release are based upon what management of the company believes are reasonable assumptions, the company cannot assure investors that actual results will be consistent with these forward-looking statements. These forward-looking statements are made as of the date of this news release and are expressly qualified in their entirety by this cautionary statement. Subject to applicable securities laws, the company does not assume any obligation to update or revise the forward-looking statements contained herein to reflect events or circumstances occurring after the date of this news release.
The company’s actual results could differ materially from those anticipated in these forward-looking statements as a result of the factors outlined in the “Risk Factors” section in the company’s MD&A for the three and nine months ended September 30, 2025, and its current annual information form.
To view the source version of this press release, please visit https://www.newsfilecorp.com/release/279364


Published 02 January 2026 4 min read
England Women’s Senior Team

A newly identified and rare genetic variant slows the growth of mutated blood stem cells, researchers report, and it reduces the risk of leukemia. The findings offer insight into why some people are naturally more resistant to…
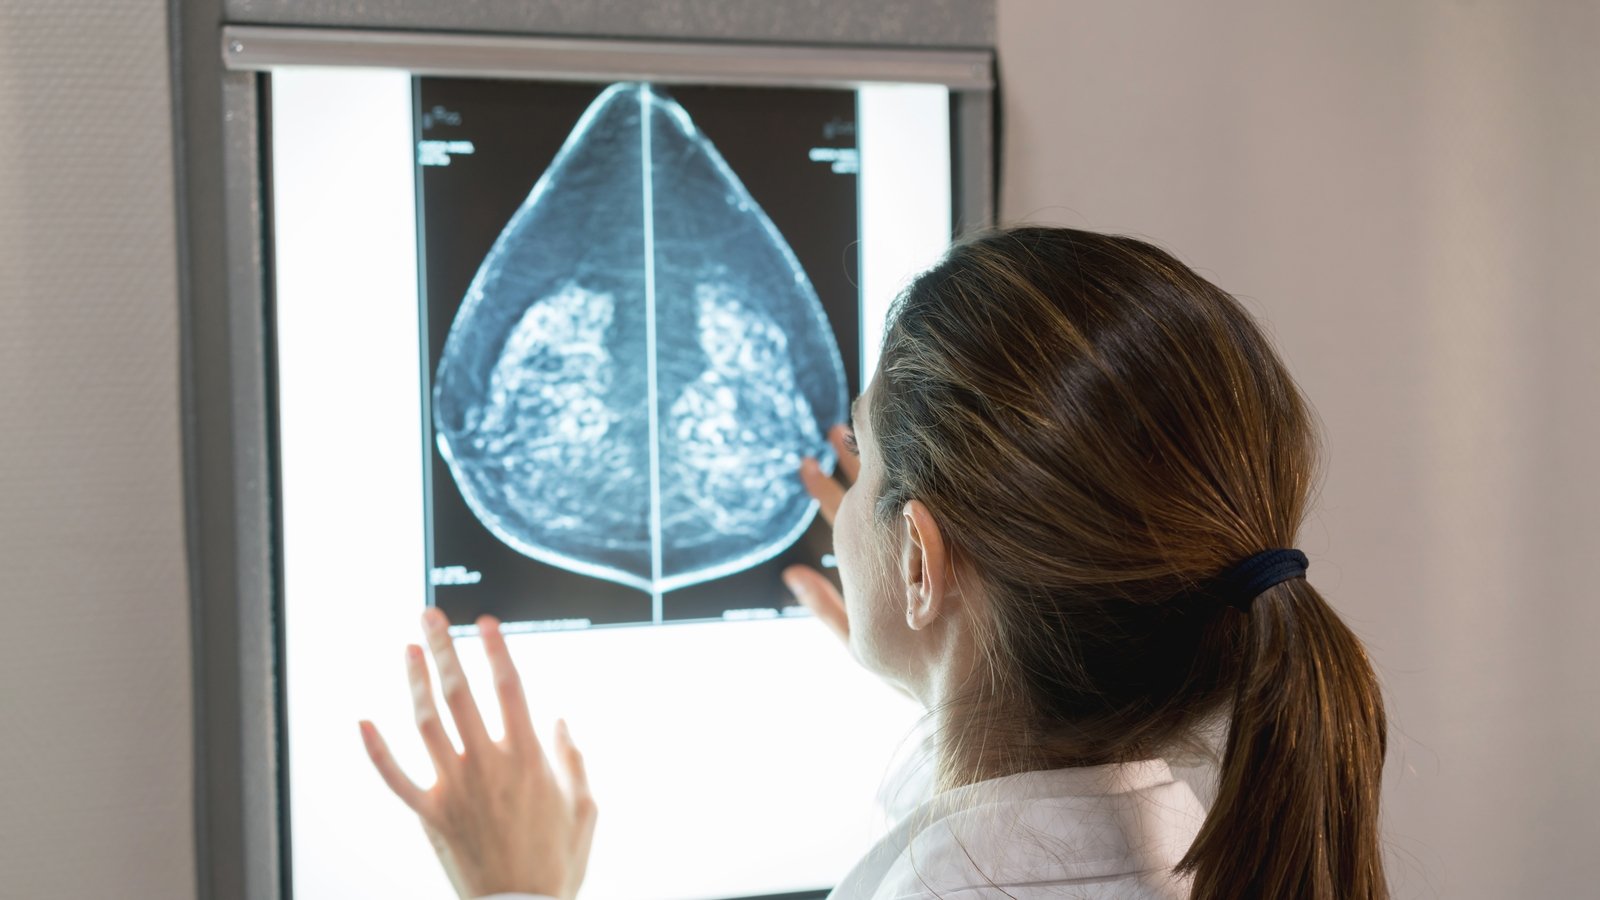
The Irish Cancer Society is urging people to avail of the appropriate cancer screenings for their age and for those who suspect any symptoms to visit their GP.
One in two people will get cancer in their lifetime, with…
Mark Poynting,Climate researcher,
Becky Dale,Senior data journalist, BBC Verifyand
Jess Carr,Data designer
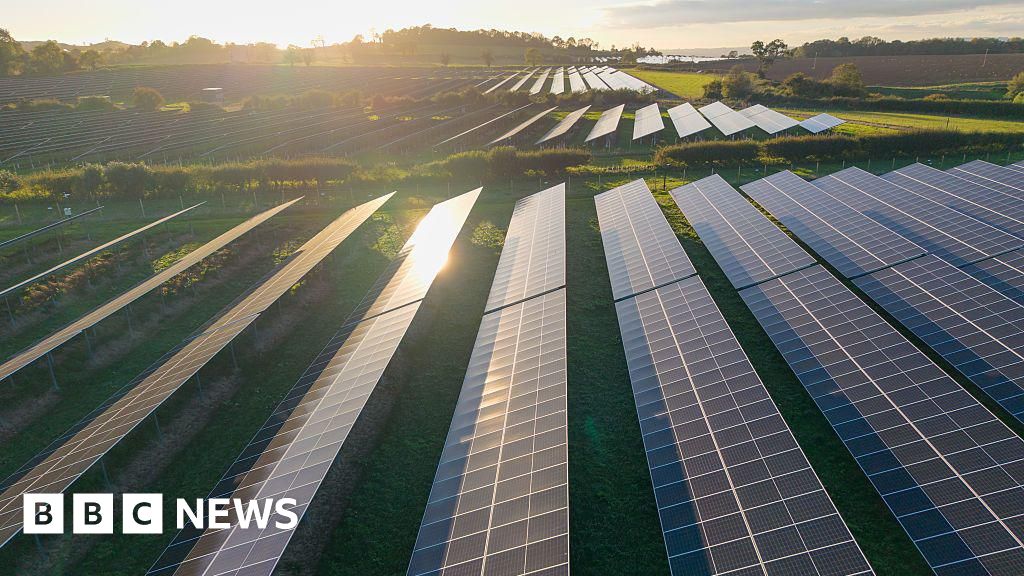
 Getty Images
Renewable energy – considered crucial to limiting climate change – produced a record amount of electricity in Great Britain in 2025, BBC analysis shows.
Wind was the biggest single renewable source of electricity, according to the provisional figures from the National Energy System Operator (Neso).
But solar-powered electricity rose by nearly a third on 2024 levels, helped by the UK’s sunniest year on record and the expansion of solar panels around the country.
While behind renewables, electricity from fossil gas also rose slightly, highlighting the challenge of reaching the government’s “clean power” target by 2030.
“It has been quite a strong year in terms of deployment of renewables,” said Pranav Menon, research senior associate at the Aurora Energy Research think tank.
“[But] what we’re not seeing is kind of the exponential scale-up that you’d need to get to clean power 2030, because those targets are very, very ambitious,” he added.
Under its “clean power” target, the government aims to use hardly any polluting gas to produce electricity by 2030. It is also under pressure to meet its pledge to bring energy bills down by up to £300 by then and has argued that clean power can achieve this.
Neso data – and the clean power target – only cover Great Britain and not Northern Ireland, which has its own electricity transmission system operator.
The recent growth of renewables has been one of the strongest areas of progress in the world’s attempts to tackle climate change.
The trend has been notable in Great Britain over the past decade too. The government wants to ramp up renewables even more quickly to help meet its own clean power goal and reduce its planet-warming carbon emissions.
In 2025, wind, solar, hydro and biomass generated more than 127 terawatt hours (TWh) of electricity in Great Britain, according to BBC analysis of provisional Neso data.
That beats the previous high of 119TWh in 2024.

Wind generated more than 85TWh – nearly 30% – of Great Britain’s electricity last year, up slightly on 2024, according to analysis of Neso data.
But the most notable change was solar power.
Over the course of the year, solar panels generated more than 18TWh – over 6% of British electricity.
While that is still a relatively small share, it marks a growth of more than 4TWh versus 2024.
At its peak, solar was producing more than 40% of electricity for a small number of half-hour periods in July.
Back in 2013, no such period had more than roughly 5% of electricity generation from solar.

Part of the reason is the expansion of solar panels across the UK. More large solar farms came online this year, including the biggest at Cleve Hill near Faversham, in Kent.
And it was a record year for solar panels on rooftops, with about 250,000 new small-scale installations reported to the Microgeneration Certification Scheme.
With 2025 the UK’s sunniest year on record, conditions were ideal for British solar panels to capitalise on long, sunny days through the spring and summer.
“Solar’s probably a bigger part of the system than we’d expected, given the cost has come down so much,” said Michael Grubb, professor of energy and climate change at University College London.
Renewables can generate significant amounts of electricity when conditions are right. On roughly a third of days in 2025, at least half of Britain’s electricity came from renewables, according to BBC analysis of Neso data.

But the British electricity grid often still leans heavily on fossil fuel gas.
Analysis of Neso’s figures shows gas generated more than 77TWh – roughly 27% – of electricity, up from 72TWh in 2024.
That increase could be down to several factors, including Britain importing slightly less electricity from Europe, lower nuclear generation, the closure of the last coal power station in 2024 and higher electricity demand.
Driven by the rise in gas, Britain’s electricity was slightly more polluting in 2025 than 2024, according to Neso’s data.
In 2025, each kilowatt-hour (kWh) of electricity generated 126g of planet-warming carbon dioxide on average – up from 124g/kWh in 2024 but down from 505g/kWh in 2012.

With the exception of wind and solar, Neso’s figures only cover generation connected to the main transmission network.
They do not include smaller-scale gas, biomass and hydro operators feeding in electricity at a local level, but these contribute a relatively small fraction of Britain’s total generation.
Separate analysis of UK government data by the climate website Carbon Brief – which includes these smaller sources and Northern Ireland – shows very similar trends to the Neso data for Great Britain. That includes a new renewables record and a slight rise in gas generation.
The government has defined its “clean power” target as 95% of all electricity generated in Britain coming from renewables and nuclear energy by 2030.
In 2024 clean sources produced almost three-quarters of total electricity generation for the year, according to government figures.
These numbers differ from Neso data, which includes imports as well as some gas generation not covered by the government’s clean power definition.
Government figures for 2025 will not be released until later this year – but the amount of gas still in the electricity mix shows there is much to be done.
“There’s still a significant number of periods in the year where the sun’s not shining, the wind’s not blowing, demand is high […] and that’s where the system is sort of forced to rely on gas-fired power to turn up and meet demand,” said Mr Menon.
He added that there were solutions to this challenge. They include technologies like batteries – to store renewable electricity to use when it is less sunny and windy – as well as other low-carbon sources like nuclear, which can provide dependable output.
One of the other struggles in meeting the clean power target is the need to upgrade the electricity grid, partly to connect new renewables and move their electricity around the country.
Sometimes the grid cannot cope with all of the renewable electricity that could be generated, leading to wind farms being paid to reduce their output.
Grid upgrades should help to reduce the problem but upgrades add to costs in the short term.
That could offset some of the savings from some of the cheapest renewables which are starting to displace gas power, according to Prof Grubb.
But he said he still expected bills to start to come down in the coming years – partly due to those renewables, but also assuming gas prices fall from their recent high levels.
In response to the renewables data, Energy Secretary Ed Miliband said: “After years of delay and underinvestment, this government is keeping its promise to take back control of Britain’s energy with clean homegrown power.”
This would “protect households against volatile fossil fuel markets”, he added.
But shadow energy secretary Claire Coutinho called on the government to ditch its clean power target, arguing it was raising energy bills.
“Britain is generating more renewable power than ever before, but people should know about the extra costs that come along with it,” she said.


At least seven people have died and many others are missing after a boat carrying about 200 migrants attempting to reach Europe capsized off the coast of The Gambia, authorities say.
The boat overturned on Wednesday midnight near Jinack village…

Apple is scaling back the Vision Pro after weak sales. For the payments ecosystem, it is a sign that “spatial computing” will remain a niche channel for shopping, identity and in-app spending for now.
