The St. Louis Blues announced today that forward Zach Dean has been cleared by the NHL/NHLPA Player Assistance Program to return to active status with the organization.
Dean has been assigned to the Blues’ AHL affiliate, the Springfield…

The St. Louis Blues announced today that forward Zach Dean has been cleared by the NHL/NHLPA Player Assistance Program to return to active status with the organization.
Dean has been assigned to the Blues’ AHL affiliate, the Springfield…

SAN ANTONIO – Jud Ashmore, a former KSAT 12 weatherman and a fixture in San Antonio media, died this week. He was 101 years old.
Ashmore’s death was announced on Wednesday.
A member of the Navy, Ashmore served in the Pacific during World War…

IMAGES AND BROLL MEDIA KIT
PASADENA, Calif., Jan. 1, 2026 /PRNewswire/ — Princess Cruises rang in 2026 in full bloom with a stunning appearance at the iconic 137th Rose Parade®, unveiling its “Together in the Magic of…

Physical activity continues to affect the body even after the movement itself has ended.
A new study published in the Proceedings of the National Academy of Sciences reports that being physically active increases the total amount of energy a…

From a young age, artist Piiij Goodrem preferred to push painful experiences and feelings away from sight rather than confront them.
“I was brought up in a way that really indicated to me that the best way to deal with something is to sweep it…
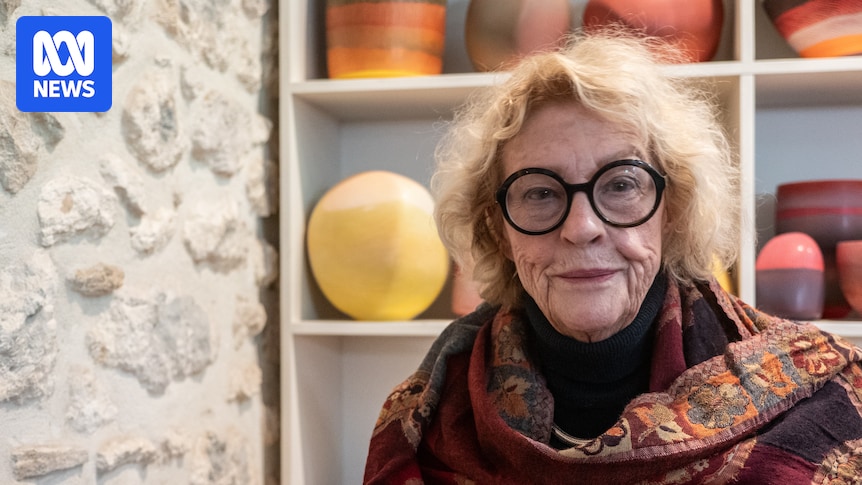
At 82, artist Pippin Drysdale brims with energy and humour.
The renowned Western Australian ceramic artist’s major retrospective, Infinite Terrain, opened in December at the Art Gallery of Western Australia (AGWA), and its creation is due, in…


TAMPA, Fla., January 1, 2026 – The…