
…
Author: admin
-

Heritage Financial Corporation Receives Regulatory Approval to Acquire Olympic Bancorp, Inc.
OLYMPIA, Wash., Dec. 29, 2025 /PRNewswire/ — Heritage Financial Corporation (“Heritage”) (Nasdaq: HFWA) announced today that it has received all regulatory approvals required to complete the previously announced merger (the “Merger”) of Olympic Bancorp, Inc. (“Olympic”) with and into Heritage, and the merger of Kitsap Bank with and into Heritage Bank.
Heritage expects the transaction to close on or about January 31, 2026, subject to the satisfaction of customary closing conditions, including the receipt of shareholder approval by the shareholders of both Heritage and Olympic.
Heritage Financial Corporation (PRNewsFoto/Heritage Financial Corporation) (PRNewsFoto/Heritage Financial Corporation)
“We are pleased to have received the necessary regulatory approvals as this is an important step towards integrating a successful merger,” said Bryan McDonald, Heritage President and CEO. “Kitsap Bank’s relationship banking strategy nicely compliments Heritage’s strategies. This combination will create a more robust banking platform for communities across the Puget Sound region.”
About Heritage
Heritage Financial Corporation is an Olympia-based bank holding company with Heritage Bank, a full-service commercial bank, as its sole wholly-owned banking subsidiary. Heritage Bank has a branching network of 51 banking offices in Washington, Oregon, and Idaho. Heritage Bank also does business under the Whidbey Island Bank name on Whidbey Island. Heritage’s stock is traded on the NASDAQ Global Select Market under the symbol “HFWA.” More information about Heritage Financial Corporation can be found on its website at www.hf-wa.com and more information about Heritage Bank can be found on its website at www.heritagebanknw.com.SOURCE Heritage Financial Corporation
Continue Reading
-

Your AI Workflow Is Missing a Composable Architecture
“Don’t ask the model to build your whole app. Break your request into smaller parts and generate one function, hook, or component at a time.”
You’ve probably heard this advice if you use AI tools like Copilot or ChatGPT to write…
Continue Reading
-
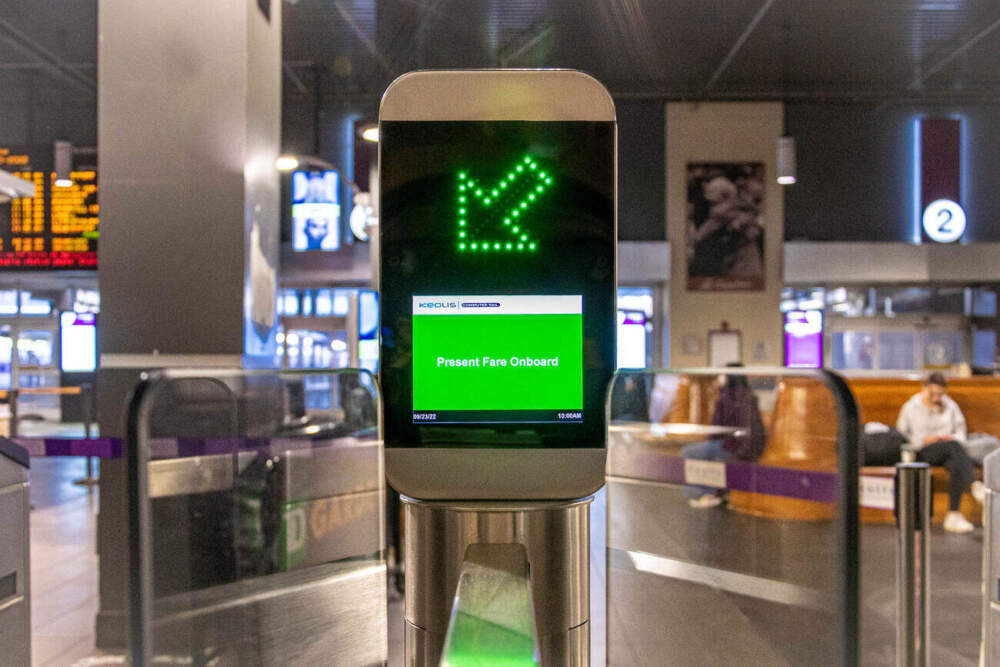
Fare gates to begin operation Tuesday at South Station for commuter rail passengers
Beginning Tuesday, commuter rail passengers will need to tap or scan their train tickets to enter the track area at South Station, as the MBTA begins a major change in fare collection operations.
The T and and its commuter rail operator Keolis Commuter Services announced Monday that installation of fare gates at the Boston transportation hub is complete and gates will be phased into operation. The T also released a how-to video and said station staff will be available on concourses to help passengers.
The layout includes 40 gates installed around the concourse area, including 11 wider gates that allow room for wheelchairs, scooters, bicycles, luggage and strollers, according to the T.
Fare gates will be introduced to passengers incrementally, with more expected to be in service as testing is completed. Conductors will also still check tickets on board trains to verify travel zones, the T said.
Passengers can use the following types of tickets to exit and enter the gates: the mTicket app, CharlieCards and CharlieTickets with printed zones, $10 weekend paper tickets, Amtrak tickets, and active military IDs. Stored value CharlieCards for the bus and subway are not accepted at commuter rail fare gates, and commuter rail fare gates cannot accept payment by contactless debit/credit card, phone, or watch with a mobile wallet.
“The new fare gates at South Station – one of the busiest travel hubs in the Northeast – is another demonstration to our riders that we are committed to ensuring fares are collected and reinvested into the transit system to better serve the public,” said MBTA General Manager Phillip Eng.
Fare gates opened at North Station in 2022, and fare gates are also planned to open at Back Bay Station and Ruggles Station in 2026.
“Combined with upgrades to on-board sales and record conductor scans, Keolis is collecting more Commuter rail revenue than ever before on behalf of the MBTA,” said Keolis General Manager John Killeen.
Continue Reading
-
Deadly Train Derailment in Mexico Hits Priority Rail Project – Bloomberg.com
- Deadly Train Derailment in Mexico Hits Priority Rail Project Bloomberg.com
- Mexico train crash kills 13 and injures almost 100 BBC
- Thirteen killed as train carrying 250 derails in Mexico The Express Tribune
- Mexico’s Sheinbaum says justice will…
Continue Reading
-
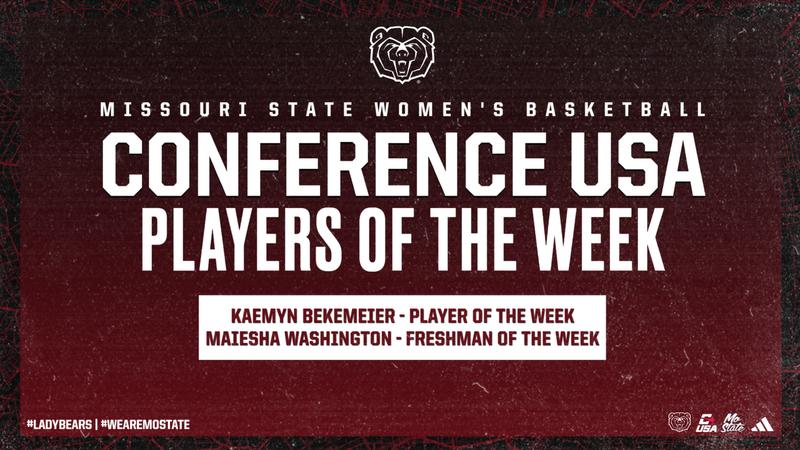
Bekemeier, Washington Sweep CUSA Weekly Awards
DALLAS – Missouri State women’s basketball’s Kaemyn Bekemeier and Maiesha Washington swept this week’s Conference…
Continue Reading
-

Ray Goss to Retire as President of R. J. Corman Railroad Company
December 29, 2025
NICHOLASVILLE, Ky. – R. J. Corman Railroad Company today announced that Raymond (Ray) Goss will retire from his role as President effective January 30th, 2026, following a distinguished career spanning five decades in the rail industry and seven years leading R. J. Corman’s short line and switching operations.
“Ray has been an exceptional leader whose steady hand and deep industry knowledge have strengthened our short line operations and elevated our service standards. We are grateful for his dedication and wish him the very best in retirement,” said Justin Broyles, President & CEO of R. J. Corman Railroad Group.
Before joining R. J. Corman Railroad Company, Ray Goss built a distinguished reputation in the rail industry. He held various leadership and operational roles at major railroads such as Genesee & Wyoming Inc., Amtrak Corporation, and Canadian Pacific Railway, where he developed expertise in engineering, transportation management, safety initiatives, and customer relations. His broad experience and commitment to excellence positioned him as a respected figure in the field, ultimately leading to his appointment as President of R. J. Corman Railroad Company’s operations.
Under Ray Goss’s leadership, R. J. Corman Railroad Company achieved remarkable growth and modernization. Since 2019, the company expanded its network through strategic acquisitions and new operations, adding the Childersburg Line, Raleigh & Fayetteville Railroad, Knoxville & Cumberland Gap Railroad, as well as the Owego & Harford Railway, Lehigh Railway, and Luzerne & Susquehanna Railway. These additions strengthened R. J. Corman’s presence across key regions and enhanced its ability to serve diverse markets.
Goss also championed transformative infrastructure improvements, securing federal TIGER and CRISI grants to rehabilitate hundreds of miles of track, upgrade bridges, and modernize grade crossings. These investments improved safety, efficiency, and reliability for customers while supporting regional economic development. Under his tenure, the company consistently earned top safety honors, with all short lines receiving Jake Awards in recent years and several earning the prestigious President’s Award for exemplary safety performance. These accomplishments reflect Goss’s unwavering commitment to operational excellence and customer service, leaving a lasting legacy of growth and innovation.
“It has been an honor to lead R. J. Corman’s railroads and work alongside such a talented team,” said Ray Goss. “Together, we’ve advanced safety, improved efficiency, and strengthened relationships with our customers. I’m proud of what we’ve accomplished, and I’m confident that they will continue to be leaders in the industry and take the company to new heights.”
About R. J. Corman Railroad Company, LLC
R. J. Corman Railroad Company, LLC operates 19 short line railroads in 11 states and is a subsidiary of R. J. Corman Railroad Group, LLC. Altogether, the company employs approximately 1,400 people in 24 states. In addition to short line railroad and switching operations, R. J. Corman companies provide a broad scope of services to the railroad industry, such as emergency response, track material distribution, track construction, and signal design and construction.
For more information about the company, visit www.rjcorman.com.
###
Continue Reading
-
Hamas confirms death of former spokesperson Abu Obeidah
Hamas confirms death of former spokesperson Abu Obeidah | The Jerusalem Post Continue Reading
-

Researchers make “neuromorphic” artificial skin for robots
The nervous system does an astonishing job of tracking sensory information, and does so using signals that would drive many computer scientists insane: a noisy stream of activity spikes…
Continue Reading