Greek authorities rescued 545 migrants from a fishing vessel off Gavdos on Friday in one of the largest operations in recent months, as arrivals from Libya to Greece’s southernmost islands continue to surge.
The Hellenic Coast Guard received a…

Greek authorities rescued 545 migrants from a fishing vessel off Gavdos on Friday in one of the largest operations in recent months, as arrivals from Libya to Greece’s southernmost islands continue to surge.
The Hellenic Coast Guard received a…
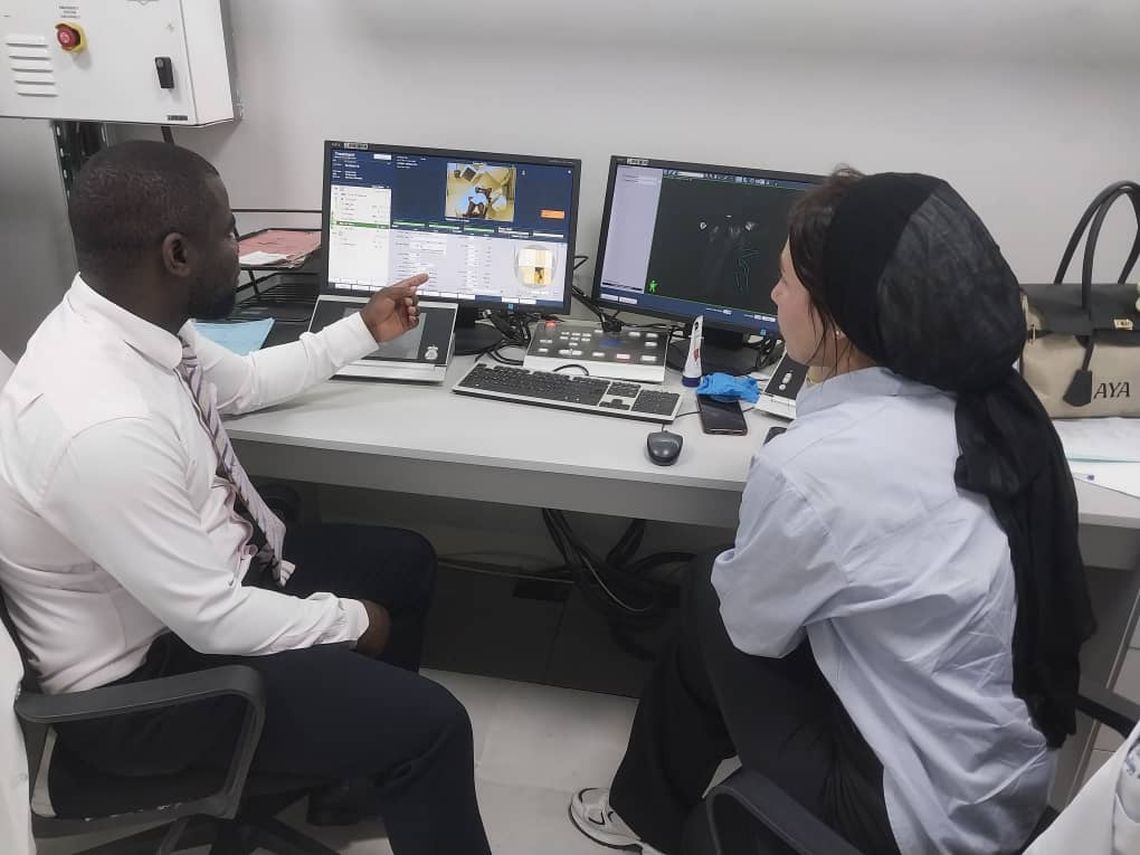
For the first time, the Uganda Cancer Institute in Kampala has treated an aggressive paediatric brain tumour using an advanced radiotherapy known as volumetric modulated arc therapy, with support from the IAEA.
This technique shapes…

Brewing company Carlsberg is improving its supply chain through regenerative farming and packaging innovations to achieve its net zero emissions goals
As a leading global brewing company, Carlsberg is embedding sustainability into its corporate…

Estimated reading time: 7 minutes
London Borough of Hounslow and Chesterfield Borough Council worked together on a joint pilot to test new digital tools for managing consultation responses.
This was a PropTech Innovation Fund pilot and describes what was tested at the time.
Local plan consultations can generate large volumes of responses in multiple formats, including emails, PDFs, documents and portal submissions. Officers often spend weeks copying comments into spreadsheets, splitting long submissions into topics, assigning work to colleagues and drafting consistent replies. This slows down the consultation process and limits the time available for community engagement and plan making.
Hounslow and Chesterfield wanted to:
The councils worked together to design and test new consultation response management software within the PlaceMaker platform.
To develop the tool, they:
The new features developed through the pilot included:
This gave officers more information in one place and reduced the amount of manual processing required.
The pilot led to measurable improvements in efficiency and consistency. Hounslow found that:
The councils found that:
Both councils intend to use the new system for future consultations and explore additional automation, including AI assisted tagging and summarising. They also plan to refine how responses are fed directly into the tool through integrated consultation modules, reducing manual copying and splitting. Chesterfield will complete live testing during its next consultation. The councils are exploring how this functionality could be expanded to other planning tasks and potentially across wider council services.
If you have feedback on this case study, you can share it using our short feedback form.
External links on this page are included to help users find relevant information. Their inclusion does not imply government endorsement of any organisation, product or service.

PM to inaugurate and lay the foundation stone of projects worth around Rs. 15,600 crore in Assam
PM to inaugurate New Terminal Building of Lokapriya Gopinath Bardoloi International Airport in Guwahati
Spread over nearly 1.4 lakh square metres,…

Head’s struggles before this series – only one score of 40 or more in 20 innings going back to June – are now a distant memory.
Four days training before the series – something the most laidback of 31-year-old’s said was “unprecedented” for him -…

Women are way more likely than men to suffer from irritable bowel syndrome (IBS), a chronic…

Press Release: Friday, 19 December 2025
Longford Lights 2026, Ireland’s largest community-based light festival,…