England batter Harry Brook admitted that he might need to slightly curb his aggressive instincts when the Ashes goes on the line in the third Test in Adelaide this week.
Coach Brendon McCullum insisted on Sunday that England’s aggressive style…

England batter Harry Brook admitted that he might need to slightly curb his aggressive instincts when the Ashes goes on the line in the third Test in Adelaide this week.
Coach Brendon McCullum insisted on Sunday that England’s aggressive style…
Aortic dissection (AD) is a rare yet catastrophic cardiovascular disease, characterized by a tear in the intimal layer of the aorta, which leads to the separation of the aortic wall layers and disrupts blood flow to vital organs.1 In…
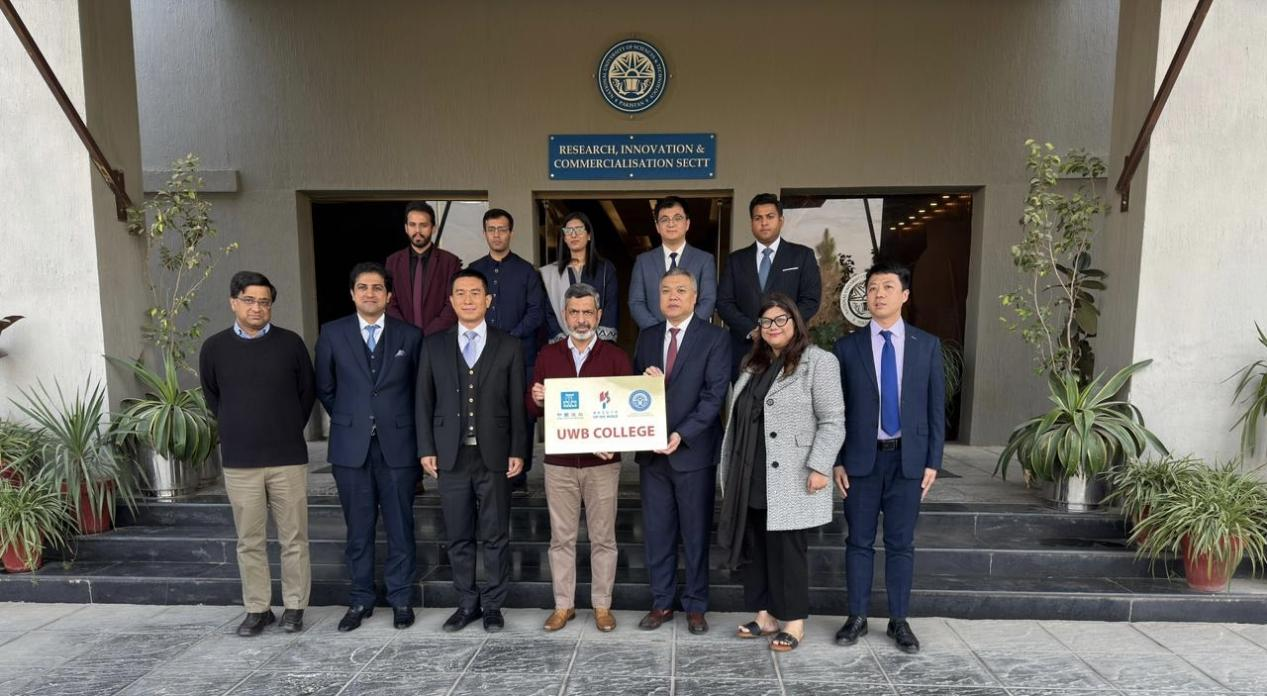
China State Construction Engineering Corporation (CSCEC) Pakistan Office and Pakistan’s National University of Sciences and Technology (NUST) have inaugurated the “Luban College – Up We Build (UWB) College” at NUST, strengthening…

Maddox Langbein, a seven-year-old diagnosed with Moyamoya disease, a rare condition where narrowed…
New research has shown that water movement in clay-rich soils can lift stone artefacts toward the surface – exerting a natural influence on how archaeological materials are distributed across the surface of some landscapes.
The study, published in Archaeometry, was part of the Dating Murujuga’s Dreaming project and focused on a clay-rich sediment basin in the newly listed UNESCO World Heritage Murujuga Cultural Landscape in Western Australia’s Pilbara region.
Researchers from The University of Western Australia and collaborators highlighted the importance of understanding soil mineralogy and moisture processes when interpreting cultural landscapes, particularly in clay-dominated environments common across northern Australia.
The project brought together archaeologists, soil scientists, geomorphologists, geochemists, and Murujuga Aboriginal Corporation members, to conduct wetting and drying experiments on different soil types.
It combined soil analysis with CT-scanning and 3D image analysis to reveal how water interacts with the clay minerals and track artefact movement within the soil.
The project investigated swelling clays that expand as water is absorbed and contract as it dries.
The wetting and drying cycles caused subtle but persistent soil movement that pushed stone artefacts upwards over time, which can create mixing within the soil profile.
The outcome of soil movement was a surface concentration of stone artefacts that did not reflect the original archaeological context and that may have been deposited at any time within the human past.
Lead author Dr Caroline Mather, from UWA’s School of Agriculture and Environment, said the work demonstrated why interdisciplinary collaboration was essential for accurate archaeological interpretation.
“Clay soils are dynamic materials that respond to wet and dry cycles and are common on Earth’s surface,” Dr Mather said.
“The results highlight why we need to consider soil and water processes alongside standard archaeological approaches when interpreting what we see on the surface and within soil and sediment profiles.”
The findings reinforce that water is a powerful driver of change in both environmental and cultural systems at Murujuga, shaping how artefacts move, and ultimately become visible.
The study also demonstrated the value of working closely with Traditional Owners and Custodians to understand how scientific and cultural knowledge intersect in this globally significant cultural landscape.
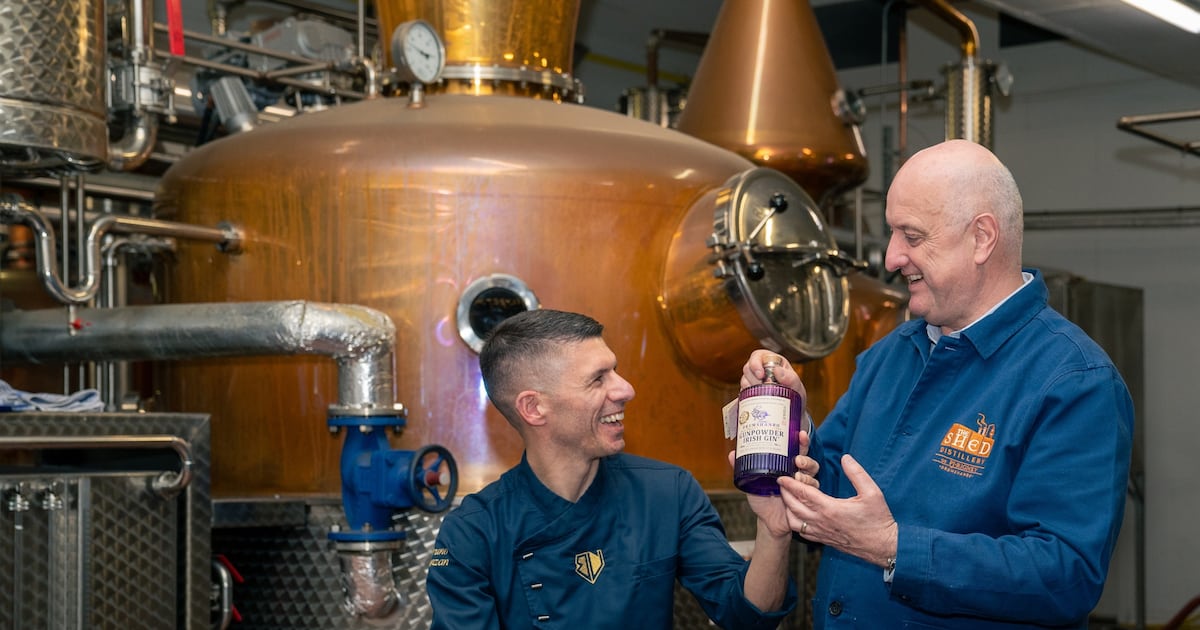
The maker of Drumshanbo Irish Gunpowder Gin increased its revenues and profits this year in spite of having to absorb the impact of tariffs imposed on its imports to the US and the effect of a weak dollar on its business.
In the year to the end…
December 15, 2025 (MLN): The reforms outlined in the latest review of the
International Monetary Fund’s (IMF) Extended Fund Facility (EFF) are neither
new nor externally imposed, but rather part of a phased reform agenda agreed
with the IMF…

Pakistan Navy reaffirmed its operational readiness and war-fighting capability through a successful live weapon firing (LWF) of FM-90(N) ER Surface-to-Air Missile in the north Arabian Sea.
During the firepower demonstration, Pakistan Navy ship…

SpaceX launched 29 Starlink satellites from Florida early Monday morning (Dec. 14), beating the forecast for poor weather.
A Falcon 9 rocket lifted off at 12:25 a.m. EST (0525 GMT) from Space Launch Complex 40 (SLC-40) at the Cape Canaveral Space…
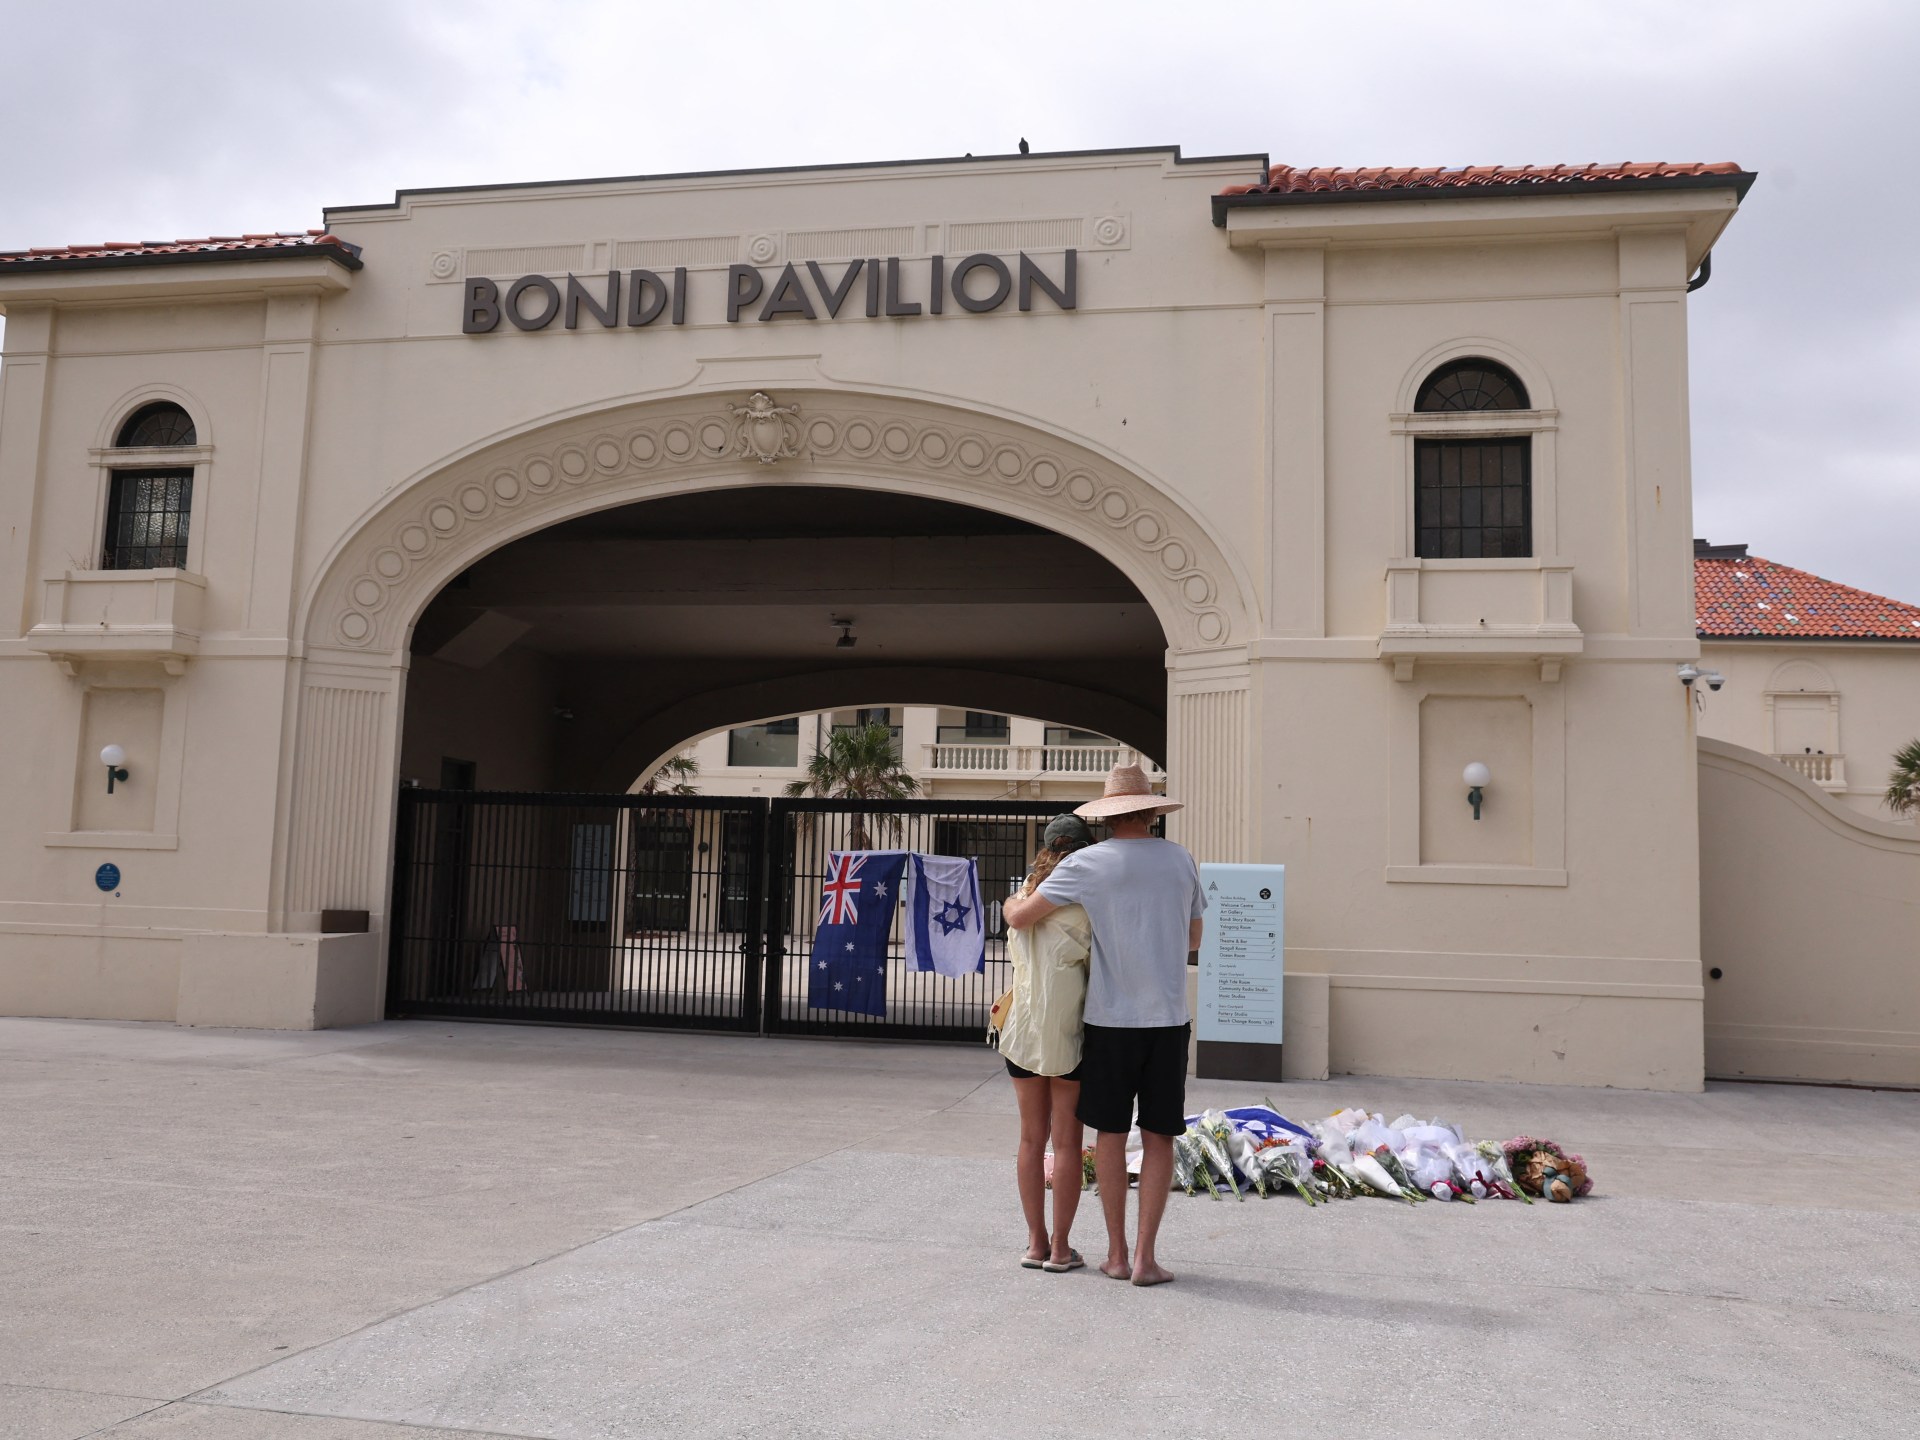
Australian Prime Minister Anthony Albanese has pledged a review of his country’s gun laws and added support for Jewish Australians, as his government faces scrutiny following a deadly shooting at Sydney’s Bondi Beach.
On Monday afternoon,…