Kumail JafferLocal Democracy Reporting Service
 Getty Images
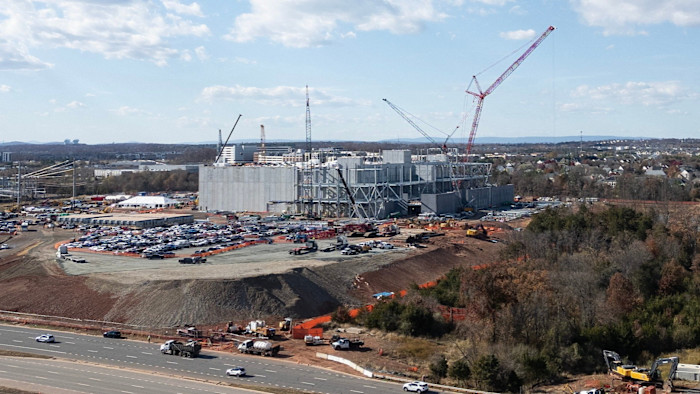
Housebuilding in London’s private housing sector has fallen by 84% since 2015, despite the capital needing 88,000 new homes annually, a new study has found.
New research from consultants Molior found construction work began on 5,547 new private-sector residential homes in 2025, compared with 33,782 in 2015.
Lord Bailey, a member of the London Assembly, said London’s housing situation had gone from “difficult to devastating” and “ordinary Londoners are suffering the most”.
A spokesperson for the Mayor of London said: “Tackling our urgent housing crisis is a top priority” and “Sadiq is doing everything he can to deliver more homes of all tenures”.
‘A collapse in housebuilding’
Bailey told the Local Democracy Reporting Service (LDRS): “This is not just a housing crisis anymore, it is a crisis of stability, opportunity and dignity.”
“I warned years ago that the mayor’s approach would lead to a collapse in housebuilding. Sadly, that is exactly what has happened.”
Some 18,326 homes are expected to be completed in London by the end of this year, amounting to around half of the homes currently under construction.
A further 14,053 homes are not expected to be completed until 2027 or later, which represents just 8% of the government’s 176,000-home, two-year target for London.
This is a shortfall of 92%.
Construction work has also been halted on 5,009 homes across 51 development sites in the capital.
Molior suggests this may be due to building contractors “going bust” because of high construction costs or putting the work on hold deliberately due to a weak sales market.
The firm added just 8,436 new homes were sold in London during 2025, which it described as “directly contributing to fewer construction starts”.
To meet government targets, at least 22,000 homes would need to be sold each quarter.

 PA Media
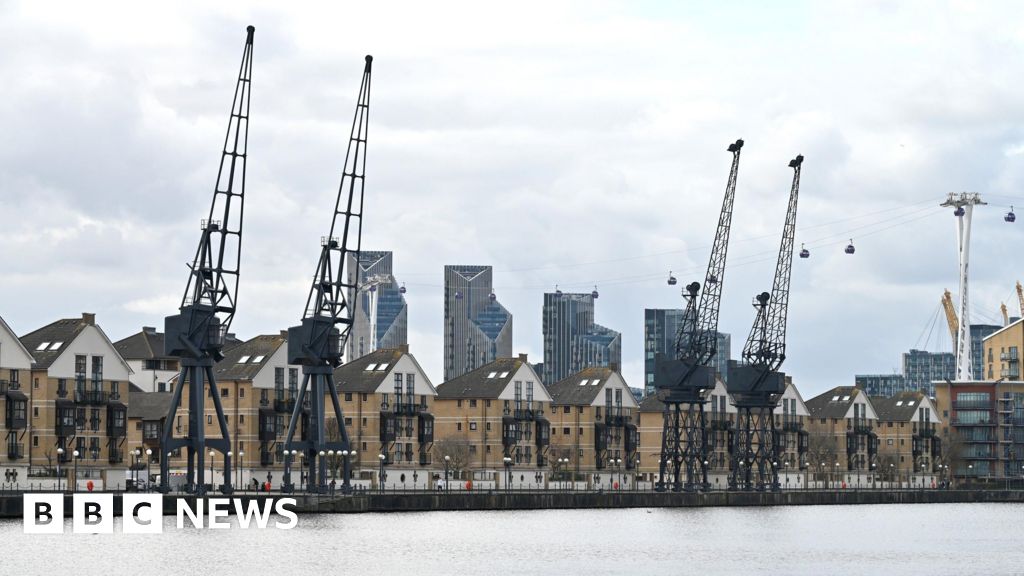
A spokesperson for the Mayor of London added: “This year, we are encouraging housing providers to bid for a record £11.7bn of government investment through the Mayor’s Affordable Homes Programme, to deliver social and affordable housing across London.
“It will work alongside the launch of a new City Hall Developer Investment Fund, backed by an initial £322m, to support large-scale projects in London.
“The government has also confirmed its support for plans to extend the Docklands Light Railway to Thamesmead, which will help unlock up to 30,000 new homes for Londoners across both sides of the river.”
Khan said housebuilding has been affected by the “disastrous legacy of the previous government, high interest rates, the rising cost of construction materials, the impact of the pandemic and Brexit, and Building Safety Regulator delays”.
Lord Bailey added: “It is time for the mayor to take responsibility. His policies have stifled development, slowed delivery, and left Londoners paying the price through rising rents, soaring house prices, and the painful reality of being priced out of the city they call home.”