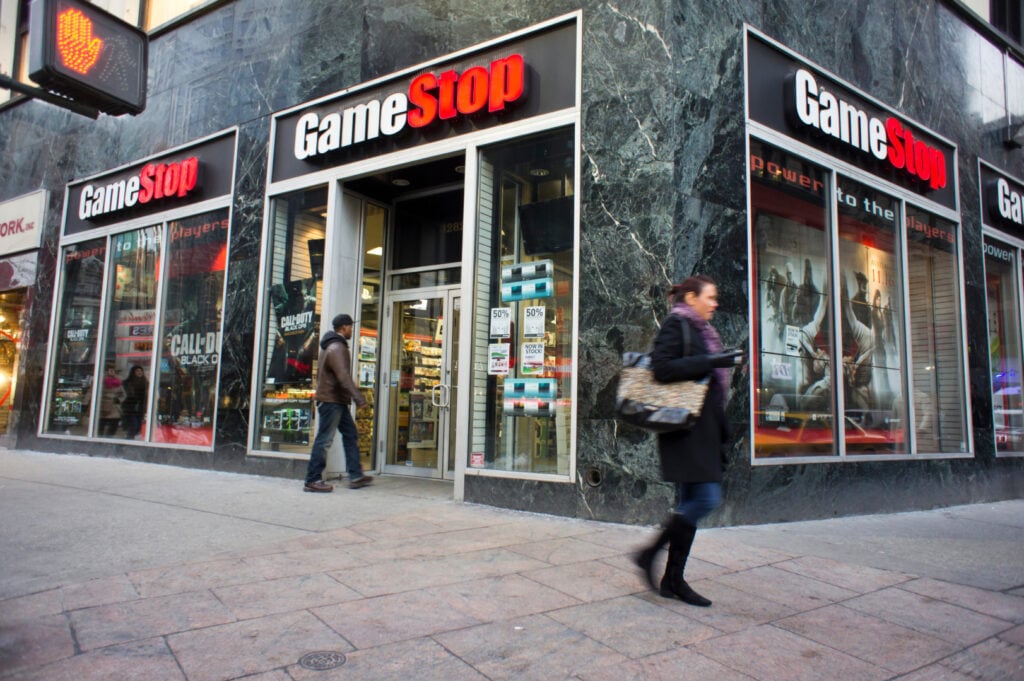
GameStop Corp. (NYSE:GME) was in the spotlight this week for two reasons: a literal infinite money glitch found within its own stores and massive insider buys from CEO Ryan Cohen.
YouTuber RJCmedia exposed a trade-in loophole involving the newly released Nintendo Switch 2 that allowed customers to essentially print store credit.
The exploit was remarkably simple: a customer would purchase a new Nintendo Switch 2 for $414.99. By immediately trading the console back in alongside the purchase of a cheap pre-owned game, a promotional multiplier was triggered.
The errant promotion increased the trade-in value of the console to $472.50, netting the user roughly $57 in profit per cycle.
Don’t Miss:
GameStop quickly issued a statement on X confirming the glitch was real, but has since been patched.
“Our system briefly valued the pre-owned trade more than the new retail cost… we gently remind everyone that our stores are not designed to function as infinite money printers,” the company said.
GAMESTOP ISSUES STATEMENT ON INFINITE MONEY GLITCH
GameStop is aware of the “GameStop Infinite Money Glitch,” exposed by YouTuber RJCmedia.
By purchasing a Nintendo Switch 2 for $414.99 and then immediately trading it back in along with the purchase of a pre-owned game, a… pic.twitter.com/F2D2v41IeQ
While retail hackers were busy farming store credit, GameStop CEO Ryan Cohen was busy buying shares.
SEC filings revealed that Cohen purchased 1 million shares of GME this week—500,000 on Tuesday and another 500,000 on Wednesday—at an average price of roughly $21.40.
See Also: This Real Estate Fund Pays 10x More Than the Average Savings Account – Invest From Just $100
Cohen’s latest $21 million personal investment in GameStop brings his total stake to approximately 9.3% (42.1 million shares).
The move has electrified investor sentiment, sending the stock up 10% for the week.
Thursday also marks exactly one year since Keith Gill, better known as “Roaring Kitty,” last posted on social media. The anniversary is fueling nostalgia-driven chatter on social media Thursday.
Between the viral nature of the trade-in money glitch, Cohen’s high-conviction buying and speculation around Roaring Kitty, GameStop is proving yet again that it remains the king of the meme stock world.
Track your investments for FREE with Simply Wall St, the portfolio command center trusted by over 7 million individual investors worldwide.
Kinnevik (OM:KINV B) has drawn fresh attention after investing €20m in hospitality software provider Mews and US$100m in digital health company Oviva, and has taken leading shareholder positions in both AI-focused platforms.
See our latest analysis for Kinnevik.
These new positions in Mews and Oviva come as Kinnevik’s share price sits at SEK76.18, with a 7 day share price return of 9.37% decline and a year to date share price return of 7.12% decline. The 5 year total shareholder return of 63.08% decline points to longer term pressure and suggests recent interest around its AI and digital health exposure is yet to translate into a sustained recovery.
If Kinnevik’s push into AI driven platforms has caught your eye, it could be worth broadening your search across high growth tech and AI stocks for more potential ideas in the space.
With Kinnevik’s shares down over 60% on a 5 year view and recent AI and digital health deals back in focus, investors may be asking whether this represents a reset entry point or whether the market is already pricing in future growth.
At a last close of SEK76.18 versus a most-followed fair value of about SEK101.33, Kinnevik is framed as materially mispriced by this narrative.
Accelerating adoption of AI powered software across hospitality, travel, health care and fintech is driving step changes in automation, personalization and decision quality in portfolio companies like Mews, TravelPerk and Spring Health, which should support sustained high revenue growth and structurally higher gross margins over time.
Read the complete narrative.
Curious how this AI push translates into the SEK101 valuation anchor? Revenue expansion, margin shifts and future earnings power all sit at the core of this story. The projections are bold, but tightly modelled around a very specific earnings profile and end point multiples. Want to see which assumptions really move the fair value needle here?
Result: Fair Value of SEK101.33 (UNDERVALUED)
Have a read of the narrative in full and understand what’s behind the forecasts.
However, those bold earnings assumptions rely on healthier software valuations, as well as smooth execution at key AI and digital health holdings, with currency swings also capable of distorting reported progress.
Find out about the key risks to this Kinnevik narrative.
If you see the story differently or prefer to weigh the numbers yourself, you can build a custom Kinnevik view in just a few minutes, starting with Do it your way.
A great starting point for your Kinnevik research is our analysis highlighting 3 key rewards and 1 important warning sign that could impact your investment decision.
If Kinnevik has you rethinking your watchlist, do not stop there. Use the Simply Wall St Screener to uncover more focused opportunities in minutes.
This article by Simply Wall St is general in nature. We provide commentary based on historical data and analyst forecasts only using an unbiased methodology and our articles are not intended to be financial advice. It does not constitute a recommendation to buy or sell any stock, and does not take account of your objectives, or your financial situation. We aim to bring you long-term focused analysis driven by fundamental data. Note that our analysis may not factor in the latest price-sensitive company announcements or qualitative material. Simply Wall St has no position in any stocks mentioned.
Companies discussed in this article include KINV-B.ST.
Have feedback on this article? Concerned about the content? Get in touch with us directly. Alternatively, email editorial-team@simplywallst.com
This weekend, it’s predicted that much of the US will experience severe winter storms. Piles of snow and below-freezing temperatures could last for much for the week.
It’s recommended to stay indoors (perhaps under a fluffy blanket while finally finishing the ambitious jigsaw puzzle you started over the holidays). And if you must venture into the treacherous weather, wearing proper gear is a must.
Below, we’ve shared our ultimate guide to winter gear: tools for power outages, cozy activities for home and picks for the warmest clothing you can wear all winter long. Our recommendations come from experts based in chilly spots across the US and around the world.
Our top six winter essentials at a glance
$399 at Back Country$39.95 at Ignik$78 at Malina$65.99 at Wayfair$31.94 at Gamers Guild $799 at Amazon
Our picks for hibernating at home
Photograph: Courtesy of Lowes
Jackery Explorer 2000 v2 Portable Power Station
$799 at Amazon$799 at Jackery
Tech writer Alan Truly lost power for three days when Hurricane Fiona tore through Nova Scotia in 2022. He and his wife had to cook on a camp stove and ration phone use the whole time. “The moment power returned, I knew I needed a better solution for the next outage,” he wrote. He now relies on the compact but powerful Jackery Explorer 2000 v2 to charge electronics and cooking appliances such as an Instant Pot, electric kettle or induction burner.
Twing 1000W Car Power Inverter
Photograph: Courtesy of Amazon$74.99 at Amazon
“It’s impossible to predict how many batteries you need in a multiday power outage. Fortunately, I have a massive amount of energy sitting in my driveway: my Toyota Prius C. With the Twing 1000W car inverter, the car can act as a power source, charging a MacBook, iPad, iPhone and Pixel at the same time, or even refill smaller battery packs. I turn on the car, connect the inverter, and have power that lasts long after the sun goes down.” – Alan Truly, tech writer
Bedsure Gentlesoft Bubble Faux Fur Blanket
Photograph: Courtesy of Wayfair$65.99 at Wayfair$79.99 at Bedsure
The Lola blanket is a faux-fur throw that promises “life-changing softness” but costs $275. Our home expert Jon Chan found a dupe made from the exact same materials for $66. “The Bedsure is just as soft and warm, while costing less than half and measuring about 10in longer,” he reports. Cozy up in one while flipping through a novel that’s been languishing on your to-read list.
Bomb Busters Board Game
Photograph: Courtesy of Amazon$31.94 at Gamers Guild $38.93 at Amazon
Snowed in? This is the most popular family board game among our readers. When our board games writer Nicole Lee asked experts for the best family board games, “one game kept getting recommended by our experts more than any other,” she wrote. “And that was Bomb Busters.” As one expert put it: “You’re going against villains, trying to save the world from people that want to blow it up. It’s a lot of fun.”
1,000-Piece Ravensburger Jigsaw Puzzle
Photograph: Courtesy of Stewart and Gibson$18.74 at Ravensburg $18.74 at Amazon
We tested 80 puzzles to find the absolute best indoor activity for a snowy afternoon: Ravensburger’s 1,000-piece jigsaw puzzles. “After more than a century of producing puzzles, Germany’s Ravensburger has built a reputation for being among the best brands out there,” our resident jigsaw enthusiast Tim Stevens said.
Our picks for ultra-warm winter coats
Photograph: Aritzia
Aritzia Super Puff
$250 at Aritzia
I depend on my Aritzia Super Puff to keep me warm on my frigid walk to the office. I credit this coat (that I fully acknowledge lives up to its name, making me look like a marshmallow) with helping me bear the last three winters. Its 800+ premium down keeps me warm, and I love that it’s both wind- and water-resistant. – Lauren Gould, editorial coordinator at the Filter US
Lululemon Wunder Puff 600-Down-Fill Long Jacket
Photograph: Courtesy of Lululemon$448 at Lululemon
I call this Lululemon puffer my “sleeping bag” coat because it looks like one, but it’s also so soft and warm I could sleep in it. I’ve worn it for six winters, through which it’s stayed waterproof, wind-repellent and roomy enough for a thick sweater (and more layers) underneath. It’s freezing in New York City right now, but this coat has kept me toasty. – Karen Yuan, commissioning editor at the Filter US
Venustas Heated Jacket
Photograph: Courtesy of Venustas
Women’s
$189.99 at Venustas
Men’s
$189.99 at Venustas
When we asked writers around the world for their essential winter coats, Mongolia-based Breanna Wilson recommended her Venustas heated jacket, which she’s worn traveling with nomadic herders in the frigid countryside. “Thanks to the jacket’s heating zones in the chest, shoulders and pockets, my core stays warm,” she wrote.
Rains Long Puffer Jacket
Photograph: Courtesy of Rains
Men’s
$550 at Rains
Women’s
$550 at Rains
“It’s like wearing a duvet,” an engineer in Stockholm told writer Jonna Dagliden Hunt about her black long puffer, a staple in many Swedes’ wardrobes. “It’s also great for wearing with a skirt underneath – or the opposite: sweatpants for a grocery run, and no one will notice.”
Patagonia Down Drift Parka
Photograph: Courtesy of Patagonia$399 at Back Country$399 at Patagonia
“I can tolerate a lot of cold things, but not a cold bum,” wrote Alaska-based journalist Julia O’Malley. She recommended her thigh-length Patagonia Downdrift Women’s Parka, which is extra warm thanks to 600-fill-power recycled down.
Our picks for durable winter boots
Photograph: Courtesy of Red Wing Shoes
Red Wing Classic Moc
$309.95 at Tip Top Shoes$319.99 at Red Wing Heritage
In 2019, I pulled the trigger on a pair of limited edition Red Wing boots to traverse filthy salt-covered sidewalks and lingering ice patches – and I learned they’re suited to just about any weather condition. The sturdy soles provide much-needed stability, and the leather repels whatever wintry mix is falling from the sky. They also play nicely with about 80% of my wardrobe. Seven years and hundreds of wears later, I can confidently say they’re one of the best purchases I’ve ever made. My exact pair has limited availability, but this style comes pretty close. – Ruth Baron, senior editor, US newsletters
Danner Explorer boots
Photograph: Courtesy of Danner$439.95 at Dodds Shoe Co. $465.99 at The Western Company
“I made those boots!” a total stranger once told me at a party, shortly after I bought these Portland-made Danner Explorers. Buying local has never felt more personal. The lugged Vibram sole laughs at snow and ice, and the full-grain leather upper is borderline indestructible. While they’re pricey, after 16 years and counting, I’d say they’ve earned their keep. The Gore-Tex liner doesn’t quite lock out water like it used to, but a once-a-year coat of Sno Seal keeps them serviceable. – Nick Mokey, editor at the Filter US
Steger Mukluk North Country Boots
Photograph: Courtesy of Steger Mukluks$249.95 at Steger Mukluks
After years of searching for boots that kept her feet completely warm, Alaska-based O’Malley found the Steger Mukluk. “They keep my feet toasty – whether I’m riding on a snowmobile, slipping bare feet in them for a short drive to a hot yoga class or even on assignment in the Arctic,” she wrote. Handmade in Ely, Minnesota, they’re crafted with leather, canvas and thick wool felt.
Polyver Winter Boots
Photograph: Courtesy of Bobleisure$196.95 at BobLeisure
In Stockholm, winters can range from 50F to 5F, with anything from slush to three feet of snow. Many of its residents wear the waterproof Polyver boots. “I can’t have a separate pair of shoes for every type of weather – ideally, I want one pair that works across the board,” a teacher told Dagliden Hunt. “Polyver boots have that dressing-gown or pyjamas feel – you just slip them on and head out.”
Sorel Waterproof Slip-On Boots
Photograph: Courtesy of Zappos$120 at Free People $120 at Zappos
Reporting from Kuopio, Finland, journalist Paula Hotti recommends these thick-soled Sorel boots that she loves “for their stylish green and pink color combination”.
Our picks to stay warm and stylish
Photograph: Courtesy of Nordstrom
Alex Mill Nottinghill Sweater
$198 at Shopbop$198 at Nordstrom
Tell me you’re an elder millennial living in Brooklyn without telling me you’re an elder millennial living in Brooklyn: yeah, I did buy myself an on-sale Alex Mill Nottinghill sweater on Black Friday. It’s a perfect uniform when I need to look presentable but absolutely do not want to leave the house. A birthday party on a frozen Saturday night? Perfect. The office when I’m running late? Yes. Meeting a friend at an overpriced wine bar? Throw it on! I have tried to limit myself to wearing it no more than twice per week, and I have not been successful yet. – Ruth Baron, senior editor, US newsletters
Aritzia knit pants
Photograph: Courtesy of Aritzia$110 at Aritzia
I’m a sucker for a wide-leg pair of pants, and these knit ones from Aritzia have lasted me through the past four winters. Made with a double-layer structure, soft yarn and an added elastic waistband, these pants are warm and comfy without sacrificing style. They’re versatile enough to pair with my Salomon shoes for a gorp-core look or loafers for a dressed-up office outfit. And bonus: they’re stretchy enough to layer a pair of tights or leggings underneath for added warmth. – Lauren Gould, editorial coordinator at the Filter US
Sezane Gaspard Cardigan
Photograph: Courtesy of Sezane$120 at Sezane
Recently, I’ve been on a mission to up my office outfit game. For a fun pop of color, I adore this red knit cardigan from cool-girl-approved French brand Sezane. Made with Mohair and Alpaca, it keeps me warm, while its pearl buttons add an elegant touch. And if you’re a chronic outfit repeater like me, it’s also reversible, doubling as a chic boat neck sweater. – Lauren Gould
Aritzia polar tech fleece
Photograph: Courtesy of Aritzia$138 at Aritzia
This thermal hoodie has gotten me through chilly hikes in Peru and winter runs. It keeps me warm, and its fleece material elevates it beyond your average hoodie. I love pairing this with my Free People barrel jeans for an elevated sporty look. – Lauren Gould
Gobi cashmere organic sweater
Photograph: Courtesy Photo$159 at Gobi
While cashmere is an investment, Mongolian resident and travel journalist Breanna Wilson swears by this sweater from Gobi for keeping warm. “When temperatures are about -13F outside, only the best garments are going to cut it.”
Our picks for something warmer than a scarf
Smartwool Merino Neck Gaiter
Photograph: Courtesy of Smartwool$32 at Amazon$35 at Smartwool
When temps drop below 30F (-1C), you won’t find me running, biking or even walking the dog without this thing. You can push it down over your chin to keep the wind at bay, or hike it up over your nose, mouth and ears in extreme cold. I’ve owned several varieties, and it’s worth spending extra for soft, breathable merino wool to avoid the clammy feeling you’ll get from synthetic versions. – Nick Mokey, editor at the Filter US
Inner and outer winter glove combo
Photograph: Courtesy of McGuire Army Navy
M Mcguire Gear Wool Nylon Blend Glove Inserts
$9.99 at Mcguire Army Navy $12.99 at Amazon Photograph: Courtesy Photo
ATG MaxiFlex Ultimate Work Gloves
$7.97 per pair at Home Depot $17.95 for a pack of three at Amazon
This inexpensive duo of winter gloves warms your hands as well as one bulky pair does, but they’re much easier to move your hands in. While they aren’t a substitute for a thicker pair of mittens, they’re perfect for when the weather warms up a bit. – Nick Mokey, Editor at The Filter US
Athleta running gloves
Photograph: Courtesy of Athleta$27.99 at Athleta
A pair of well-constructed gloves is an absolute essential for my winter runs. I love this pair from Athleta, which shields my fingers from the cold without feeling too thick or bulky. I wear these for more than just runs, and love that this pair comes with touchscreen-enabled fingertips and gripping dots – which makes them suitable for climbing or hiking too. – Lauren Gould
Ignik compostable foot warmers
Photograph: Courtesy of Ignik$39.95 at Ignik$39.95 at Amazon
Breanna Wilson credits these eco-friendly footwarmers for keeping her feet toasty during a nine-day dog-sledding trip across Mongolia. These are also reusable, coming with an AiBarrier pouch to preserve any leftover heat.
Malina balaclava
Photograph: Courtesy of Malina$78 at Malina
A balaclava is the hat and scarf combo’s fashionable counterpart. This one from Malina is made from an alpaca blend and is loved by one Scandinavian resident for keeping her face warm without sacrificing style.
Make better investment decisions with Simply Wall St’s easy, visual tools that give you a competitive edge.
Interparfums (IPAR) just reported its fourth quarter and full year 2025 sales, with net sales of US$386 million for the quarter and US$1.489 billion for the year, both above prior year levels.
Management also highlighted 9% fourth quarter sales growth in European based operations, supported by brands such as Coach, Lacoste, and Montblanc, which helps explain the recent share price reaction and renewed attention on the stock.
See our latest analysis for Interparfums.
The recent sales update has coincided with a sharp pickup in momentum, with a 7 day share price return of 9.82% and a 30 day share price return of 15.82%. This comes even though the 1 year total shareholder return is a 27.84% decline and the 3 year total shareholder return is a 6.08% decline, while the 5 year total shareholder return remains a 77.29% gain.
If this kind of rebound catches your eye, it may be worth widening the lens to other fragrance and beauty peers by scanning stable growth stocks screener (None results).
With Interparfums trading at US$98.76, some models suggest the shares sit at a sizable intrinsic discount, while recent sales strength and analyst optimism raise a simple question for you: is this a buying opportunity or is future growth already priced in?
Interparfums’ most followed narrative pegs fair value at about $103.60 per share, slightly above the recent $98.76 close. This frames the current debate around upside potential versus execution risk.
Interparfums is significantly expanding its e-commerce and digital marketing capabilities, including targeted programs for channels like Amazon and TikTok. This positions the company to capture incremental market share and drive international sales by engaging directly with global consumers, which may affect revenue and margin trends due to increased reach and potentially higher-margin channels.
Read the complete narrative.
Curious what kind of revenue lift and margin profile this story is built on? The narrative leans on measured growth assumptions and a higher future earnings multiple. The full picture connects those forecasts to a specific fair value path for Interparfums.
Result: Fair Value of $103.60 (UNDERVALUED)
Have a read of the narrative in full and understand what’s behind the forecasts.
However, this story can change quickly if key fragrance licenses underperform or are not renewed, or if retailer destocking and weaker orders affect reported sales.
Find out about the key risks to this Interparfums narrative.
If you see the numbers differently or prefer to run your own assumptions, you can build a custom view of Interparfums in just a few minutes, Do it your way.
A great starting point for your Interparfums research is our analysis highlighting 3 key rewards and 1 important warning sign that could impact your investment decision.
If you stop at one company, you risk missing opportunities that better fit your style, so broaden your watchlist and let the numbers work for you.
This article by Simply Wall St is general in nature. We provide commentary based on historical data and analyst forecasts only using an unbiased methodology and our articles are not intended to be financial advice. It does not constitute a recommendation to buy or sell any stock, and does not take account of your objectives, or your financial situation. We aim to bring you long-term focused analysis driven by fundamental data. Note that our analysis may not factor in the latest price-sensitive company announcements or qualitative material. Simply Wall St has no position in any stocks mentioned.
Companies discussed in this article include IPAR.
Have feedback on this article? Concerned about the content? Get in touch with us directly. Alternatively, email editorial-team@simplywallst.com
Track your investments for FREE with Simply Wall St, the portfolio command center trusted by over 7 million individual investors worldwide.
With no single headline event driving attention today, Industrial and Commercial Bank of China (SEHK:1398) is drawing interest as investors reassess its recent share performance and core banking fundamentals.
See our latest analysis for Industrial and Commercial Bank of China.
Short term share price momentum has cooled, with a 7 day share price return of 3.15% and a year to date share price return of 3.00%. However, the 1 year total shareholder return of 23.62% and 5 year total shareholder return of 82.41% show that longer term investors have so far been rewarded.
If ICBC has you thinking about where else value and income might be hiding in financials, it could be a good time to scan other solid balance sheet and fundamentals stocks screener (None results) for comparison.
ICBC currently trades at HK$6.15. Some models suggest a meaningful intrinsic discount and analysts’ targets sit higher, so the real question for you is whether this is genuine value or if the market already expects stronger growth.
With ICBC last closing at HK$6.15 and the most followed narrative pointing to a fair value of about HK$7.26, the gap between price and narrative value is front and center for investors weighing the story against the screen.
Diversification into technology finance, green finance (green loans up 16.4%), and inclusive finance (up 17.3%) is creating new long-term growth engines, reducing dependency on traditional lending, and supporting stable or growing earnings despite sectoral headwinds.
Read the complete narrative.
Curious what sits behind that growth engine claim? Revenue, earnings and future valuation multiples are all wired into this story. The assumptions are bolder than they look at first glance.
Result: Fair Value of HK$7.26 (UNDERVALUED)
Have a read of the narrative in full and understand what’s behind the forecasts.
However, the story could change quickly if profit margins stay under pressure or if policy driven lending keeps capital tied up in lower returning activities.
Find out about the key risks to this Industrial and Commercial Bank of China narrative.
If this narrative does not quite match your view, you can dig into the numbers yourself, test your own assumptions and Do it your way in just a few minutes.
A good starting point is our analysis highlighting 5 key rewards investors are optimistic about regarding Industrial and Commercial Bank of China.
If you stop at just one stock, you risk missing opportunities that could fit your style even better. Keep your watchlist open and your options wide.
This article by Simply Wall St is general in nature. We provide commentary based on historical data and analyst forecasts only using an unbiased methodology and our articles are not intended to be financial advice. It does not constitute a recommendation to buy or sell any stock, and does not take account of your objectives, or your financial situation. We aim to bring you long-term focused analysis driven by fundamental data. Note that our analysis may not factor in the latest price-sensitive company announcements or qualitative material. Simply Wall St has no position in any stocks mentioned.
Companies discussed in this article include 1398.HK.
Have feedback on this article? Concerned about the content? Get in touch with us directly. Alternatively, email editorial-team@simplywallst.com
High Tide Inc. recently filed a Form 6-K detailing new Voting Support and Standstill Agreements, formalizing arrangements that may shape its future governance structure.
At the same time, the company is pushing a multi-channel cannabis retail approach across bricks-and-mortar and global e-commerce, aiming to deepen its presence in cannabis culture niches.
We’ll now explore how these governance agreements and High Tide’s multi-channel cannabis retail ambitions could influence its broader investment narrative.
These 9 companies survived and thrived after COVID and have the right ingredients to survive Trump’s tariffs. Discover why before your portfolio feels the trade war pinch.
To own High Tide, you have to buy into a multi-channel cannabis retailer that is still unprofitable yet growing its CA$568.25 million revenue base, rolling out Canna Cabana stores and e-commerce while trying to stay lean enough to eventually turn a profit. Short-term, the big swing factors remain sector sentiment around cannabis regulation, how efficiently the company integrates new locations in Canada and Germany, and what shows up in the upcoming Q4 2025 results on January 29. The new Voting Support and Standstill Agreements look more like a governance clean-up than a near-term earnings catalyst, and the muted share price reaction over the past month suggests the market sees them the same way. They may matter over time if they stabilize control, but they do not remove the key risks around regulation, ongoing losses and balance sheet pressure. However, one governance-related risk here is easy to miss at first glance.
High Tide’s share price has been on the slide but might be up to 16% below fair value. Find out if it’s a bargain.
TSXV:HITI 1-Year Stock Price Chart
The Simply Wall St Community’s 12 fair value estimates for High Tide span roughly CA$3.01 to CA$26.39, showing just how far apart views can be. Set that against a company that is still loss making and dependent on sector regulations for its growth plans, and it is clear you are weighing very different possible futures. It is worth seeing how other private investors frame those trade offs before deciding where you stand.
Explore 12 other fair value estimates on High Tide – why the stock might be worth 14% less than the current price!
Disagree with this assessment? Create your own narrative in under 3 minutes – extraordinary investment returns rarely come from following the herd.
A great starting point for your High Tide research is our analysis highlighting 4 key rewards that could impact your investment decision.
Our free High Tide research report provides a comprehensive fundamental analysis summarized in a single visual – the Snowflake – making it easy to evaluate High Tide’s overall financial health at a glance.
Our daily scans reveal stocks with breakout potential. Don’t miss this chance:
This article by Simply Wall St is general in nature. We provide commentary based on historical data and analyst forecasts only using an unbiased methodology and our articles are not intended to be financial advice. It does not constitute a recommendation to buy or sell any stock, and does not take account of your objectives, or your financial situation. We aim to bring you long-term focused analysis driven by fundamental data. Note that our analysis may not factor in the latest price-sensitive company announcements or qualitative material. Simply Wall St has no position in any stocks mentioned.
Companies discussed in this article include HITI.V.
Have feedback on this article? Concerned about the content? Get in touch with us directly. Alternatively, email editorial-team@simplywallst.com
(Bloomberg) — Months of mild weather lulled US and European gas traders into believing winter would bring more of the same — not the brutal freeze gripping much of America.
Their bad bet is now reverberating around the world.
Most Read from Bloomberg
Futures prices for natural gas — fuel for home furnaces and power plants alike — jumped 70% in the US over a wild week of trading, as forecasts for deep cold grew steadily worse. The previous week, prices rose 30% in Europe, where a cold snap combined with geopolitical jitters to drive up the market. Before the sudden surge, many traders on both sides of the Atlantic had been betting prices would fall instead.
Nor is it certain that the worst of the run-up is over.
Temperatures in gas-producing parts of the US could drop low enough in coming days to freeze pipelines — potentially choking off supplies just as demand for the fuel soars. While the main futures market is closed over the weekend, some spot trading will continue. With that in mind, one trading team planned to spend Saturday and Sunday at a downtown Houston hotel to ensure backup power generation — and a stable internet connection to the Intercontinental Exchange trading platform — should blackouts sweep the region.
“Everyone’s in panic mode right now,” said Paul Phillips, senior strategist for Uplift Energy Strategy, a Denver, Colorado-based gas trading firm. “People were writing off winter last week.”
The price spike — the most abrupt weekly increase on record in the US — illustrates just how integrated the country has become into the global gas market. America’s emergence in recent years as the leading gas exporter means much of the world is now reliant on US supplies, making price volatility at home an international story. Indeed, cold weather in Texas and other gas-producing states has helped drive prices so high that many smaller buyers in Asia may no longer be able to pay, with liquefied natural gas tankers likely sailing to Europe instead.
While winter triggered the spike, it was far from the only cause.
Many gas traders started January expecting prices to drop, based on ample supplies. Then cold weather in Europe started driving up demand, while protests in Iran and US President Donald Trump’s talk of seizing Greenland raised the geopolitical risk to energy markets. Gas prices began to rise, prompting a frantic scramble among European traders to cover their short positions. Their frenzied buying accelerated the rally.
“This was a case of markets overextending in terms of positioning,” said Udayan Bhattacharya, chief trader at Global Risk Management, a Copenhagen company that advises clients on energy price hedging. Combine those positions with some bad weather and political tension, he said, and “you get a violent, short covering situation like we saw the last few days.”
A similar “short squeeze” played out this week in the US, as the weather forecast worsened and threatened gas supplies. Just five years ago, a deep freeze knocked out pipelines and power plants in Texas, triggering days of blackouts and leaving more than 200 people dead. And the fuel has only grown more essential — to both the US and the world — since then.
Photographer: Ron Jenkins/Getty Images
Gas has displaced coal as the main fuel of US power plants over the past decade, due both to its cheap cost and low pollution. At the same time, the country has become the world’s leading liquefied natural gas exporter, as fracking unlocked massive shale reserves. US LNG production has more than doubled since 2021, with eight export plants operating along the Gulf Coast and two on the East Coast. In early January, US LNG plants processed a record amount of domestic gas, equivalent to about 18% of the country’s total gas production.
And yet, even as both supply and demand grew, the US built little new storage for the fuel, said Christopher Kalnin, CEO of BKV Corp., the largest gas producer in Texas’ Barnett Shale. That combination of tight storage and strong demand can trigger dramatic price spikes, he said.
“It’s like a heavier and heavier person jumping on a trampoline,” Kalnin said. “You’re going to get more and more volatility.”
One senior trader at a major US gas producer said that while the rally’s first day was exciting — higher prices mean more money for companies that produce and ship the fuel — the thrill turned to apprehension as prices continued their relentless climb. Such high levels, with futures finishing the week at $5.275 per million BTU, can indicate extreme conditions that might prevent a seller from transporting gas to buyers. If buyers can’t receive the fuel, those massively profitable gas sales can be made worthless.
To top it all off, trading algorithms were betting on price declines in the US going into the week, according to data from Bridgeton Research Group. Only when gas futures started smashing through key price thresholds did those bot traders start buying back contracts at a loss, moving from 100% short at the start of the week to 45% net short on Thursday. Similarly, hedge funds were near their most bearish gas position in over a year, according to data from the Commodity Futures Trading Commission.
“The market had given up on winter until this week,” said Darrell Fletcher, managing director of commodities at Bannockburn Capital Markets. “Then it all changed very quickly.”
A further rally now depends on how long the US freeze will last — and how it impacts the country’s exports. Shipments have fallen during previous winter storms, most notably in February 2021. But if the impact is limited to several cargoes this time around, European prices could retreat soon, according to some traders.
Photographer: Mark Felix/Bloomberg
Although the market for LNG is global, not every country will feel the effects of the price spike equally.
China and Japan, the world’s two largest LNG buyers, were hit by frigid weather over the last few weeks. But both have strong inventories, shipments purchased under long-term contracts and alternative fuel choices, according to traders in Singapore. That could free up some spare LNG shipments to flow to Europe, restraining prices there.
But smaller players will be squeezed. Officials from Thailand’s state-owned gas importer, PTT PCL, decided to scrap a planned LNG purchase after tender offers came in far higher than expected, one of the traders said. Instead, they’re hoping prices fall by March, when Europe’s winter ends.
–With assistance from Elena Mazneva, Alberto Brambilla, Devika Krishna Kumar, Stephen Stapczynski and Sing Yee Ong.
The phase 3 ASCENT-04/KEYNOTE-D19 trial, published in The New England Journal of Medicine in January 2026, provides compelling evidence that combining the Trop-2–directed antibody–drug conjugate sacituzumab govitecan with the PD-1 inhibitor pembrolizumab significantly improves clinical outcomes in patients with previously untreated, PD-L1–positive, locally advanced unresectable or metastatic triple-negative breast cancer (TNBC). This study represents a pivotal step forward in first-line treatment for one of the most aggressive and therapeutically challenging breast cancer subtypes.
ASCENT-04
Triple-Negative Breast Cancer: Symptoms ,Causes, Types, Diagnosis and Treatment
Clinical Context: The Unmet Need in First-Line TNBC
Triple-negative breast cancer is characterized by the absence of estrogen receptor, progesterone receptor, and HER2 expression and is associated with early relapse, visceral metastases, and poor long-term survival. Although immune checkpoint inhibition combined with chemotherapy has become the standard first-line approach for PD-L1–positive metastatic TNBC, outcomes remain suboptimal, and nearly half of patients do not proceed beyond first-line therapy. Improving the depth and durability of response early in the disease course remains a major clinical priority.
Trial Design and Treatment Strategy
ASCENT-04/KEYNOTE-D19 was a randomized, open-label, international phase 3 trial conducted across 186 sites in 28 countries. A total of 443 patients with previously untreated advanced TNBC and PD-L1–positive tumors (combined positive score ≥10) were randomly assigned to receive either sacituzumab govitecan plus pembrolizumab or investigator’s choice chemotherapy plus pembrolizumab.
Sacituzumab govitecan was administered at 10 mg/kg on days 1 and 8 of a 21-day cycle, combined with pembrolizumab 200 mg every 3 weeks. The control arm consisted of standard chemotherapy regimens (taxane-based or gemcitabine–carboplatin) plus pembrolizumab. The primary end point was progression-free survival assessed by blinded independent central review.
Efficacy: Meaningful Improvement in Progression-Free Survival
The trial met its primary end point, demonstrating a statistically significant and clinically meaningful improvement in progression-free survival with sacituzumab govitecan plus pembrolizumab. Median progression-free survival was 11.2 months in the experimental arm compared with 7.8 months in the chemotherapy plus pembrolizumab arm, corresponding to a 35% reduction in the risk of disease progression or death.
This near-one-year median progression-free survival compares favorably with outcomes from prior pivotal trials of chemotherapy–immunotherapy combinations in this setting, where median progression-free survival has generally ranged between 7 and 10 months. Importantly, the progression-free survival benefit was consistent across predefined subgroups, including patients with aggressive disease features such as liver metastases and early relapse after curative-intent therapy.
Response Depth and Durability
Objective response rates were numerically higher with sacituzumab govitecan plus pembrolizumab (60%) than with chemotherapy plus pembrolizumab (53%). More notably, responses were substantially more durable. Among patients achieving a confirmed response, the median duration of response was 16.5 months in the sacituzumab-based arm, compared with 9.2 months in the chemotherapy arm.
These findings suggest that antibody–drug conjugate–based strategies may provide more sustained tumor control than conventional chemotherapy, even when initial response rates are similar. The durability of response is particularly relevant in metastatic TNBC, where early loss of disease control often limits long-term benefit.
Overall Survival
At the time of the primary analysis, overall survival data were immature, with approximately one quarter of patients having died. Median overall survival had not yet been reached in either treatment arm. Interpretation of future overall survival outcomes will need to account for the high rate of crossover to sacituzumab govitecan among patients initially assigned to chemotherapy plus pembrolizumab.
Safety and Treatment Tolerability
The safety profile of sacituzumab govitecan plus pembrolizumab was consistent with the known toxicities of each agent. Grade 3 or higher adverse events occurred at similar frequencies in both arms. However, treatment discontinuation due to adverse events was substantially lower in the sacituzumab-based arm (12%) compared with the chemotherapy arm (31%).
The most common adverse events with sacituzumab govitecan plus pembrolizumab included diarrhea, nausea, and neutropenia, while chemotherapy plus pembrolizumab was more frequently associated with anemia and thrombocytopenia. Importantly, immune-mediated adverse events were less frequent in the sacituzumab-based combination. These findings suggest that improved tolerability and lower discontinuation rates may allow patients to remain on effective therapy longer, potentially contributing to improved clinical benefit.
Biological and Therapeutic Implications
Sacituzumab govitecan delivers the topoisomerase I inhibitor SN-38 directly to Trop-2–expressing tumor cells through a hydrolyzable linker, enabling high intratumoral drug exposure. While sacituzumab govitecan is not considered intrinsically immunomodulatory, emerging evidence suggests that antibody–drug conjugates may enhance antitumor immune responses when combined with checkpoint inhibition, providing a biologic rationale for this combination.
The results of ASCENT-04/KEYNOTE-D19 support the concept of moving effective antibody–drug conjugates earlier in the treatment paradigm, not merely as salvage therapy but as foundational components of first-line treatment.
TRIPOLI, Jan. 24 (Xinhua) — Libyan Prime Minister Abdul-Hamid Dbeibah announced on Saturday the signing of an oil agreement with two foreign companies, with the investments exceeding 20 billion U.S. dollars.
In a post published on his official Facebook page, Dbeibah said that Libya signed a development agreement for a period of 25 years with TotalEnergies of France and the U.S. company ConocoPhillips.
He said that the agreement aims to increase the production capacity of the Libyan Waha Oil Company by up to 850,000 barrels per day, with net revenues expected to exceed 376 billion dollars for Libya.
Dbeibah also announced the signing of a memorandum of understanding with the U.S.-based Chevron, as well as a cooperation memorandum with Egypt’s Ministry of Petroleum and Mineral Resources, without providing further details.
The signing of the agreements and memoranda took place on the sidelines of the fourth edition of the Libya Energy & Economic Summit, which kicked off on Saturday in the capital Tripoli, with participation from international and Libyan companies.
Oil and gas exports are the primary source of income for Libya, though the sector has faced setbacks in recent years due to domestic conflicts and political instability. ■
Wall Street’s most overbought stocks this week include one precious metals company and a handful of names involved in the artificial intelligence infrastructure buildout. U.S. equities were on a wild ride this week as developments continued on the geopolitical front. Although stocks rallied Wednesday and Thursday after President Donald Trump backed off his threat to impose fresh tariffs on a slew of European countries, the S & P 500 closed the week in the red. Despite the index-level weakness, some individual stocks may be running too hot. CNBC Pro used its stock screener tool to identify the most overbought stocks on the Street after this week as measured by their 14-day relative strength index, or RSI. Stocks with a 14-day RSI above 70 are generally considered overbought, indicating that a pullback could be on the horizon. A reading below 30 indicates that a stock is oversold and could get a near-term bounce, meanwhile. The following table shows several overbought stocks from the week: Gold mining giant Newmont topped the list with a 14-day RSI of 82.3. Shares rose more than 8% this week as gold prices surged amid geopolitical unrest and expectations of another U.S. interest rate cut. Spot gold touched a record high on Friday, nearing $5,000 per ounce. Memory products makers Sandisk and Micron also made the overbought group after rallying 16.6% and 10.7%, respectively, on the week. Sandisk’s blowout performance comes after the research team at S3 Partners on Thursday warned of a mounting risk of a short squeeze in the stock. Shares have already doubled this year — and are up more than 1,200% over the past year — as demand for AI memory products has significantly outpaced supply. The stock has an RSI of 78.4, but remains a favored play in the market given the consensus buy rating from analysts covered by LSEG. Another popular AI play, chipmaker Advanced Micro Devices , is now considered overbought with an RSI of 76.9 after the stock’s nine-day win streak. Shares of AMD have jumped more than 11.5% this week. Only three names can be considered technically oversold. The downbeat sentiment on Netflix this week comes after the company on Tuesday reported fourth-quarter earnings that narrowly beat analysts’ estimates. Despite Friday’s boost, Netflix shares are down 2.8% on the week. The media giant has an RSI of about 26, which signals a potential rebound ahead.