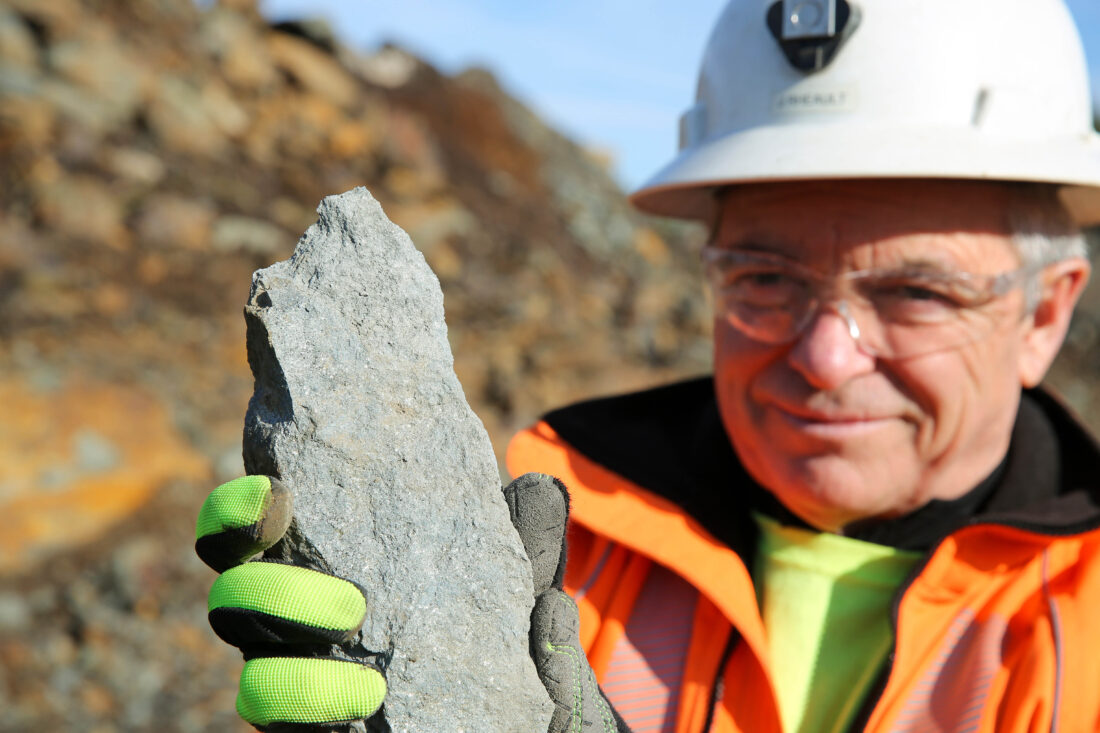
Category: 3. Business

  • Employer Liability in China: Subcontracting, Outsourcing, and Affiliations

    Employer Liability in China: Subcontracting, Outsourcing, and Affiliations

    Employer liability in China is expanding as new judicial interpretations clarify the risks associated with subcontracting, outsourcing, and affiliating arrangements involving unlicensed entities. This article unpacks Articles 1 and 2 of the SPC’s Judicial Interpretation II and outlines compliance measures foreign investors should adopt to avoid unexpected liabilities.


    On August 1, 2025, China’s Supreme People’s Court (SPC) released the long-awaited Judicial Interpretation II on the Application of Law in Labor Dispute Cases (Fa Shi [2025] No. 12, hereinafter “Judicial Interpretation II on Labor Disputes” or “Judicial Interpretation II”), along with a set of illustrative cases. Both will take effect on September 1, 2025. This new interpretation reflects the SPC’s ongoing effort to unify judicial standards and provide clearer guidance for handling labor disputes in an increasingly complex employment environment.

    Find Business Support

    Building on our previous article, which provides an overview, this article focuses on Articles 1 and 2 of the Judicial Interpretation II , which clarify employer liability when laborers are employed by unlicensed entities. These provisions assign responsibility to contractors or affiliated entities with legitimate business qualifications, making them accountable as de facto employers for laborers engaged by unlicensed subcontractors or affiliated parties. The Interpretation specifies the circumstances under which laborers can request courts to recognize the contractor or affiliated entity as the responsible employer, covering obligations such as wage payments, work-related injury insurance, and potentially other employment-related liabilities.

    For foreign investors, Articles 1 and 2 highlight the critical importance of due diligence when engaging local subcontractors or partners. Even when laborers are formally employed by a third party, failure to verify that the partner holds proper legal qualifications can expose the foreign enterprise to direct liability for wages, work-related injury insurance, and other employment obligations. These provisions emphasize that robust compliance, contract oversight, and proactive labor management are essential to mitigate legal risk and ensure smooth operations in China.

    Explore vital economic, geographic, and regulatory insights for business investors, managers, or expats to navigate China’s business landscape. Our Online Business Guides offer explainer articles, news, useful tools, and videos from on-the-ground advisors who contribute to the Doing Business in China knowledge.
    Start exploring

    What is stipulated in Articles 1 and 2?

    Article 1: Liability in subcontracting and outsourcing

    Article 1: Where a contractor with legal business qualifications subcontracts or assigns contracted business to an organization or individual without legal business qualifications, and the laborers employed by such organization or individual request confirmation that the contractor shall be the entity bearing the responsibility as the employer, and shall assume responsibilities such as payment of labor remuneration and work-related injury insurance benefits after the determination of work-related injury, the people’s court shall support such claims in accordance with the law.

    Article 1 addresses situations where a contractor with legal business qualifications subcontracts or outsources work to an entity without legal qualifications. In such cases, laborers employed by the unlicensed entity can request the court to recognize the original contractor as their de facto employer. Courts are instructed to uphold these claims, ensuring laborers receive statutory protections, including wages and work-related injury benefits.

    Subcontracting and outsourcing are common in industries such as construction, manufacturing, and professional services. In construction, subcontracting typically involves transferring the entire contracted project to another entity, whereas outsourcing refers to allocating specific portions of work. In manufacturing and professional services, outsourcing is often used for specialized tasks such as data analysis, translation, or component production.

    The Interpretation codifies principles previously reflected in regulations like Article 7 of the 2013 Ministry of Human Resources and Social Security guidelines on work injury insurance. What is new is the explicit judicial endorsement that contractors cannot evade employer responsibility when laborers are employed by unlicensed subcontractors. The Interpretation emphasizes the subcontractor’s “legal business qualification” as the threshold for liability, focusing on formal licensing and registration rather than mere operational activity.

    Article 2: Liability in affiliating arrangements

    Article 2: Where an organization or individual without legal business qualifications operates externally by affiliating with an entity with legal business qualifications, and the laborers employed by such organization or individual request confirmation that the affiliated entity shall be the entity bearing the responsibility as the employer, and shall assume responsibilities such as payment of labor remuneration and work-related injury insurance benefits after the determination of work-related injury, the people’s court shall support such claims in accordance with the law.

    Article 2 addresses cases where unlicensed entities or individuals operate by affiliating with a licensed entity, a practice commonly known as “affiliating” (挂靠). Laborers employed by the unlicensed party can hold the affiliated licensed entity accountable for employer obligations, including wages and work-related injury insurance. Courts are instructed to support these claims, reinforcing the principle that legal qualifications cannot be used as a shield to avoid liability.

    Affiliating arrangements are more common outside construction, occurring in sectors such as transportation, pharmaceuticals, and energy. Typically, an unlicensed individual or entity leverages the credentials of a licensed partner to bid for projects or operate legally. From a liability perspective, Article 2 ensures that the licensed entity cannot escape responsibilities by serving as a front for unlicensed operations.

    Scope and implications of employer responsibility

    Articles 1 and 2 establish that when laborers are hired by unqualified subcontractors or affiliated parties, responsibility may be shifted to the qualified contractor or affiliated enterprise. Specifically, Article 1 covers situations where a qualified contractor subcontracts or re-subcontracts work to an unqualified entity, while Article 2 applies when an unqualified entity operates under the name of a qualified enterprise. In both scenarios, if workers seek confirmation of their rights, such as wages or work-related injury benefits, the courts will hold the qualified enterprise responsible.

    While the term “employer responsibility” is not formally defined in existing laws, it is generally understood to cover protections for laborers who may not have a direct contractual relationship with the responsible entity. The Interpretation explicitly mentions wage payments and work injury insurance, and the addition of “etc.” suggests that other liabilities, such as social security contributions or reimbursement for occupational hazards, may also be included.

    Why is it relevant to foreign investors?

    For foreign-invested enterprises (FIEs), Articles 1 and 2 underscore the importance of carefully managing subcontracting, outsourcing, and affiliating arrangements in China. The rules serve as a reminder that employer responsibility may extend beyond a company’s direct contractual relationships, exposing FIEs to unexpected liabilities if compliance gaps exist in their supply or service chains.

    Key scenarios include:

    • Subcontracting: FIEs frequently subcontract specialized tasks or segments of a project to local firms, particularly in construction, manufacturing, and services. Under the Interpretation, subcontractors must hold valid business qualifications; if they do not, the FIE risks being deemed the responsible employer. This can mean assuming liability for unpaid wages, mandatory social insurance, and work-related injury compensation—obligations that could become significant financial and reputational risks.
    • Outsourcing and indirect subcontracting: Even when FIEs do not directly subcontract, indirect arrangements can still create exposure. For example, a foreign apparel brand may contract production to a qualified local factory, which then outsources portions of the order to smaller, unlicensed workshops. If labor disputes emerge at those workshops, courts may trace responsibility back through the chain and assign liability to the original contracting enterprise, including the FIE. This reflects the court’s intention to protect workers regardless of contractual distance.
    • Affiliating arrangements: Although less common, FIEs may become entangled in affiliating practices, where an unqualified party “borrows” the name or qualifications of a licensed enterprise to bid for or undertake projects. An FIE with proper qualifications might unknowingly—or negligently—enable such an arrangement through a local partner. If workers are employed under this setup, courts may hold the FIE responsible for employer obligations. This risk is particularly acute in industries like construction and engineering, where affiliating practices have historically been more prevalent.

    In short, the Interpretation raises the compliance bar for FIEs operating in China. It requires not only verifying counterparties’ qualifications but also exercising continuous oversight across subcontracting and outsourcing chains. Ignorance of lower-tier practices may no longer shield foreign investors from liability, making stronger due diligence, contractual safeguards, and compliance monitoring essential parts of risk management.

    Practical compliance measures

    Given these risks, FIEs should implement proactive compliance strategies that balance operational efficiency with legal risk management. Key measures include:

    • Qualification verification: Conduct thorough due diligence on subcontractors, assignees, and affiliated entities to confirm that they hold the necessary legal and business qualifications. This is the first line of defense against being held liable for unqualified partners.
    • Contractual safeguards: Strengthen contracts by clearly defining the scope of work, responsibilities, and compliance obligations. Agreements should expressly prohibit illegal subcontracting, outsourcing, or affiliating arrangements and include indemnification clauses to protect the FIE in case of labor disputes.
    • Labor oversight: Go beyond contractual terms by monitoring subcontractors’ labor practices, such as ensuring workers are formally employed, wages are paid on time, and social insurance contributions are made in full. Courts are increasingly willing to hold principals accountable if oversight is lacking.
    • Insurance coverage: Obtain comprehensive employer liability and project-specific insurance policies. These can provide an additional layer of protection against unforeseen labor claims and financial exposure.
    • Continuous legal review: Regularly update compliance programs and internal protocols to reflect the latest judicial interpretations and sector-specific regulations, ensuring that the company’s risk management remains aligned with evolving enforcement trends.

    Key takeaways

    Find Business Support

    Articles 1 and 2 of the Judicial Interpretation II provide clarity and legal certainty regarding employer liability in subcontracting, outsourcing, and affiliating arrangements. For courts, the Interpretation offers clear guidance to hold legally qualified contractors and affiliated entities accountable for laborers employed by unlicensed parties. For foreign enterprises operating in China, these provisions underscore the importance of rigorous partner vetting, structured contracts, and proactive labor management.

    Ultimately, the Interpretation strengthens labor protections while emphasizing accountability among legally recognized entities. For HR and legal practitioners, it signals a need for tighter oversight of partnerships, subcontracting arrangements, and any affiliation with unlicensed operators. Adopting robust compliance practices not only mitigates legal risks but also reinforces corporate social responsibility commitments, ensuring that labor rights are safeguarded even when operations involve complex subcontracting or affiliation chains.

    About Us

    China Briefing is one of five regional Asia Briefing publications, supported by Dezan Shira & Associates. For a complimentary subscription to China Briefing’s content products, please click here.

    Dezan Shira & Associates assists foreign investors into China and has done so since 1992 through offices in Beijing, Tianjin, Dalian, Qingdao, Shanghai, Hangzhou, Ningbo, Suzhou, Guangzhou, Haikou, Zhongshan, Shenzhen, and Hong Kong. We also have offices in Vietnam, Indonesia, Singapore, United States, Germany, Italy, India, and Dubai (UAE) and partner firms assisting foreign investors in The Philippines, Malaysia, Thailand, Bangladesh, and Australia. For assistance in China, please contact the firm at china@dezshira.com or visit our website at www.dezshira.com.


    Continue Reading

  • Production in construction down by 0.8% in the euro area and by 0.5% in the EU – Euro indicators

    Production in construction down by 0.8% in the euro area and by 0.5% in the EU – Euro indicators

    Overview

    In June 2025, compared with May 2025, seasonally adjusted production in construction decreased by 0.8% in the euro area and by 0.5% in the EU, according to first estimates from Eurostat, the statistical office of the European Union. In May 2025, production in construction fell by 2.1% in the euro area and by 1.9% in the EU.

    In June 2025, compared with June 2024, production in construction increased by 1.7% the euro area and by 1.9% in the EU.

    Monthly comparison by construction sector and by Member State

    In the euro area in June 2025, compared with May 2025, production in construction

    • decreased by 1.8% for construction of buildings,

    • increased by 0.5% for civil engineering,

    • decreased by 0.2% for specialised construction activities.

    In the EU, production in construction

    • decreased by 1.6% for construction of buildings,

    • decreased by 0.1% for civil engineering,

    • increased by 0.3% for specialised construction activities.

    Among Member States for which data are available, the largest monthly decreases in production in construction were recorded in Spain (-5.6%), Hungary (-5.3%) and Slovenia (-3.7%). The highest increases were observed in Slovakia (+5.3%), Romania (+4.5%) and Poland (+3.2%).

    Annual comparison by construction sector and by Member State

    In the euro area in June 2025, compared with June 2024, production in construction

    • increased by 3.3% for construction of buildings,

    • increased by 2.9% for civil engineering,

    • increased by 0.9% for specialised construction activities.

    In the EU, production in construction

    • increased by 3.9% for construction of buildings,

    • increased by 1.3% for civil engineering,

    • increased by 1.5% for specialised construction activities.

    Among Member States for which data are available, the highest annual increases in production in construction were recorded in Spain (+31.4%), Czechia (+14.0%) and Slovakia (+9.8%). Decreases were observed in France (-5.1%), Austria (-5.0%), Germany (-2.5%) and Sweden (-0.3%).

    Tables

    Production in construction

    % change compared with the previous month*

    Jan-25

    Feb-25

    Mar-25

    Apr-25

    May-25

    Jun-25

    0.7

    -1.2

    0.0

    4.5

    -2.1

    -0.8

    0.5

    -1.7

    0.7

    9.5

    -3.2

    -1.8

    -0.9

    -1.3

    2.6

    -0.4

    -0.5

    0.5

    0.8

    -1.0

    0.2

    0.5

    -0.9

    -0.2

    0.4

    -1.1

    -0.1

    3.8

    -1.9

    -0.5

    1.2

    -1.4

    0.2

    7.6

    -2.3

    -1.6

    -2.8

    -0.5

    1.4

    0.0

    -0.3

    -0.1

    0.8

    -0.9

    0.2

    0.4

    -0.9

    0.3

    Production in construction

    % change compared with the previous month*

    Jan-25

    Feb-25

    Mar-25

    Apr-25

    May-25

    Jun-25

    0.7

    -1.2

    0.0

    4.5

    -2.1

    -0.8

    0.4

    -1.1

    -0.1

    3.8

    -1.9

    -0.5

    1.6

    -1.3

    -0.9

    1.6

    -2.3

    0.5

    2.2

    -0.2

    1.8

    -0.7

    -1.6

    -0.2

    -1.6

    0.1

    3.6

    -4.8

    2.0

    2.6

    -0.6

    3.3

    -0.5

    0.2

    0.4

    -0.1

    2.6

    -3.7

    1.2

    0.0

    -3.0

    0.7

    :

    :

    :

    :

    :

    :

    c

    c

    c

    c

    c

    c

    :

    :

    :

    :

    :

    :

    -1.6

    2.1

    -0.8

    41.4

    -7.0

    -5.6

    -4.0

    0.4

    -0.4

    -0.5

    -0.4

    -0.4

    2.6

    -1.7

    0.2

    1.8

    0.1

    :

    4.7

    -1.1

    -0.6

    c

    c

    c

    :

    :

    :

    :

    :

    :

    :

    :

    :

    :

    :

    :

    :

    :

    :

    :

    :

    :

    -1.2

    0.3

    -1.0

    0.5

    -5.3

    :

    2.6

    -1.5

    -0.4

    7.9

    1.0

    -5.3

    :

    :

    :

    :

    :

    :

    1.5

    -1.4

    -1.4

    2.3

    -1.8

    -0.7

    0.5

    -1.8

    1.2

    -1.8

    -0.3

    -2.1

    -0.6

    -3.2

    -3.9

    -0.9

    0.2

    3.2

    -3.6

    3.5

    -5.0

    4.0

    -0.2

    1.3

    0.0

    -5.2

    2.2

    0.4

    -0.2

    4.5

    -2.2

    -4.3

    -3.9

    6.7

    5.5

    -3.7

    0.6

    -0.2

    -1.3

    -0.1

    0.5

    5.3

    0.6

    -0.3

    1.4

    -0.8

    1.3

    -2.1

    -3.6

    0.7

    1.1

    -0.4

    -0.3

    -0.1

    2.2

    -0.7

    0.4

    0.1

    -0.2

    -0.4

    Production in construction

    % change compared with the same month of the previous year*

    Jan-25

    Feb-25

    Mar-25

    Apr-25

    May-25

    Jun-25

    0.4

    -0.4

    -1.2

    4.7

    3.6

    1.7

    0.7

    -2.5

    -2.3

    7.5

    7.1

    3.3

    1.9

    -3.6

    0.1

    3.2

    3.6

    2.9

    0.7

    -0.5

    0.9

    2.1

    1.9

    0.9

    0.8

    -0.1

    -0.8

    4.0

    3.3

    1.9

    0.7

    -2.4

    -1.2

    5.6

    5.8

    3.9

    1.8

    -2.5

    0.3

    2.4

    3.9

    1.3

    0.7

    -0.3

    1.0

    2.3

    1.8

    1.5

    Production in construction

    % change compared with the same month of the previous year*

    Jan-25

    Feb-25

    Mar-25

    Apr-25

    May-25

    Jun-25

    0.4

    -0.4

    -1.2

    4.7

    3.6

    1.7

    0.8

    -0.1

    -0.8

    4.0

    3.3

    1.9

    8.5

    -2.8

    -6.6

    6.1

    -0.9

    1.1

    8.1

    7.0

    8.9

    6.9

    3.6

    4.3

    6.9

    0.6

    12.6

    1.9

    11.6

    14.0

    0.0

    2.8

    1.8

    2.5

    3.0

    1.9

    3.9

    -7.2

    -3.7

    -1.1

    -2.5

    -2.5

    :

    :

    :

    :

    :

    :

    c

    c

    c

    c

    c

    c

    :

    :

    :

    :

    :

    :

    -2.5

    10.1

    -3.0

    47.2

    45.0

    31.4

    -7.1

    -2.5

    -4.2

    -3.6

    -3.3

    -5.1

    13.0

    8.9

    7.6

    10.0

    8.4

    :

    2.3

    3.6

    3.8

    c

    c

    c

    :

    :

    :

    :

    :

    :

    :

    :

    :

    :

    :

    :

    :

    :

    :

    :

    :

    :

    8.8

    1.1

    -0.3

    0.7

    -5.9

    :

    -8.6

    -3.4

    -4.3

    3.1

    8.0

    0.9

    :

    :

    :

    :

    :

    :

    5.4

    0.6

    -1.0

    2.2

    -0.2

    0.7

    5.7

    0.1

    3.5

    -2.1

    -1.1

    -5.0

    6.3

    0.4

    -1.0

    -4.3

    -4.8

    2.2

    -0.8

    3.9

    0.4

    0.7

    5.5

    1.8

    36.0

    7.2

    2.6

    -2.6

    1.8

    7.1

    1.7

    -13.1

    -12.9

    -2.5

    3.7

    9.3

    7.1

    1.2

    5.9

    -2.2

    1.0

    9.8

    7.1

    5.4

    8.4

    5.8

    5.3

    1.5

    -4.4

    -0.7

    3.1

    1.0

    1.2

    -0.3

    -2.6

    -3.6

    -2.4

    -2.3

    -2.0

    -2.1

    Monthly indices for production in construction,

    calendar and seasonally adjusted

    (base year 2021)

    Jan-25

    Feb-25

    Mar-25

    Apr-25

    May-25

    Jun-25

    104.1

    102.9

    102.9

    107.5

    105.2

    104.4

    104.0

    102.9

    102.8

    106.7

    104.7

    104.2

    102.6

    101.3

    100.4

    102.0

    99.7

    100.2

    108.5

    108.3

    110.3

    109.5

    107.8

    107.6

    104.9

    105.0

    108.8

    103.6

    105.7

    108.5

    104.5

    108.0

    107.5

    107.7

    108.1

    108.0

    94.3

    90.8

    91.9

    91.9

    89.1

    89.7

    :

    :

    :

    :

    :

    :

    c

    c

    c

    c

    c

    c

    :

    :

    :

    :

    :

    :

    100.1

    102.2

    101.4

    143.4

    133.4

    125.9

    92.1

    92.5

    92.1

    91.6

    91.2

    90.8

    133.0

    130.8

    131.0

    133.3

    133.4

    :

    141.8

    140.2

    139.4

    c

    c

    c

    :

    :

    :

    :

    :

    :

    :

    :

    :

    :

    :

    :

    :

    :

    :

    :

    :

    :

    95.9

    96.2

    95.2

    95.7

    90.6

    :

    97.1

    95.6

    95.2

    102.7

    103.7

    98.2

    :

    :

    :

    :

    :

    :

    108.9

    107.4

    105.9

    108.3

    106.4

    105.7

    100.0

    98.2

    99.4

    97.6

    97.3

    95.3

    111.1

    107.6

    103.4

    102.5

    102.7

    106.0

    109.9

    113.8

    108.1

    112.4

    112.2

    113.7

    131.2

    124.4

    127.1

    127.6

    127.4

    133.1

    134.6

    128.8

    123.8

    132.1

    139.3

    134.2

    81.9

    81.7

    80.6

    80.5

    80.9

    85.2

    93.2

    92.9

    94.2

    93.4

    94.6

    92.6

    87.5

    88.1

    89.1

    88.7

    88.4

    88.3

    99.2

    98.5

    98.9

    99.0

    98.8

    98.4

    Monthly indices for production in construction, calendar adjusted

    (base year 2021)

    Jan-25

    Feb-25

    Mar-25

    Apr-25

    May-25

    Jun-25

    89.7

    97.7

    108.0

    106.7

    108.9

    110.3

    86.9

    94.9

    105.9

    104.8

    107.7

    110.3

    98.2

    104.4

    112.6

    105.5

    100.4

    113.1

    106.6

    103.9

    115.1

    108.6

    105.3

    112.2

    58.6

    67.1

    93.6

    96.9

    110.1

    122.0

    99.7

    105.8

    112.2

    103.1

    108.8

    110.3

    64.7

    75.1

    94.5

    91.8

    89.6

    94.0

    :

    :

    :

    :

    :

    :

    c

    c

    c

    c

    c

    c

    :

    :

    :

    :

    :

    :

    99.7

    98.5

    98.4

    130.1

    135.3

    121.0

    88.5

    95.6

    98.1

    93.6

    95.6

    99.6

    128.2

    132.6

    142.4

    137.2

    138.0

    :

    130.6

    139.2

    150.7

    c

    c

    c

    :

    :

    :

    :

    :

    :

    :

    :

    :

    :

    :

    :

    :

    :

    :

    :

    :

    :

    85.0

    98.4

    105.0

    102.8

    89.0

    :

    58.5

    65.4

    91.3

    88.8

    101.6

    103.7

    :

    :

    :

    :

    :

    :

    111.4

    121.0

    123.9

    116.4

    114.6

    119.7

    61.0

    72.5

    96.3

    92.2

    94.7

    100.0

    67.0

    72.4

    86.9

    89.3

    96.6

    109.4

    109.5

    111.5

    114.0

    111.3

    116.2

    112.4

    67.6

    80.7

    113.0

    114.6

    121.3

    139.4

    100.9

    107.1

    119.1

    123.7

    145.5

    139.3

    53.0

    60.9

    66.6

    71.4

    80.2

    90.8

    66.6

    72.3

    84.8

    83.3

    99.1

    99.6

    65.6

    76.2

    86.3

    87.5

    90.8

    98.2

    105.0

    92.5

    100.3

    90.7

    95.0

    104.9

    Notes for users

    Revisions and timetable

    Data of previous months have been revised compared with those issued in News Release of 18 July 2025. The monthly percentage change for May 2025 has been revised from -1.7% to -2.1% in the euro area and from -1.3% to -1.9% in the EU. The annual percentage change has been revised from +2.9% to +3.6% in the euro area and from +2.7% to +3.3% in the EU.

    Methods and definitions

    The index of production in construction approximates the evolution of the volume of production within the sector, broken down into construction of buildings, civil engineering and specialised construction activities according to NACE Rev. 2 activity classification.

    Seasonally adjusted euro area and EU series are calculated by aggregating the seasonally adjusted national data. Eurostat carries out the seasonal adjustment of the data for those countries that do not adjust their data for seasonal effects.

    The monthly index as presented in this News Release is calculated only on the basis of the data of those countries reporting monthly data. Missing observations from Member States for recent months are estimated for the calculation of the euro area and the EU aggregates.

    Geographical information

    The euro area (EA20) includes Belgium, Germany, Estonia, Ireland, Greece, Spain, France, Croatia, Italy, Cyprus, Latvia, Lithuania, Luxembourg, Malta, the Netherlands, Austria, Portugal, Slovenia, Slovakia and Finland.

    The European Union (EU27) includes Belgium, Bulgaria, Czechia, Denmark, Germany, Estonia, Ireland, Greece, Spain, France, Croatia, Italy, Cyprus, Latvia, Lithuania, Luxembourg, Hungary, Malta, the Netherlands, Austria, Poland, Portugal, Romania, Slovenia, Slovakia, Finland and Sweden.

    Estonia, Greece, Croatia, Cyprus, Latvia, Lithuania, Luxembourg and Malta are not required to supply monthly data within 1 month and 15 days after the end of the reference month under Regulation (EU) 2019/2152.

    For more information

    Continue Reading

  • Brazil authorities suspend key Amazon rainforest protection measure | Environment

    Brazil authorities suspend key Amazon rainforest protection measure | Environment

    One of the key agreements for Amazon rainforest protection – the soy moratorium – has been suspended by Brazilian authorities, potentially opening up an area the size of Portugal to destruction by farmers.

    Coming less than three months before Brazil hosts the Cop30 climate summit in Belém, the news has shocked conservation groups, who say it is now more important than ever that consumers, supermarkets and traders stand up against Brazilian agribusiness groups that are using their growing political power to reverse past environmental gains.

    Brazil is the world’s biggest soya bean exporter. The legume, used largely for animal and fish feed, is one of the most widely grown crops in Brazil, and posed a huge deforestation threat to the Amazon rainforest until stakeholders voluntarily agreed to impose a moratorium and no longer source it from the region in 2006.

    The voluntary agreement brought together farmers, environmentalists and international food companies such as Cargill and McDonald’s, and determined that any detection of soya beans planted on areas deforested after 2008 would result in the farm being blocked from supply chains, regardless of whether the land clearance was legal in Brazil.

    In the 19 years since, the moratorium has been hailed as a conservation success story that has improved the reputation of global brands, enabled soy production to expand significantly without Amazon destruction and prevented an estimated 17,000 sq km of deforestation.

    But earlier this week it was revealed that the anti-monopoly agency, Cade (the administrative council for economic defence) had given grain traders, such as Bunge, Cargill, Louis Dreyfus and Cofco, 10 days to suspend the moratorium or face financial penalties. Cade’s general superintendent, Alexandre Barreto de Souza, said he had instigated an investigation into the moratorium, noting that it involved sharing commercially sensitive information.

    Greenpeace Brazil called the move a “terrible mistake”, which was the result of political pressure from the “regressive wings of agribusiness” that aimed to punish those who protect forests and reward those who profit the most from Amazon destruction.

    “Without the soy moratorium, considered one of the most effective multistakeholder agreements in the world, soy will once again become a major driver of Amazon deforestation, and this will bury any chance of Brazil meeting its climate targets,” Cristiane Mazzetti, the group’s forest campaign coordinator, said.

    Politically, the timing could not be more embarrassing for the government of Luiz Inácio Lula da Silva. In November, Brazil will stage the first climate conference to be held in the Amazon, which the hosts had hoped would be a showcase for the gains it has made in reducing deforestation.

    But in the Brazilian congress, the dominant agribusiness lobby has passed legislation that undermines indigenous land demarcation and the environmental licensing system, a step that conservation groups have described as the biggest setback in 40 years. The new ruling on the soy moratorium adds to the retreat.

    “Tearing up this agreement on the eve of the Cop30 climate talks sends completely the wrong signal to the world,” Tanya Steele, WWF-UK’s chief executive, said. “This is a perilous development that puts a decade-long agreement to protect the Amazon in the bin and would have a far-reaching impact on UK and global companies too. This suspension has to be reversed. After a summer of fires and extreme heat experienced right across the world, now more than ever we need to be safeguarding the Amazon.”

    Much of the political pressure has come from Mato Grosso state, the soya bean capital of Brazil, which last year revoked tax incentives for companies engaged in agreements such as the soy moratorium. Industry group Aprosoja Mato Grosso welcomed the “historic” decision against what it called “a private agreement without legal support [that] has been imposing unfair trade barriers on farmers”.

    skip past newsletter promotion

    David Cleary, a retired NGO director involved with the Amazon since the 1980s, says soya bean producers want more land to expand production and to increase the value of their assets in the Amazon. He estimates that about 10m hectares (25m acres) – about the size of Portugal – could be suitable for legal clearance for soya if the moratorium is revoked, pushing up the value of that land by fivefold.

    Many expect protracted legal challenges on the grounds that the moratorium cannot be considered a cartel. In the meantime, conservationists urge soya bean traders to continue with the principles of the moratorium on an individual basis for the sake of their international reputations.

    There is strong support among consumers for Amazon protection. A WWF poll earlier this year found 70% of Britons support government action to remove illegal deforestation from UK supply chains.

    “Consumers and retailers have a vital role to play,” said Bel Lyon of WWF-UK. “Market demand must not allow the profits of a few to fuel ecosystem collapse and price instability. Forests are essential for food and energy security, offering climate and health benefits in an increasingly unstable world.”

    Continue Reading

  • Starbucks expands test of Coco Matcha and Coco Cold Brew starting Aug. 21 – Starbucks

    1. Starbucks expands test of Coco Matcha and Coco Cold Brew starting Aug. 21  Starbucks
    2. Starbucks’ Strategic Shift Toward Health-Forward Beverage Innovation: A Path to Reinvigorate U.S. Sales  AInvest
    3. Starbucks Is Launching Coco Matcha and Coco Cold Brew — Here’s Where to Find Them  People.com
    4. Starbucks expands test of coconut water beverages as it leans into health and wellness  CNBC
    5. Will New Beverage Innovation Revive Starbucks’ U.S. Comparable Sales?  Yahoo Finance

    Continue Reading

  • Lucy Guo, world’s youngest self-made woman billionaire, buys $30 million L.A. mansion

    Lucy Guo, world’s youngest self-made woman billionaire, buys $30 million L.A. mansion

    By Charlie Lankston

    The home naturally has impressive tech integration

    Lucy Guo at LA Tech Week in 2024 in Beverly Hills, California.

    Tech mogul Lucy Guo, the world’s youngest self-made woman billionaire, has invested a sizable portion of her enormous wealth into a sprawling new $30 million mansion in Los Angeles’ iconic Bird Streets neighborhood.

    The 30-year-old, who is a native of California, secured quite the impressive deal on the home, which was completed in 2024, when it first hit the market for $43 million.

    Perched on a hillside that overlooks the Sunset Strip, the home is the epitome of modern luxury, having been outfitted with a wide array of very high-tech amenities, including motorized glass walls that retract to open up the home to the stunning exterior, “drought-tolerant landscaping,” and climate-controlled wine rooms.

    The home also features a top-of-the-line smart system, as well as an eco-conscious solar system to ensure that residents can enjoy an extraordinary level of comfort even in the event of a disaster.

    Guo, who founded the social media company Passes, has not yet commented on her purchase of the extraordinary property-which was listed by Ginger Glass and Craig Lotzof of Compass and was first reported on by the Wall Street Journal.

    Records show that Guo was represented by socialite Paris Hilton’s brother, Barron Hilton, and his wife, Tessa Hilton, in the deal, which comes 18 months after the home was first put on the market.

    “Designed by the iconic Vantage Design Group, this architectural marvel of concrete and steel is a showpiece of style, sophistication, and luxury,” the listing stated.

    “Offering breathtaking panoramic views, this estate is a seamless blend of cutting-edge design, opulent indoor-outdoor living, and top-tier amenities, including two elevators.”

    As well as the top-of-the-line tech, the property also features five bedrooms, eight bathrooms, and several open-plan living spaces, including a “high-tech family and media room” that boasts a bar and an immersive LED media wall.

    The choice to invest in a home with such impressive tech integration will come as no surprise to those familiar with Guo’s impressive résumé, which saw her launching a career in the industry at the tender age of 21.

    Guo, who splits her time between Los Angeles-where her AI platform, Passes, is based-and Miami-where she purchased her first home in late 2021, first began drawing interest from the tech world in 2016, when she co-founded the artificial intelligence company Scale AI alongside Alexandr Wang.

    Though Guo left the company in 2018 over a “difference of opinion” with Wang, she retained the majority of her stake in the startup, a stake that is now worth a veritable fortune thanks to Scale AI’s new valuation.

    Guo also made plenty of money since leaving the company, after launching her own company, Passes, in 2022, only to snap up a jaw-dropping $50 million from investors in the first two years alone.

    Her holding in Passes, combined with her “other assets,” leave her with a net worth of $1.25 billion, according to Forbes-a fortune that saw her overtake pop star Taylor Swift as the world’s youngest self-made woman billionaire in June of this year.

    While amassing that impressive fortune, Guo has also built up an impressive bicoastal property portfolio, with homes in Florida and Los Angeles-albeit both pale in comparison to her latest acquisition.

    Guo picked up her Miami abode in 2021 for $6.7 million. The condo sprawls across 4,727 square feet and comes with four bedrooms and 5.5 bathrooms.

    The luxury building features a two-car garage, an indoor resort-style pool, a fitness center, a movie theater, a rooftop helipad, and views of the beach and Miami’s skyline.

    The tower was designed by Zaha Hadid and left Guo in awe in 2021. At the time of purchase, she took to X, formerly known as Twitter, to gush: “I am so *beyond* excited to close on my Miami home today … haven’t had an address in years. What a work of art #zahahadid.”

    Three years later, she snapped up the keys to a stunning five-bedroom, six-bathroom modern farmhouse in Los Angeles.

    She purchased the property in 2024 for $4.2 million. The abode, which was built in 2018, sprawls across 4,643 square feet and comes with a two-car garage and a pool.

    It offers several cozy fireplaces, French doors, a bar, a walk-in closet, and a bathroom with dual vanities and a soaking tub.

    Outside, there is a courtyard covered in lush greenery, a lounging space, and access to a rooftop deck.

    It’s unclear whether Guo will hold on to this home now that she’s made a new property purchase in the city, or whether she will opt to put it on the market.

    More from Realtor.com: I’m 55 With a $125K Salary and I Bought a Home with Secret Rooms in Utah for $330K

    Guo is extremely proud of her growing property portfolio, having told Fortune in 2023, “I have a swanky apartment in Miami and a house in L.A. which is five minutes away from my office.”

    When it comes to commuting to work, Guo opts for “an electric skateboard” or is driven by her “assistant.”

    And it comes as no surprise that she has risen to the top of the tech world because she works so hard, she tends to eat at her desk, and only orders food from Uber (UBER) Eats.

    More from Realtor.com: Buffalo Home Hits the Market for $1 To Let Buyers Decide the ‘True Value’

    Guo also confessed that she never takes a “real vacation” due to how demanding her job is.

    “I’ve never really had a real vacation. Even when I’m on vacation, I’m working at least eight hours per day,” she said.

    When she isn’t working or lounging around one of her chic properties, she can be spotted getting her sweat on at Barry’s Bootcamp, a workout class she attends twice a day.

    The remainder of her little free time is spent dancing at music festivals like Coachella, which she attended in April after spending two weeks learning how to DJ.

    More from Realtor.com: Here’s How First-Time Homebuyers Can Personalize Their Homes Without Breaking the Bank

    Forbes unveiled its 10th Anniversary List of America’s Richest Self-Made Women on June 4, revealing the 100 women who have amassed an eye-watering fortune through their work in tech, entertainment, and manufacturing.

    The co-founder of ABC Supply, Diane Hendricks, garnered the No. 1 spot for the country’s richest self-made millionaire for the eighth year in a row, with a net worth of $22.3 billion.

    More from Realtor.com: Record Number of Luxury Homes Hit the Market in Las Vegas-and Sellers Are Slashing Prices

    Other notable names include Oprah Winfrey, who boasts a $3.1 billion net worth and is 13th on the list, and Kim Kardashian, who has a $1.7 billion net worth and comes in at 19th.

    Meanwhile, Swift-who previously held the youngest self-made billionaire role-is ranked 21st and has a net worth of $1.6 billion.

    This story originally ran on Realtor.com.

    This content was created by MarketWatch, which is operated by Dow Jones & Co. MarketWatch is published independently from Dow Jones Newswires and The Wall Street Journal.

    (END) Dow Jones Newswires

    08-21-25 0458ET

    Copyright (c) 2025 Dow Jones & Company, Inc.

    Continue Reading

  • PMI paints upbeat picture of eurozone manufacturing in August | snaps

    PMI paints upbeat picture of eurozone manufacturing in August | snaps

    Eurozone manufacturing data has jumped around in response to US tariffs, particularly concerning pharmaceuticals. Production plunged in June, but the PMI suggests that things are on the up for industry. The manufacturing output PMI jumped from 50.6 to 52.3, which is the highest reading in more than three years.

    The service sector is not yet accelerating. While indicating growth, the services PMI declined from 51 to 50.7. This reveals that domestic demand remains somewhat sluggish, in line with a cautious consumer and uncertainty among businesses around the state of the economy.

    But for both manufacturing and services, new orders are improving. And hiring was also up, mainly for the service sector. These are healthy signs for an economy that has been weak for some time.

    So overall, the PMI paints a picture of an economy not suffering too much from the trade war at this point. Some acceleration of economic growth could be in the making on the back of fading uncertainty around trade with a deal in place, but of course plenty of risks around the outlook remain.

    Continue Reading

  • Aker BP Finds More Oil, Edges Closer to Billion Barrel Target

    Aker BP Finds More Oil, Edges Closer to Billion Barrel Target

    Norway’s second biggest oil and gas company Aker BP ASA said exploration in the Norwegian North Sea resulted in one of the largest discoveries of oil made on the continental shelf in the last decade.

    The drilling campaign bolstered recoverable volumes from the Yggdrasil area — located off Norway’s southwest coast — to between 96 million to 134 million barrels of oil equivalent, the company said in a statement Thursday. First oil from the development is expected in 2027.

    Continue Reading

  • Viet Nam’s Green Rice Revolution: A Game Changer for Farmers and the Environment

    Viet Nam’s Green Rice Revolution: A Game Changer for Farmers and the Environment

    By Eisen Bernard Bernardo

    Drought and extreme heat are threatening the livelihoods of poor farmers around the world, who often rely on rain-fed agriculture. A potential solution is climate-resilient irrigation, a game-changing practice that helps farmers produce more crops with less water, even in the face of erratic rainfall. This sustainable approach can boost agricultural productivity, strengthen economies, and potentially feed 1.4 billion more people by 2050, making it essential for a growing global population. 

    In a special article published by the World Bank, Transforming Lives Through Climate-Resilient Irrigation: Game Changers for a Livable Planet, one of the highlights is the success story of the Viet Nam Sustainable Agriculture Transformation (VNSAT) Project. The International Rice Research Institute, through the VNSAT Project, addressed the issues of climate change adaptation and mitigation by equipping over 156,000 rice-farming households with climate-smart practices. 

    IRRI deployed high-tech methane-tracking technology on 40 farms in Can Tho to help farmers reduce emissions. Through the use of sensors and a smartphone app, farmers can now employ the “Alternate Wetting and Drying” technique to optimize water use, which has resulted in a reduction of 1.5 million metric tons of CO2 equivalent in greenhouse gas emissions. 

    Encouraged by the project’s success, the Vietnamese government is now expanding these sustainable farming practices to the 1-Million Hectare High Quality and Low Emission Rice (1mHa) Program. Since its launch in late 2023, CGIAR Initiatives like the Asian Mega-Deltas and Excellence in Agronomy have supported the program by providing technical inputs, developing national technical guidelines for the 1mHa Program, and organizing events to strengthen knowledge exchange, demonstrate innovations, and build collaboration among key stakeholders. 

    The work is currently being continued by the new Scaling for Impact Science Program (S4I), together with the Sustainable Farming Science Program and the MKCF-funded RiceEco, USDA Fertilize Right, and World Bank-funded MOM-P projects. S4I is supporting efforts to scale up the project by providing technical advisory in Vietnam through innovations in precision DSR (Direct Seeding Rice) and nutrient management. The program is also utilizing digital tools, including the e-extension platform and EasyFarm, while engaging in policy formulation and developing MRV (Monitoring, Reporting, and Verification) systems that create incentives for these sustainable practices. 

    Check the full story here: https://www.worldbank.org/en/news/immersive-story/2024/06/04/climate-resilient-irrigation-game-changers  

    Continue Reading

  • Japan’s Daiichi Sankyo Shares Drop After Discounted Block Trades

    Japan’s Daiichi Sankyo Shares Drop After Discounted Block Trades

    Daiichi Sankyo Co. shares dropped the most in three months following a series of discounted block trades in the Japanese pharmaceutical company.

    The stock sank 7.2% in Tokyo on volume more than 300% its three-month average, according to data compiled by Bloomberg. Custody Bank of Japan Ltd., SMBC Trust Bank Ltd. and Mitsui Sumitomo Insurance Co. offered blocks totaling as much as ¥188 billion yen ($1.3 billion) at prices representing a discount of up to 7% from Wednesday’s close, according to terms of the deal seen by Bloomberg News.

    Continue Reading

  • Pakistan’s external liabilities stands at $130bn, dollar amounts to 58% of total debt

    Pakistan’s external liabilities stands at $130bn, dollar amounts to 58% of total debt

    A foreign currency dealer counts US dollars at a shop in Karachi on May 19, 2022. — AFP/File
    • External financing to rely on multilateral, bilateral sources.
    • $1bn Panda Bond programme established, first issuance in FY26.
    • Preparatory work underway for launch of Sustainable Bonds.

    ISLAMABAD: Pakistan’s external debt and liabilities, currently standing at around $130 billion, are heavily concentrated in five major currencies, with the US dollar alone accounting for nearly 58% of the total burden, The News reported on Thursday

    “The external debt portfolio is predominantly denominated in a few major currencies. The US dollar leads with a 57.8% share, followed by Special Drawing Rights (SDRs) at 29.88%, Chinese Yuan 5.21%, Japanese Yen 3.95%, and the Euro 2.62%,” reads the government’s latest Debt Management Strategy (DMS) for 2026-2028.

    The Finance Ministry’s strategy underscores that external financing will continue to rely mainly on multilateral and bilateral sources offering concessional terms and longer maturities.

    However, in an effort to diversify, Pakistan plans to re-enter international capital markets with new instruments, including Panda Bonds, Sustainable Bonds, and Eurobonds — subject to favourable global interest rate conditions and domestic economic stability.

    A $1 billion Panda Bond programme has already been established, with the first issuance of $200-250 million scheduled for FY2026, followed by additional tranches in the medium term.

    Preparatory work is also underway for the launch of Sustainable Bonds, backed by a newly developed Sustainable Financing Framework, which is currently under cabinet review. This framework will guide the structure, maturity, and repayment terms of all future sustainable bond issuances.

    Although access to Eurobond markets has remained constrained since 2022, the strategy outlines a plan for re-entry into international capital markets as conditions improve.

    In the meantime, Panda Bonds — Renminbi-denominated securities in the Chinese market — are being developed as an alternative, supporting diversification of funding sources, lowering borrowing costs, reducing refinancing risk and enhancing Pakistan’s financial integration with Chinese markets.

    To actively manage foreign exchange risks, the government intends to employ hedging instruments while also developing domestic futures and interest rate swap markets.

    Innovative options, including debt-for-nature swaps, are under consideration to help manage external liabilities while aligning with climate goals.

    Domestic debt is expected to remain the primary source of government financing during the strategy period. Under the International Monetary Fund (IMF) programme, the ceiling for government guarantees is set at Rs5,600 billion as of end-June 2025.

    By March 2025, guarantees worth Rs405 billion —equivalent to 0.35% of GDP — had been issued, raising the total outstanding stock to Rs4,548 billion.

    These include guarantees extended to state-owned enterprises such as TCP and PASSCO for commodity-related financing.


    Continue Reading