Strong buying interest lifted equities at the Pakistan Stock Exchange on Friday, with the benchmark KSE-100 Indexclosing at a new all-time high amid improved investor sentiment.
The index remained positive throughout the session and touched an intra-day high of 172,582.95 points.
At close, the KSE-100 settled at 172,400.73, up 1,570.51 points or 0.92% from the previous close.
Earlier in the week, trading remained subdued. On Wednesday, cautious sentiment during the roll-over week led to selective selling in heavyweight stocks, pulling the benchmark index down by 243.51 points, or 0.14%, to 170,830.22.
The market remained closed on Thursday, December 25, due to a public holiday.
Roula Khalaf, Editor of the FT, selects her favourite stories in this weekly newsletter.
US retail chain Target is facing pressure from an activist investor after a sales slump that has wiped out nearly a third of its share value this year, according to people familiar with the details.
Toms Capital Investment Management, a US hedge fund that built a stake in Tylenol maker Kenvue before its $48.7bn sale to Kimberly-Clark last month, has made a significant investment in Target, the people said. The exact size of TCIM’s stake is unknown.
The pressure comes after Target in November reported its 12th consecutive quarter of negative or negligible sales growth.
Target’s share price has fallen more than 60 per cent from its all-time high during the Covid-19 pandemic, when customers flocked to it as a one-stop shop for necessities, clothes and home goods. It has underperformed the wider retail sector.
TCIM declined to comment. Founded by alumni of London-based hedge fund GLG Partners in 2017, it has recently built stakes and pushed for strategic changes at Pringles maker Kellanova, US Steel and Kenvue.
Shares in Target rose as much as 3.7 per cent on Friday after the Financial Times report on TCIM’s stake, giving the company a market value of $44.3bn.
Target said in a statement that it maintained a “regular dialogue” with all of its shareholders.
“Target’s top priority is getting back to growth, and our strategy to do so is rooted in three strategic priorities: leading with merchandising authority, providing a consistently elevated shopping experience and leveraging technology,” the company said. “We are confident the execution of this plan will drive the business forward and deliver sustained, long-term value for shareholders.”
Target’s longtime chief executive Brian Cornell plans to step down in February after more than a decade in the top job. He is being replaced by chief operating officer Michael Fiddelke, who after 23 years at the retailer has been tasked with orchestrating a major overhaul.
Fiddelke told investors last month that Target would spend $5bn in 2026, roughly $1bn more than this year, on improvements such as store renovations, product refreshes and a better digital experience. “We are not satisfied with our current results and are relentless in our pursuit of returning to growth,” he said on November’s investor call.
Analysts have highlighted Target’s advantages: 75 per cent of the US population live within 10 miles of its nearly 2,000 stores, second only to Walmart, and it owns 78 per cent of its stores. A recent UBS analyst report noted how Target could monetise its real estate in a similar way to US farm supply retailer Tractor Supply.
Yet consumers have become more cautious about spending, and Target, which relies more on discretionary goods such as decor, has been hit harder than rivals. Walmart’s share price is close to a record high, giving it a market capitalisation of almost $900bn, while the share price of warehouse club store Costco has more than doubled over the past five years.
In October, Target cut 1,000 roles and a further 800 open positions at its headquarters in Minneapolis, Minnesota. The job losses accounted for about 8 per cent of its 22,000 corporate employees.
With about half of its merchandise sourced from outside the US — China is its main source of imported products — it has been hit by US President Donald Trump’s sweeping tariffs.
While the tariffs have increased the cost of merchandise, Target lowered prices for 3,000 household essentials during the holiday shopping season.
NCUA Moves GENIUS Act Rulemaking to OMB, Kicking Off Implementation Process Consumer Financial Services Law Monitor
A Year of Change Across Financial Regulation – and What Comes Next, December 2025 – FDIC Proposes Application Framework for Bank-Affiliated Payment Stablecoin Issuers JD Supra
FDIC Proposes GENIUS Act Application Process for IDI Subsidiary Stablecoin Issuers Lexology
NCUA submits GENIUS Act rulemaking to OMB America’s Credit Unions
Troutman Pepper Locke Weekly Consumer Financial Services Newsletter – December 23, 2025 Consumer Financial Services Law Monitor
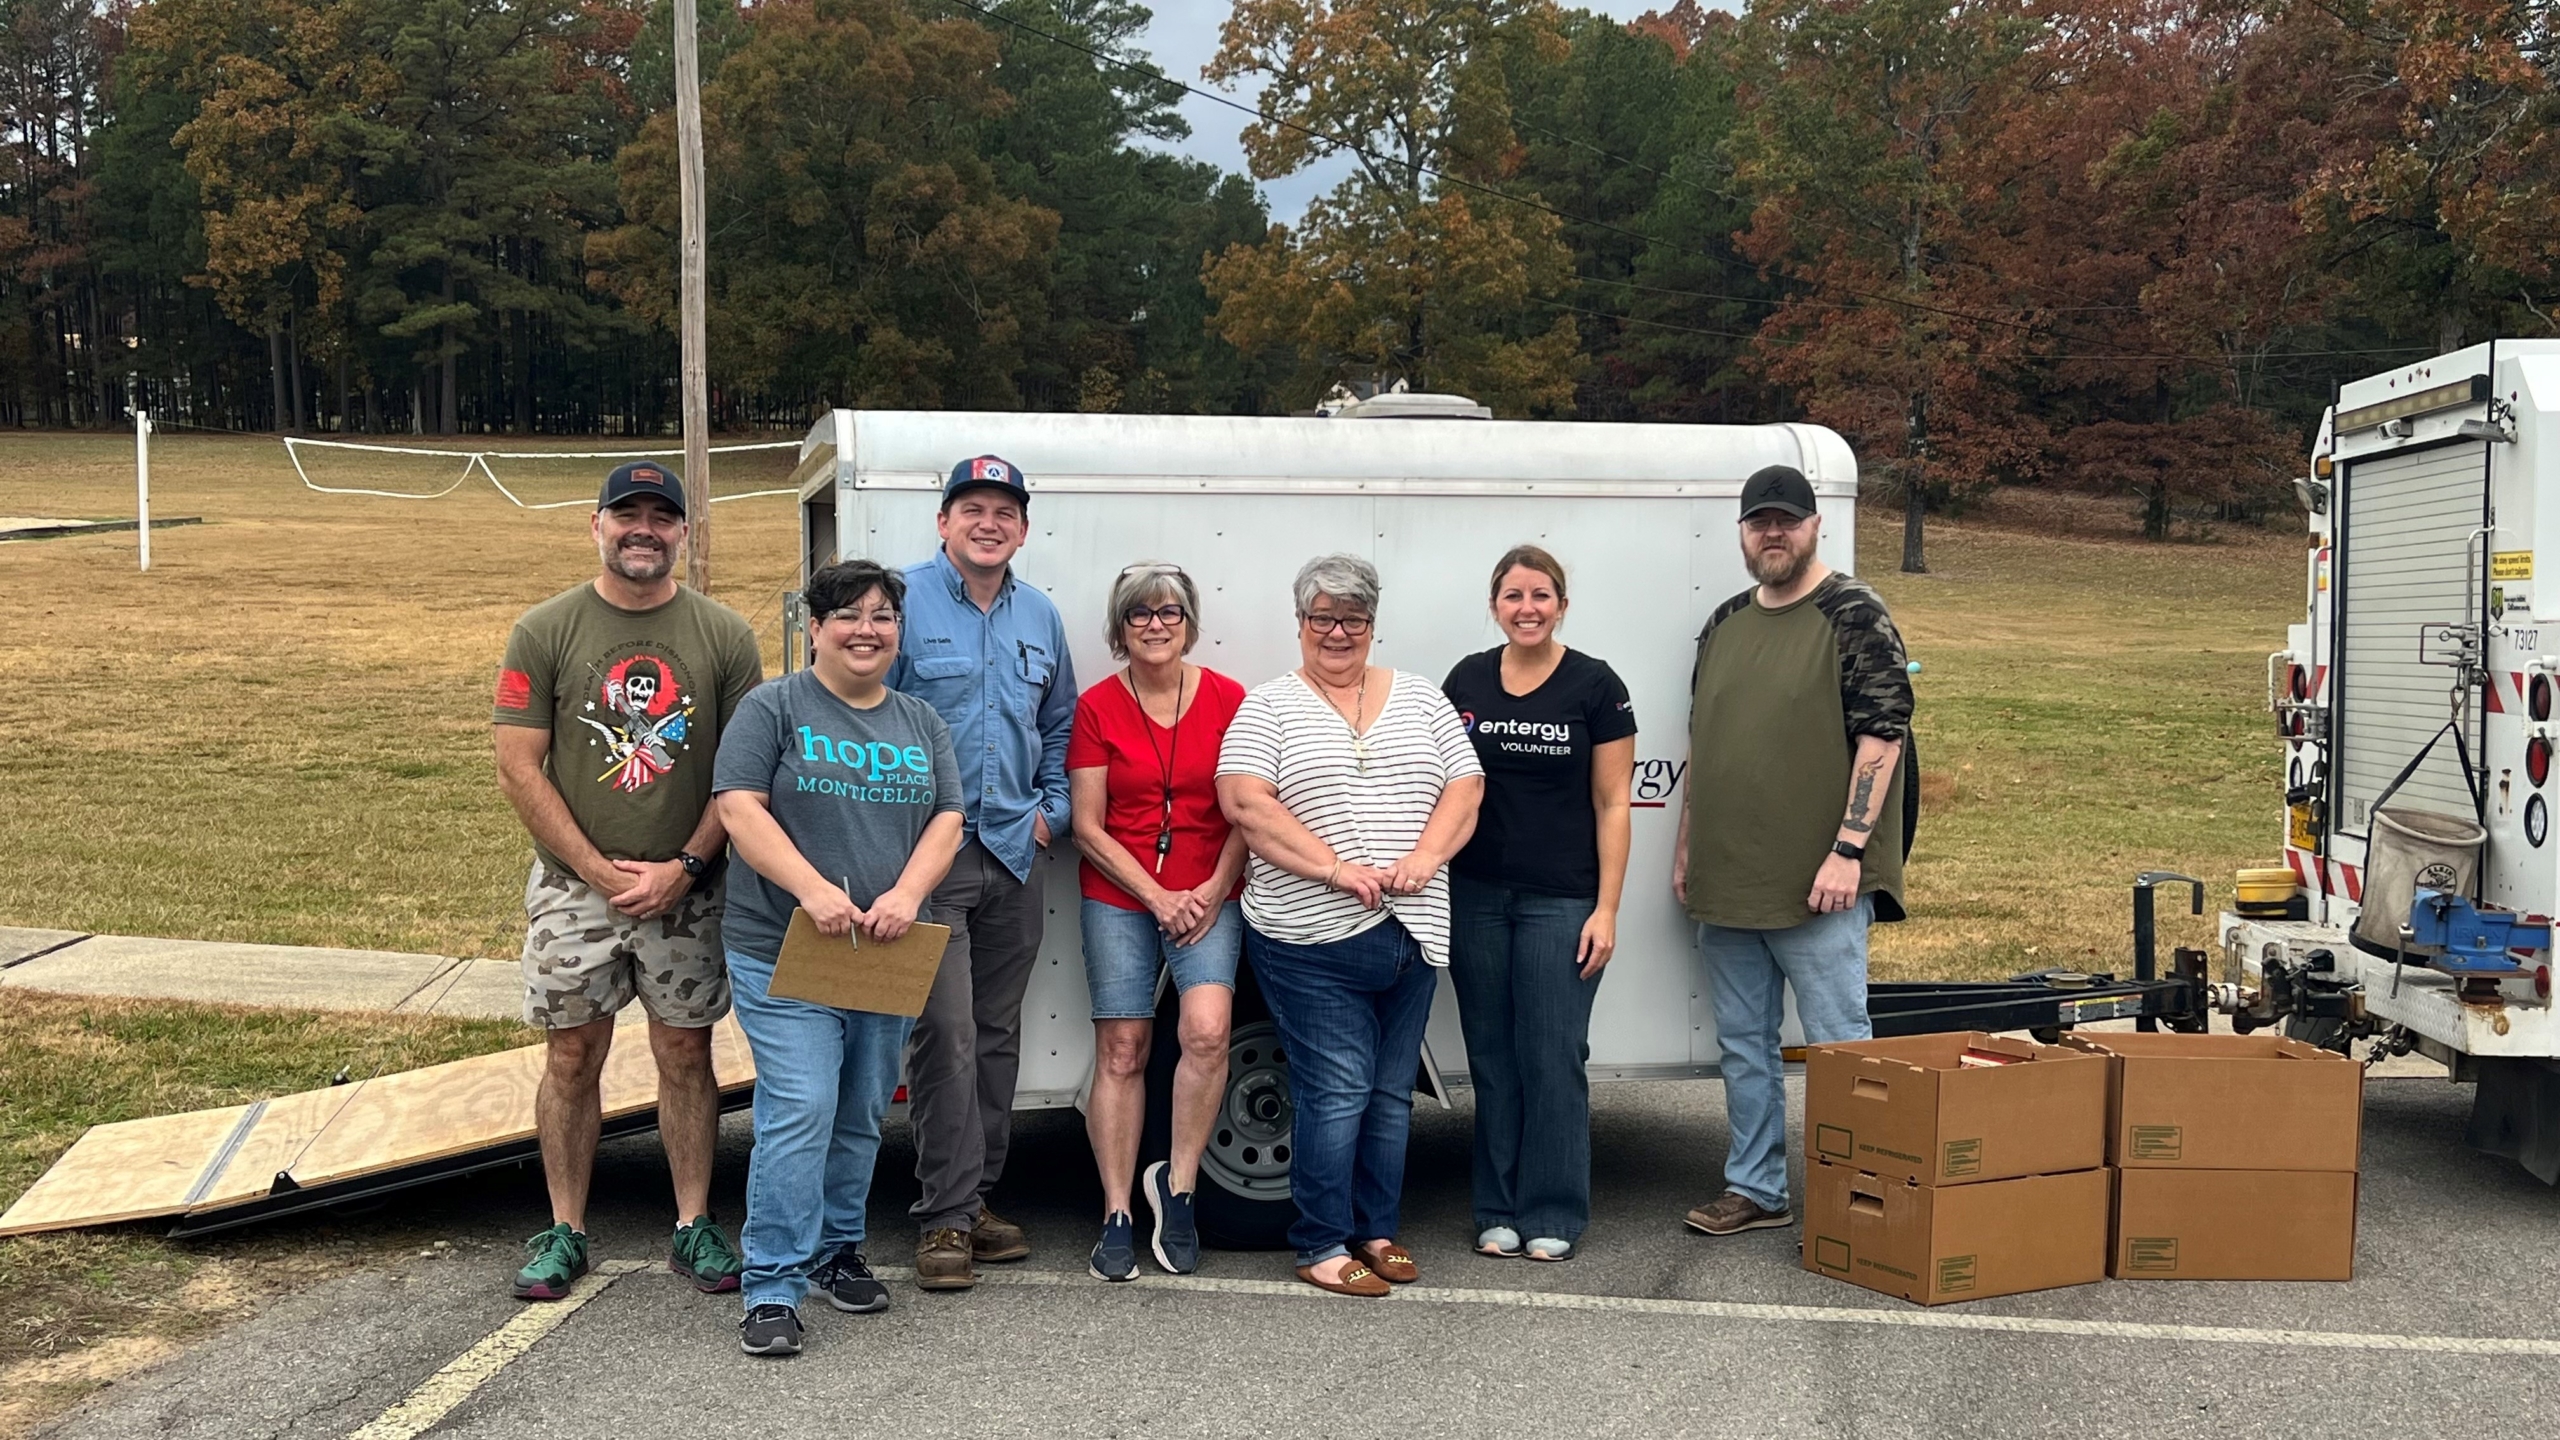
LITTLE ROCK, Ark. – During this season of giving, Entergy Arkansas is doing more than powering communities across its 63-county service area, the company is empowering its employees to make a direct difference in those communities throughout Arkansas for neighbors facing hardship. In the past month alone, Entergy Arkansas has directed $30,000 to hunger-relief efforts statewide at the request of employees who saw needs in their communities.
Drew County effort delivers support through February In Drew County, a local food program that serves 156 senior citizens and disabled residents was temporarily paused due to relocation of a distribution site during the recent federal government shutdown. When Customer Service Manager Amanda Killingsworth, a lifelong Drew County resident, learned of the issue, she quickly mobilized support. She reached out to co-workers and more than 2,600 people on Facebook to sponsor a month of food for $60 per recipient.
Two weeks later, she and colleagues were shopping in bulk, assembling meals with volunteers and delivering boxes by Entergy truck and trailer.
“Entergy truly loves the communities it serves,” Killingsworth said. “When your company president, vice president, managers and co-workers ask, ‘What can we do?’ you realize you’re surrounded by people who believe in service just as much as you do.”
With Entergy Arkansas’s support and donations Killingsworth helped raise, every program participant — and several additional residents in need — received food boxes with enough supplies to last through February.
Hunger Relief Alliance strengthens statewide food access Statewide, the Arkansas Hunger Relief Alliance has also been working to keep shelves stocked at its six regional food banks and more than 500 community partners during the months when many Arkansans were not receiving Supplemental Nutrition Assistance Program (SNAP) benefits. Entergy Arkansas provided a $20,000 grant to support that effort.
Entergy Arkansas Director of Public Affairs John Bethel, who serves as president of the Alliance board, said the grant filled a critical gap.
“This support helped the Alliance provide food to food banks and pantries across the state, helping fight food insecurity and meet the critical needs of our neighbors,” Bethel said.
Alliance CEO Sylvia Blain said Entergy’s partnership strengthens hunger-relief work across Arkansas.
“Entergy’s investment strengthens our statewide network and ensures rural communities, seniors, and families have access to healthy food and emergency support,” Blain said. “We are grateful for Entergy’s continued leadership through John Bethel. His advocacy and service have strengthened hunger-relief efforts statewide and helped connect Entergy employees to the needs of local food pantries.”
Entergy Arkansas employees connect nonprofits to resources
In Malvern, Ashley Selph, network administrative assistant, knew Revive Community Outreach’s pantry was serving more families than ever. She contacted Revive Director Courtney McKinney and encouraged her to apply for an Entergy Arkansas grant. For McKinney — who grew up with Selph — the outreach itself was just as meaningful as the financial support.
“Having community members who work for Entergy advocate for our nonprofit means everything to us,” McKinney said. “It shows how deeply our neighbors care and how willing they are to use their resources to uplift local families.”
Grant helps Sulphur Rock students through holiday breaks Across the state in Independence County, Vegetation Operations Coordinator Chris Millay was visiting his children at Sulphur Rock Elementary when Principal Tina Baker mentioned an urgent need. The school, which provides weekly food boxes to 52 students, lacked funds to purchase food for the upcoming holiday breaks. Millay immediately relayed the request, and by the next morning Entergy Arkansas confirmed a grant to cover the need.
“Sulphur Rock Elementary is grateful for Entergy employees who go beyond their workplace to advocate for our students,” Baker said. “Grants like these directly support our efforts to ensure every child has what they need to learn, grow and thrive.”
Nearly $1M, 30K volunteer hours invested in communities in 2025 In 2025, Entergy Arkansas awarded nearly $1 million in grants, including more than $125,000 for hunger-relief programs. Employees are also on track to complete over 30,000 volunteer hours with nonprofits and schools across the state.
“We invest in solutions and partner with organizations that share our commitment to improving quality of life in Arkansas,” said Brandi Hinkle, senior representative for Entergy Corporate Social Responsibility. “Our employees do the same — giving their time and resources to help those who are disadvantaged.”
Volunteers continue giving spirit through December Throughout December, Entergy Arkansas employees will continue serving communities by collecting toys for Arkansas Children’s Hospital families, ringing bells for the Salvation Army, distributing coats to elementary students and assembling pantry boxes for those facing food insecurity.
To learn more about the Entergy Charitable Foundation and Entergy Arkansas Corporate Social Responsibility, visit entergy.com/csr/giving.
About Entergy Arkansas Entergy Arkansas provides electricity to approximately 735,000 customers in 63 counties. Entergy Arkansas is a subsidiary of Entergy Corporation (NYSE: ETR). Entergy produces, transmits and distributes electricity to power life for 3 million customers through our operating companies in Arkansas, Louisiana, Mississippi and Texas. We’re investing for growth and improved reliability and resilience of our energy system while working to keep energy rates affordable for our customers. We’re also investing in cleaner energy generation like modern natural gas, nuclear and renewable energy. A nationally recognized leader in sustainability and corporate citizenship, we deliver more than $100 million in economic benefits each year to the communities we serve through philanthropy, volunteerism and advocacy. Entergy is a Fortune 500 company headquartered in New Orleans, Louisiana, and has approximately 12,000 employees. Learn more at EntergyArkansas.com and connect with @EntergyARK on social media.
Media inquiries: Lamor Williams [email protected] 501-377-3525
The day after Christmas is often a holiday for many people, prompting questions about whether retailers and services such as banks and the stock market are open on Dec. 26.
The issue is complicated by President Trump’s declaration earlier this month granting federal workers two additional holidays, on Dec. 24 and Dec. 26.
The day after Christmas in the U.S. is a traditional day for making gift returns — the first opportunity after the holiday to exchange presents that didn’t quite make the grade. That means most U.S. retailers are open on Dec. 26, although it’s always a good idea to check your local store’s hours before heading out the door.
Is the stock market open the day after Christmas?
Yes, the New York Stock Exchange and the Nasdaq are open for their normal trading hours on Dec. 26, after closing on Christmas Day and ending trading early, at 1 p.m. EST, on Christmas Eve.
On Friday, regular trading begins at 9:30 a.m. EST and ends at 4 p.m.
Are banks open the day after Christmas?
Banks are also open on Dec. 26, as the day isn’t observed as a holiday by the Federal Reserve system.
Is the U.S. Postal Service open on Dec. 26?
According to the U.S. Postal Service, Dec. 26 is a regular delivery day for the agency, after the postal agency was closed in observance of Christmas.
Request blocked.
We can’t connect to the server for this app or website at this time. There might be too much traffic or a configuration error. Try again later, or contact the app or website owner.
If you provide content to customers through CloudFront, you can find steps to troubleshoot and help prevent this error by reviewing the CloudFront documentation.
Generated by cloudfront (CloudFront)
Request ID: wir-XGyjLTNYXTup0tPdjFoFRZfzHnTXVJFV0ZA0V5xS0vAVfVxxCA==
This is your weekly news roundup, which takes a quick look at some developments in government, politics, education, environment and other topics across El Paso.
Got Christmas Trees and Turkey Grease? Holiday Trash Pickup, Drop-Offs Set
The city’s Environmental Services Department has set the holiday schedule for trash and recycling pickups: Gray and blue bins normally picked up Thursday and Friday will be picked up Saturday, Dec. 27, during Christmas week.
For New Year’s week, the city will service gray trash bins normally picked up Thursday and Friday on Saturday, Jan. 3.
The city will not pick up blue bins on the make-up days, but will get them on the next scheduled recyclable collection day.
Check collection schedules for your address here.
Citizen collection stations will be closed Dec. 25-26 and Jan. 1-2. The sites will reopen at 7 a.m. Saturdays. The collection stations are at 2600 Darrington Road, 1034 Pendale Road, 121 Atlantic Road, 4501 Hondo Pass Drive, 2492 Harrison Ave. and 3510 Confederate Drive.
Live holiday trees and turkey grease can also be taken to the citizen collection stations. Trees can be dropped off beginning Dec. 27. Trees cannot have ornaments, lights, frost or glitter or any other decorative items. Water bills are not required to drop off the trees, grease or oil.
Information: Environmental Services Department or 915-212-6000.
University Medical Center of El Paso Releases CEO Job Review
Jacob Cintron
The University Medical Center of El Paso’s Board of Managers rated CEO Jacob Cintron’s performance at 86.3% for the 2025 fiscal year, a score the board cited in approving a 14% pay raise last week.
In addition to the salary increase, Cintron also received a bonus of more than $346,000, bumping his fiscal year 2026 pay up to $1.1 million.
Records provided to El Paso Matters show Cintron fully met most of his incentive metrics in the 2025 fiscal year, which included benchmarks for finance, quality of patient care, patient services and long-term planning. He partially met two metrics measuring the number of full-time employees per occupied bed and inpatient satisfaction score, according to his evaluation.
READ MORE: UMC El Paso CEO Jacob Cintron to collect nearly $1.5 million after pay raise, bonus
The board cited this evaluation, coupled with a 2025 Gallagher Human Resources Compensation Study of Hospital CEOs, as reason to approve the pay raise.
The board also approved fiscal year 2026 goals for the hospital district, which is budgeted for more than 24,000 patient admissions and more than 1.2 million outpatient visits. The goals include developing a physician recruitment plan for the hospital’s bond project rollout and having one obstetrician under contract by September 2026 to address declining birth rates.
Kerry Doyle at the Stanlee and Gerald Rubin Center for the Visual Arts where she serves as director. (Daniel Perez / El Paso Matters)
UTEP’s Rubin Center Longtime Leader Kerry Doyle to Retire
The Stanlee and Gerald Rubin Center for the Visual Arts at the University of Texas at El Paso will need a new director starting this spring because Kerry Doyle, its longtime leader, will retire after almost 19 years at the center, the past 13 as its director.
Doyle told El Paso Matters via text that it just felt like the right time for her to leave. Her last day will be April 30. She said she is most proud of building a focus on work that was student-centered, interdisciplinary and had deep ties to the border.
She plans to stay in the region and work with the Gaspar Enriquez Cultural Center in San Elizario, which the Rubin Center helped establish in October 2023. Among its many goals are to serve as a training ground for future museum and arts professionals.
LEARN MORE: ‘Blood, sweat and tears’: Gaspar Enriquez Cultural Center to open in San Elizario
Angel Cabrales, associate professor of art at UTEP, said Doyle brought in contemporary artists that most students never would have met, including Chico MacMurtrie in 2021. Some of his students worked on one of MacMurtrie’s robotic pieces that has been shown internationally.
“(Doyle’s) an incredible person and she’s going to be missed so much,” Cabrales said.
Eduardo Diaz, a former administrator at museums across the country, remembers being impressed by Doyle at the 2009 Smithsonian Institution Latino Museum Studies summer program. He was the program’s director.
“It was very clear to me that she was an extraordinary administrator and visionary,” he said by phone. “What she’s done at the Rubin Center reflects that.”
Doyle, an expert in U.S.-Mexican art and culture, curated contemporary art by international artists whose projects promoted community engagement and pushed beyond performative trends.
She earned and managed grants from such organizations as the Lannan and Harpo foundations, the National Endowment for the Arts, the Andy Warhol Foundation for the Visual Arts, the Texas Commission on the Arts and the Paso del Norte Health Foundation.
El Paso County recently received a $12.8 million federal transportation grant to build a transit operations and maintenance facility in Far East El Paso. (Courtesy El Paso Transportation Authority)
El Paso County Receives $12.8 Million Grant for Transit Hub
The county will be able to build a transit operations and maintenance facility on Windermere Avenue in far East El Paso with a $12.8 million grant from the U.S. Department of Transportation’s Federal Transit Administration.
The funding is part of the Low or No Emission Grant Program and Grants for Buses and Bus Facilities Program, and the Infrastructure Investment and Jobs Act.
The El Paso Transportation Authority, or ETA, transit administration facility will house operations and maintenance operations for 36 transit vehicles and six support vehicles.
“We are grateful for this significant federal support, which marks an important step toward building a cleaner and more modern transit system for El Paso County,” ETA Executive Director John Andoh said in a news release.
The county and the ETA currently lease land for its facility.
The land for the new facility has been purchased, the environmental study and design work is being done in partnership with the Camino Real Regional Mobility Authority. The CRRMA oversees road and transportation projects with and for local governments and has partnered with the county for several projects.
The construction bid will be issued in 2026, although a specific construction start date has not been set.
Ethiopian Airlines, the leading carrier in Africa and one of the fastest-growing airline brands globally, is proud to announce the successful completion of Africa’s first full strip-and-paint program of the Airbus A350-900 aircraft on two of its aircraft, marking a significant advancement in Ethiopian MRO’s capacity, technical expertise, and commitment to operational excellence. This achievement marks yet another milestone following the recent development of full strip-and-paint capabilities on the Boeing 787 fleet composite painting capability.
Appreciating the major accomplishment, Mr. Mesfin Tasew, Ethiopian Airlines Group CEO, remarked: “The successful execution of our full strip-and-paint project on two of our A350-900 aircraft coupled with the completion of paint capability on the B787 earlier this year, marks a significant step forward in Ethiopian’s in-house widebody advanced composite structure paint capabilities. This project is yet another milestone which reflects Ethiopian’s ongoing commitment to investing in world-class MRO capabilities, strengthening our operational resilience, enhancing our self-reliance, and elevating our global standing. Beyond saving costs, this achievement enables us to generate additional revenue and reinforce our position as a leading MRO service provider in the continent and the region.”
As one of the leading aircraft maintenance service providers in the continent and the Middle East, Ethiopian MRO has been offering top-notch aircraft maintenance services, including advanced aircraft and aircraft parts painting and coating solutions through its modern paint shop and state-of-the-art dedicated paint hangar for nearly six decades, serving not only Ethiopian Airlines’ own fleet but also third-party customers.
Currently, Ethiopian Airlines possesses comprehensive in-house aircraft painting and specialized multi-layer coating capabilities on both advanced composite and aluminum airframes, across its entire fleet, enabling the airline to efficiently handle painting and coating projects using highly advanced application methods like High-Volume Low-Pressure (HVLP) and electrostatic systems spraying.
About Ethiopian
Ethiopian Airlines Group (Ethiopian)is a true African success story, transforming a visionary dream into a globally renowned reality for nearly eight decades. Operating flights to more than 160 domestic and international passenger, and cargo destinations across five continents, Ethiopian bridges the gaps between Africa and the world. Emphasizing passenger comfort and environmental sustainability, Ethiopian utilizes ultra-modern aircraft such as Boeing 737s, 777s, 787s, Airbus A350-900, A350-1000 and De Havilland Q400.
Ethiopian, the Star Alliance member airline, champions in various coveted awards including Skytrax’s ‘Best Airline in Africa Award’ for eight consecutive years, APEX ‘Best Overall in Africa’ award and ‘Leadership in Connecting Africa through Transport’ Award among others. Ethiopian aims to further excel in its success through a strategic plan dubbed ‘Vision 2035’ and become one of the top 20 most competitive and leading aviation groups in the world. Embracing a Pan-African spirit, Ethiopian is pursuing multi-hub strategy through hubs in Lomé, Togo with ASKY, in Lilongwe, Malawi with Malawi Airlines, in Lusaka, Zambia with Zambia Airways, and in Kinshasa, Democratic Republic of the Congo (DRC) with Air Congo.
For more information, visit our website at www.ethiopianairlines.com email us at CorporateCommunication@ethiopianairlines.com , or call us at (251-11)517-8913/8165/8907.
Federal officials have ordered a temporary halt to the planned shutdowns of two coal-burning Indiana power plants amid President Donald Trump’s attempts to boost the coal mining industry.
The U.S. Department of Energy orders issued Tuesday require Northern Indiana Public Service Co. and CenterPoint Energy to keep those generating plants operating despite their intentions of closing them this month.
The 90-day orders say the two coal-burning units set for closure at NIPSCO’s Schahfer Generating Station near Wheatfield and one at CenterPoint’s Culley Generating Station along the Ohio River near Newburgh must remain “available to operate” until at least March 23.
The orders come as Trump has pushed policies to promote the coal industry while deriding the shift toward solar and wind energy as sources of electricity.
The Energy Department said the Indiana plants orders were needed because the “reliable supply of power from these coal plants is essential for keeping the region’s electric grid stable.” Both orders cited the growing power demands of data centers among the reasons for keeping the plants in operation.
“Keeping these coal plants online has the potential to save lives and is just common sense,” Energy Secretary Chris Wright said in a statement. “Americans deserve reliable power regardless of whether the wind is blowing or the sun is shining during extreme winter conditions.”
The federal agency has issued similar orders for power plants in other states in recent months, including a large coal-burning station in Michigan.
Companies’ response
Indiana’s major utilities have over many years been shifting away from coal-powered plants toward using natural gas and renewable sources for electricity generation.
It was not immediately clear Wednesday how NIPSCO and Centerpoint would abide with the orders to keep the coal-burning plants in operations.
NIPSCO, which has more than 450,000 electric customers across northern Indiana, said it would comply with the order and was “reviewing the overall impact to our customers and company.”
“We recognize the importance of both reliability and cost management for our customers, and we will continue to engage with federal, state and local stakeholders as we adapt to evolving regulatory requirements,” Vince Parisi, NIPSCO’s president and chief operating officer, said in a statement.
CenterPoint, which serves about 150,000 customers in the Evansville area, announced plans in 2023 to convert its last coal-burning unit at the Culley Generation Station to natural gas by 2027.
The company said its plans would reduce costs while preserving the Culley station’s generating capacity and adding solar and wind power sources in the coming years.
CenterPoint said Wednesday it would “continue to work collaboratively with our federal, state and local partners and remain focused on prioritizing affordability and energy security.”
“Working together, we will help contribute to regional electric reliability efforts to focus on what is most important — safe and reliable service for our customers and fellow Hoosiers during the upcoming winter months,” the company said in a statement.
The NIPSCO units set for closure generate about 850 megawatts of electricity and date to the 1980s, according to the federal orders. The CenterPoint unit generates about 100 megawatts and began operations in 1966.
Coal foes blast orders
Environmental groups and consumer advocates denounced the Energy Department orders, arguing they would force “households to pay more for coal’s deadly air and toxic water pollution.”
“The federal government’s order to force extremely expensive and unreliable coal units to stay open will result in higher bills for Hoosiers who are already reeling from record-high rate increases in 2025,” said Ben Inskeep, program director for the Citizens Action Coalition of Indiana. “We can’t afford this costly and unfounded federal overreach.”
An analysis by the Citizens Action Coalition released in July of Indiana’s five investor-owned electric utilities found that residential bills spiked by 17.5% in one year, or $28 a month on average statewide.
Ashley Williams, executive director of Just Transition Northwest Indiana, called NIPSCO’s Schahfer plant “one of the most notorious polluters in the country.”
“On-site coal ash contamination of groundwater, along with a proposed massive gas plant and AI data center, compounds an extremely dire situation and creates an unconscionable environmental burden,” Williams said. “The Trump administration is trying to steal away our futures by keeping us tethered to the dirty coal energy of the past.”
Metastatic gastric cancer (mGC) remains a lethal disease, and while systemic therapy has gradually extended survival in clinical practice, outcomes are still poor overall. Immune checkpoint inhibitors (ICIs), particularly PD-1 blockade, have improved outcomes in multiple solid tumors, and nivolumab is an established later-line option in mGC based on prior randomized evidence.
A growing body of work suggests that circadian biology can shape immune function—immune-cell trafficking, antigen presentation, cytokine release, and effector activation fluctuate over a 24-hour cycle. “Chronotherapy” applies this concept by aligning treatment delivery with the body’s internal clock to potentially improve efficacy and safety. However, until this analysis, there had been no dedicated report in mGC evaluating whether nivolumab infusion timingcorrelates with outcomes.
Study Design and Methods
This was a single-center, retrospective study of patients with unresectable advanced or recurrent gastric/GEJ adenocarcinoma treated with nivolumab monotherapy as third-line or later therapy between December 2014 and December 2022.
Treatment: nivolumab 3 mg/kg or 240 mg every 2 weeks, or 480 mg every 4 weeks.
Eligibility highlights: age ≥20, ECOG PS 0–2, ≥2 prior regimens including fluoropyrimidine + taxane, and at least two nivolumab infusions.
Exposure definition (timing groups)
Infusion start times were pulled from medical records:
Early infusion group (EA): ≥70% of infusions before 14:00
Late infusion group (LA): <70% of infusions before 14:00
The 14:00 cutoff was chosen because it matched the most frequent infusion time window (13:30–14:00) and aligned with a prior chronotherapy report design.
Results
Between December 2014 and December 2022, 296 patients received nivolumab, of whom 248 met the eligibility criteria for analysis. Patients were divided according to infusion timing into an early administration (EA) group (n = 140) and a late administration (LA) group (n = 108). Overall, baseline clinicopathologic characteristics were well balanced between the two groups. However, patients in the EA group showed slightly more favorable inflammatory profiles, with a higher proportion of patients having a neutrophil-to-lymphocyte ratio (NLR) <2.4 (59% vs 38%) and a trend toward lower modified Glasgow prognostic scores (mGPS). As expected, the median infusion start time differed substantially between groups (11:50 in the EA group vs 14:22 in the LA group).
Tumor response
Among the 149 patients with measurable disease, treatment efficacy differed markedly by infusion timing. The objective response rate (ORR) was significantly higher in the EA group (17%) compared with the LA group (3%). Similarly, the disease control rate (DCR) was more than doubled in the EA group (47% vs 20%). In contrast, progressive disease was substantially more frequent among patients receiving late-day infusions.
gastric cancer
Survival outcomes
Survival analyses consistently favored early nivolumab administration. Median progression-free survival (PFS) was 2.3 months in the EA group compared with 1.6 months in the LA group, corresponding to a hazard ratio (HR) of 0.65, which was statistically significant. Median overall survival (OS) was also significantly prolonged with early administration (7.6 months vs 3.9 months; HR 0.64).
Importantly, infusion timing remained an independent prognostic factor after multivariable adjustment, with adjusted HRs of 0.70 for PFS and 0.67 for OS, confirming that the observed survival advantage was not solely explained by baseline imbalances.
Sensitivity and robustness analyses
Additional analyses supported the robustness of these findings. When alternative cutoff values were tested, the survival benefit of early administration persisted and became evident once more than approximately 50% of infusions were delivered earlier in the day. Furthermore, in a three-group model stratified by the proportion of early versus late infusions, outcomes followed a clear stepwise pattern: patients treated predominantly in the early hours experienced the most favorable outcomes, those with mixed timing had intermediate results, and patients treated mostly later in the day had the poorest survival.
Safety
About one-third experienced at least one irAE.
Most common irAEs: skin toxicity (rash/pruritus), thyroid dysfunction, and transaminase elevation.
Any-grade irAEs were numerically higher in EA (40.7% vs 29.6%), and skin irAEs were significantly more frequent in EA.
Grade 3/4 irAEs were similar between groups (~6–7%).
No treatment-related deaths.
This pattern fits prior observations in ICI practice where the presence of certain irAEs—especially skin toxicities—can correlate with improved outcomes, although causality cannot be inferred here.
Insights
This analysis strengthens a provocative, clinically practical idea: the same drug, given earlier in the day, may be associated with better outcomes—even in a setting as difficult as later-line mGC.
The proposed biological rationale is not about nivolumab’s long plasma half-life; rather it centers on shorter-timescale pharmacodynamics and immune trafficking: if nivolumab distribution to lymphoid tissues and tumor-draining nodes coincides with periods when naïve and memory T cells preferentially localize to lymph nodes, antigen presentation and priming may be more effectively “unblocked,” translating into deeper or more frequent responses. The study also highlights how systemic inflammation markers (like NLR and mGPS) remain powerful prognostic variables in real-world ICI-treated mGC—and timing appeared to retain independent prognostic impact even when accounting for these.
Key Takeaway Messages
In this real-world cohort of third-line+ nivolumab monotherapy for mGC, receiving nivolumab mostly before 14:00 was associated with:
Higher ORR (17% vs 3%)
Higher DCR (47% vs 20%)
Longer PFS (2.3 vs 1.6 months)
Longer OS (7.6 vs 3.9 months)
The observed association persisted after adjustment in multivariable analyses, confirming infusion timing as an independent factor. Early administration was associated with a higher incidence of immune-related adverse events of any grade, most notably cutaneous toxicities, while no increase in severe (grade 3–4) irAEs was observed. These findings should be interpreted as hypothesis-generating, given the retrospective study design and the potential influence of post-progression treatments on overall survival. Accordingly, prospective, randomized studies are required to validate these observations.
Conclusion
This study suggests that chronotherapy may be an actionable, zero-cost optimization for nivolumab in metastatic gastric cancer—potentially improving efficacy without adding toxicity burden. While the mechanism is not yet defined and confounding is unavoidable in retrospective research, the signal is consistent with chronobiology-informed immunotherapy data from other tumors. The next step is clear: prospective randomized trials and translational work integrating immune-cell dynamics, cortisol rhythms, lymphocyte trafficking, and tissue pharmacokinetics to determine whether “treating earlier” can become a reproducible standard in ICI delivery.