(This is the Warren Buffett Watch newsletter, news and analysis on all things Warren Buffett and Berkshire Hathaway. You can sign up here to receive it every Friday evening in your inbox.)
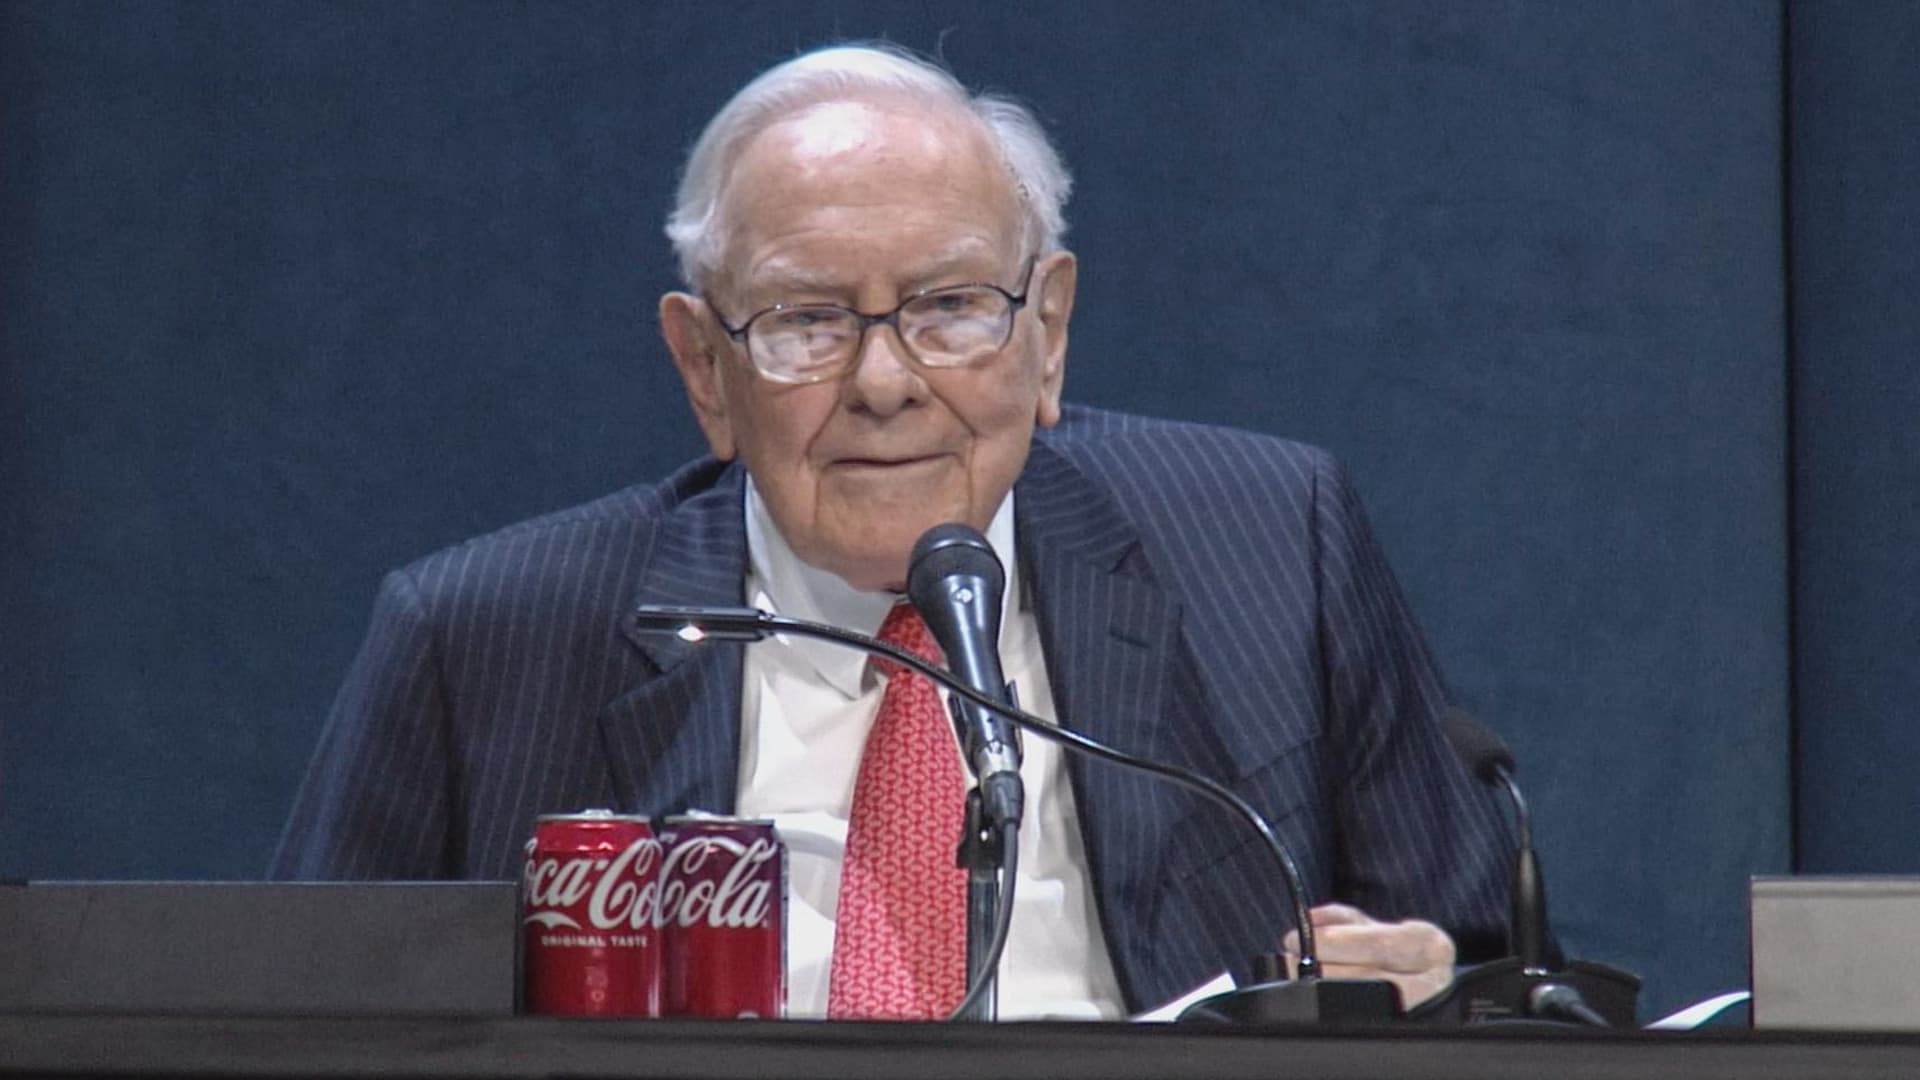
Warren Buffett is going into his last week as CEO of Berkshire Hathaway, the vehicle he has used to generate incredible wealth for himself, and for the company’s loyal longtime shareholders, over the past six decades.
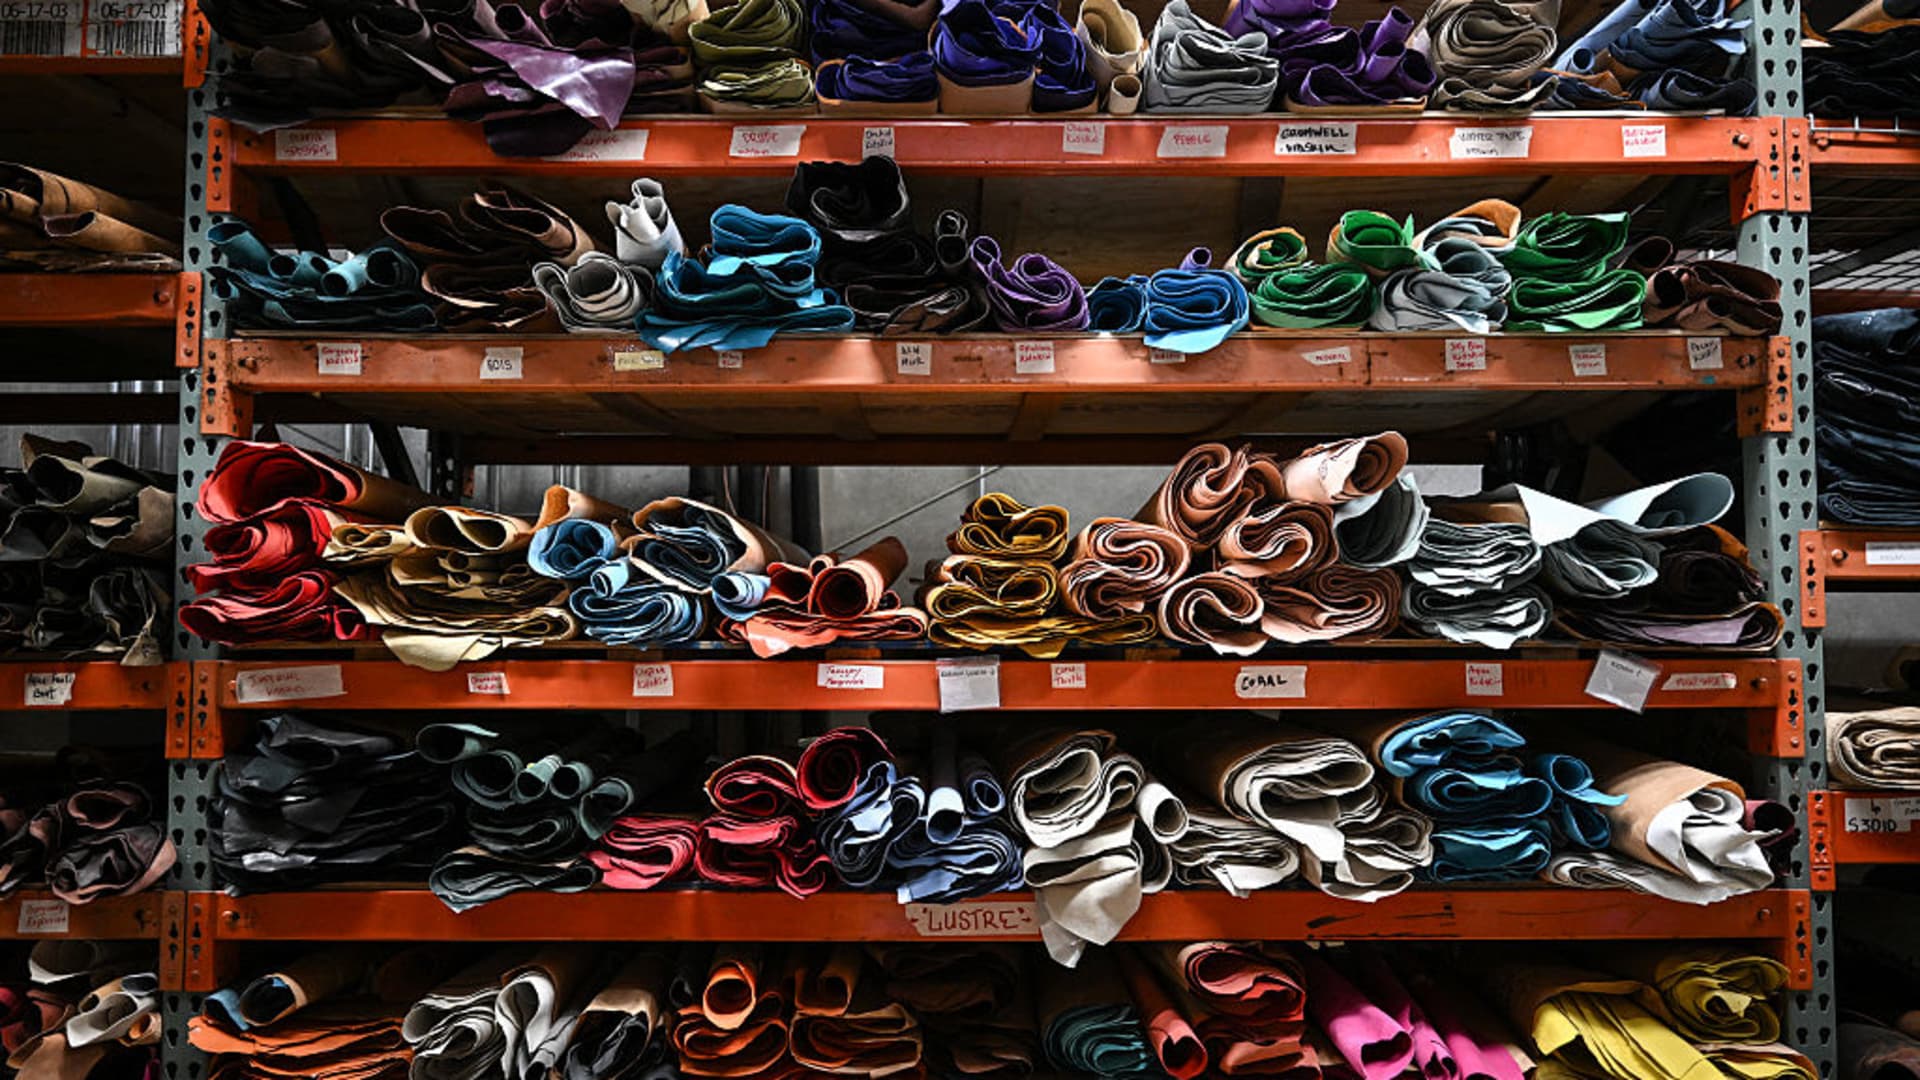
Since he took control in 1965, Buffett has transformed a struggling textile company into a massive conglomerate worth more than $1 trillion.
His Class A shares account for almost all of his estimated total net worth of $151 billion, which puts him in the #10 slot of the Bloomberg Billionaires Index.
He would be No. 22 on that list with roughly $359 billion if he held onto the hundreds of thousands of Berkshire B shares, currently valued at $208 billion, that he’s been giving away since 2006, with more donations to come.
Given all the success he’s had with the company, it may be surprising to hear him call Berkshire “the dumbest stock I ever bought” … a blunder that has cost him hundreds of billions of dollars.
From the deep recesses of CNBC’s Warren Buffett Archive, here’s a rare clip of Buffett in 2010 with an in-depth explanation for Becky Quick of why he never should have bought Berkshire Hathaway and the important lesson he learned from his costly mistake.
BECKY QUICK: All right. Warren, thank you very much for joining us today.
WARREN BUFFETT: My pleasure.
BECKY QUICK: What we’re trying to get to the bottom of is what was the worst trade you ever made and what’d you learn from it?
WARREN BUFFETT: The dumbest thing I ever did? (LAUGHTER)
BECKY QUICK: Yeah, the dumbest thing you ever did.
WARREN BUFFETT: The — the dumbest stock I ever bought — was — drum roll here — Berkshire Hathaway. And — that may require a bit of explanation. It was early in — 1962, and I was running a small partnership, about seven million. They’d call it a hedge fund now.
And here was this cheap stock, cheap by working capital standards or so. But it was a stock in a — in a textile company that had been going downhill for years. So, it was a huge company originally, and they kept closing one mill after another. And every time they would close a mill, they would — take the proceeds and they would buy in their stock. And I figured they were going to close; they only had a few mills left, but that they would close another one. I’d buy the stock. I’d tender it to them and make a small profit.
So I started buying the stock. And in 1964, we had quite a bit of stock. And I went back and visited the management, Mr. (Seabury) Stanton. And he looked at me and he said, ‘Mr. Buffett. We’ve just sold some mills. We got some excess money. We’re going to have a tender offer. And at what price will you tender your stock?’
And I said, ‘11.50.’ And he said, ‘Do you promise me that you’ll tender at 11.50?’ And I said, ‘Mr. Stanton, you have my word that if you do it here in the near future, that I will sell my stock to — at 11.50.’ I went back to Omaha. And a few weeks later, I opened the mail —
BECKY QUICK: Oh, you have this?
WARREN BUFFETT: And here it is: a tender offer from Berkshire Hathaway — that’s from 1964. And if you look carefully, you’ll see the price is —
BECKY QUICK: 11 and —
WARREN BUFFETT: — 11 and three-eighths. He chiseled me for an eighth. And if that letter had come through with 11 and a half, I would have tendered my stock. But this made me mad. So I went out and started buying the stock, and I bought control of the company, and fired Mr. Stanton. (LAUGHTER)
And we went on from there.
Now, that sounds like a great little morality table — tale at this point. But the truth is I had now committed a major amount of money to a terrible business. And Berkshire Hathaway became the base for everything pretty much that I’ve done since.
So in 1967, when a good insurance company came along, I bought it for Berkshire Hathaway. I really should — should have bought it for a new entity.
Because Berkshire Hathaway was carrying this anchor, all these textile assets. So initially, it was all textile assets that weren’t any good. And then, gradually, we built more things on to it. But always, we were carrying this anchor.
And for 20 years, I fought the textile business before I gave up. As instead of putting that money into the textile business originally, we just started out with the insurance company, Berkshire would be worth twice as much as it is now. So —
BECKY QUICK: Twice as much?
WARREN BUFFETT: Yeah. This is $200 billion. You can — you can figure that — comes about. Because the genius here thought he could run a textile business. (LAUGHTER)
BECKY QUICK: Why $200 billion?
WARREN BUFFETT: Well, because if you look at taking that same money that I put into the textile business and just putting it into the insurance business, and starting from there, we would have had a company that — because all of this money was a drag. I mean, we had to — a net worth of $20 million. And Berkshire Hathaway was earning nothing, year after year after year after year.
And — so there you have it, the story of — a $200 billion —
Incidentally, if you come back in ten years, I may have one that’s even worse. (LAUGHTER)
BECKY QUICK: If you — if you had to look at a moral for that story, though, is it don’t cut off your nose to spite your face?
WARREN BUFFETT: I would say — I would say that no matter whether you cut off your nose to spite your face or whatever, if you get in a lousy business, get out of it. I mean, it — it was — it was a terrible mistake, just because I drifted into it, in a sense.
And — and I’ve always said that if you want to be known as a good manager, buy a good business. (LAUGHTER)
That’s the way to do it. And everyone will think you’re smart.
And when I’m in a good business, like people think, ‘Boy that guy’s smart.’ And when I’m in a dumb business, like textiles, and don’t know what I’m doing, you know, or shoes later on, or whatever it may be, you know, all that other — if you think you’re a managerial genius, just try yourself in a bad business.
BECKY QUICK: Is that the lesson that you learned from it?
WARREN BUFFETT: Sure.
BECKY QUICK: But — and that is something that you’ve actually put into practice?
WARREN BUFFETT: I’ve actually put a line in my annual report many, many, many decades late — ago, after doing this. And I said, ‘When a manager with a reputation for brilliance, meets up with a business with a reputation for bad economics, it’s the reputation of the business that remains intact.’
BECKY QUICK: (LAUGHTER) So that is a lesson you carried with you? And yet, it’s one that is — you’re reminded of every single day. It’s Berkshire Hathaway.
WARREN BUFFETT: Yeah. And every now and then, I get tempted. Because I started out with Ben Graham in 1950 or so. And his whole idea was buying things that were cheap.
You don’t want to buy things that are cheap. You want to buy things that are good. It’s much better to buy something that’s good at a fair price, than something that is cheap at a bargain price.
And I wasn’t — I didn’t start out that way. I — I was taught a different system.
But — but if I didn’t learn from Berkshire Hathaway, I’ll never learn. (LAUGHTER)
BECKY QUICK: How long did it take you to figure out this lesson? You said it was —
WARREN BUFFETT: Well, it took me 20 years to give up on the textile business. I — I had a wonderful guy running it after — after Seabury Stanton — a fellow named Ken Chase ran it. And he was terrific. Honest and able, hardworking. And he couldn’t make it go.
But we just kept working at it, trying — we bought another textile company called Waumbec Mills in Manchester, New Hampshire. Another mistake.
If you’re going to be brilliant with a lousy business, why not be brilliant with a good business?
BECKY QUICK: But really, how — it took 20 years for you to finally give up on it. When did you kind of figure, oh, this is not working? Was it — did it — was it really 20 years? Or did you kind of know —
WARREN BUFFETT: Well, it was — no. I figured it out fairly soon. But I just kept thinking I’m not going to give up on this. And incidentally, we had a work force that was terrific. I mean, it — it was — we weren’t done in by anything except competitive dynamics. And I — we’d buy new equipment, or we would move — we would add this mill in Manchester, and we’d say, ‘Look at all those synergies,’ and all that. Nothing works.
I — In fact, I used to have a desk in my drawer. And they would keep sending me these things that if we buy this machine, we’ll save 14 people. If we buy this machine, we’ll save 12 people. I kept putting it in my drawer. With all those machines, we’d save more people than we had at the start of the — supposedly, we were operating with zero people. But it doesn’t work that way.
BECKY QUICK: Is there any business that you didn’t get into because you thought, wait a second, I’ve been down this road before? Where you were tempted and you kind of pulled back?
WARREN BUFFETT: I get calls on them every day. You know, I mean, I get calls — not every day. I mean, it’s an exaggeration. But I get calls frequently on businesses that are just too tough. And — and people say, you know, why don’t you tackle it? You know, got all these resources now and good managers.
But the interesting thing about business, it’s not like the Olympics. In the Olympics, you know, if you do some dive off the — on a high board and have four or five twists — (LAUGHTER) on the way down, and you go in the water a little bad, there’s a degree of difficulty factor. So you’ll get more points than some guy that just does a little headfirst dive in perfectly.
So degree of difficulty counts in the Olympics. It doesn’t count in business. Now, you don’t get any extra points for the fact that something’s very hard to do. So you might as well just step over one-foot bars instead of trying to jump over seven-foot bars.
BECKY QUICK: You know, people will say, well, wait a second. You’re in some businesses that some people have written off for dead: the newspaper business. How is that different?
WARREN BUFFETT: You’re right. (LAUGHTER) But — but we bought that [The Buffalo Evening News] in 1977. And — and we’ve done very well over the years. At — at first, we didn’t do so well. But then we did very well.
But I — the newspaper business of 2010 is not the newspaper business of 1977. I mean, it is diametrically different. [Berkshire sold the newspaper in 2020.]
And it is true, and we put it in the annual report, that we run Berkshire in a way that they don’t teach in business schools. Because in business schools, they say sell off your so-so businesses and keep buying new businesses. I call that gin rummy management.
And when I — if I had 50 kids, you know, and one of them isn’t doing quite as well as the others, I’m not going to put him up for adoption. Unless they are going to lose us money permanently, or if they have major labor difficulties, we keep the businesses that aren’t as good as the others.
So, if I’m going to follow that philosophy, I’d better be very careful about what I buy, right?
BECKY QUICK: Exactly. What about your business partner, Charlie Munger? What would he say your biggest mistake is?
WARREN BUFFETT: Well, he would probably repeat this. And I would say I’ve learned a lot about what I just got through talking about — I’ve learned a lot from Charlie.
Charlie told me this from the first moment I met him in 1959. He said — he said exactly — I could have — I could have saved myself a lot of trouble if I’d just listened to him. But what did Charlie know? (LAUGHTER)
BECKY QUICK: OK. Warren, thank you very much. We really appreciate your time.
WARREN BUFFETT: Thanks. Thanks for having me.