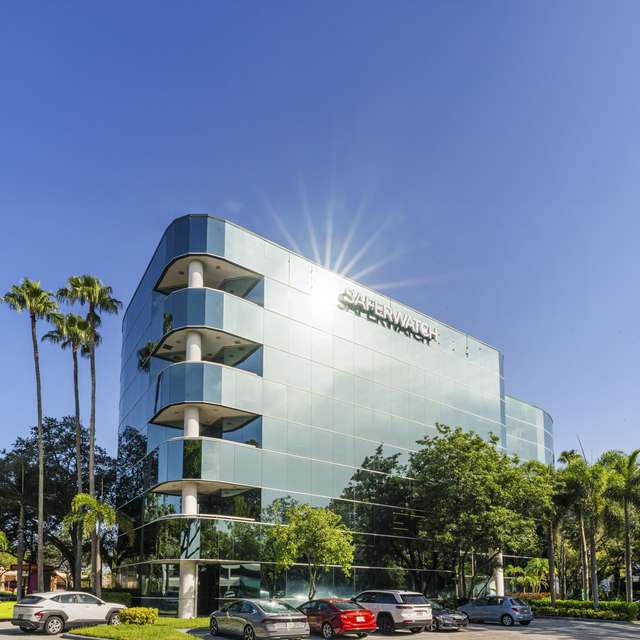
FORT LAUDERDALE, Florida, December 22, 2025 – Cushman & Wakefield announced today that the firm represented PEBB Enterprises in its disposition of the 6400 Building in Fort Lauderdale. PEBB Enterprises acquired the asset in 2004 for $6.31M, and it served as their corporate headquarters before relocating to Boca Raton.
Cushman & Wakefield’s Scott O’Donnell, Mike Ciadella, Greg Miller and Miguel Alcivar represented the seller in its $11.93 million transaction with a private family office.
Located at 6400 N. Andrews Avenue in Fort Lauderdale’s Uptown Urban Village, the 6400 Building totals 55,241 square feet and is 89% leased, providing both a secure income stream and significant upside potential. With average suite sizes of 3,724 square feet, the 6400 Building caters to small and mid-sized users, the segment that represents the majority of leasing demand in the market.
The property is distinguished by its high-profile signage at the Cypress Creek Road interchange of I-95, visible to approximately 260,000 cars daily, an identity typically reserved for much larger corporate assets. Its central location, just north of Downtown Fort Lauderdale, offers direct connectivity to I-95, Cypress Creek Road, Commercial Boulevard and Federal Highway, delivering tenants a cost-effective alternative to the congestion and higher rents of the CBD while maintaining access to South Florida’s key business hubs.
“Our team is witnessing increasing demand from private-capital investors for well-located, high-quality assets that cater to the small to mid-size tenants that have remained resilient through the past few years,” said O’Donnell, Cushman & Wakefield Executive Managing Director. “This asset’s visibility from I-95 and access to the Cypress Creek Interchange drove strong investor interest.”
Several automakers are recalling certain models because they may pose a potential safety risk to owners, according to the National Highway Traffic Safety Administration (NHTSA).
Brands like BMW, Chrysler and Ford are recalling some vehicles due to safety hazards.
Here’s what you need to know to keep your family safe:
BMW
Around 36,922 of BMW’s 2025-2026 X3 vehicles are being pulled because unexpected steering wheel movement may occur while the vehicle is stopped.
No injuries have been reported as of this writing.
The NHTSA said the steering wheel software will be updated by a dealer or over the air, free of charge.
Notification letters are expected to be mailed on Feb. 2, 2026. That is also when Vehicle Identification Numbers (VINs) involved in the recall will be searchable on the NHTSA database.
Owners may contact BMW customer service at 1-800-525-7417.
You can find the recall information here.
Honda
Around 70,658 of the company’s 2016-2020 Acura ILX vehicles have an internal brake leak, which may reduce brake function and increase the risk of a crash.
No injuries have been reported as of this writing.
Dealers will replace the affected parts at no cost. Interim notification letters letting owners know of the safety risk are expected to be sent on Feb. 2, and a second letter will be sent once the final remedy is available.
VINs involved in the recall are now searchable on the NHTSA database. Honda’s number for this recall is RN5.
Owners can call the company’s customer service line at 1-888-234-2138.
You can find the recall information here.
Ford
The company is recalling around 32,160 of its 2022 to 2025 E-Transit vehicles because it may lose drive power and could roll away while parked if the parking brake is not applied.
The NHTSA said no crashes have been reported as of this writing.
The remedy for this recall is still under development. Notification letters letting owners know of the safety risks are expected to be mailed on Monday, Dec. 22, and another letter will be sent when the final remedy is available.
Ford’s number for this recall is 25SD9. VINs involved in this recall are now searchable on the NHTSA database.
Owners with questions can contact Ford’s customer service line at 1-866-436-7332.
You can find the recall information here.
Around 272,645 of Ford’s vehicles are being recalled because the park function may not work properly, potentially causing them to roll away.
No injuries or crashes have been reported as of this writing.
The following models are affected, according to the NHTSA:
2022-2026
2024-2026
2025-2026
The park module software will be updated by a dealer or through an over-the-air update, the NHTSA said. Notification letters are expected to be sent on Feb. 2, 2026, with an additional letter being sent once the final remedy is available.
Ford’s number for this recall is 25C69. VINs involved in this recall will be searched on the NHTSA database starting on Jan. 26.
Owners with questions can contact the company’s customer service line at 1-866-436-7332, the NHTSA said.
You can find the recall information here.
Chrysler
Around 52,565 of the company’s vehicles are being recalled because a software error may prevent the driver’s side air bag and/or seat belt pretensioner from deploying during a crash.
No injuries have been reported as of this writing.
The NHTSA listed the following models as affected:
2025
Ram 2500 Pickup
3500 Pickup
3500 Cab Chassis
4500 Cab Chassis
5500 Cab Chassis
Dealers will update the software for free. Notification letters are expected to be sent on Jan. 15, 2025, the NHTSA said.
VINs are now searchable on the NHTSA database. The company’s number for this recall is C3C.
Owners with questions can contact Chrysler’s customer service at 800-853-1403.
A total of 504 patients were included in our cohort analysis (Table 1); 491 of them could be thoroughly evaluated for the presence of POD (Supplementary Table 2). Thirteen patients were excluded from the detailed statistical analysis as a thorough POD assessment was not possible (for dropout analysis see supplementary Table 3). Among them, 106 patients (21.6%) were diagnosed with POD following cardiac surgery, based on the CAM-ICU and I-CAM. Detailed demographic data is presented in Table 1. Patients diagnosed with POD were significantly older than those without POD (mean age with POD: 71.0 ± 7.7 years vs. mean age without POD: 67.6 ± 8.3 years, p < 0.001, Table 1). Notable statistical differences were also found between the two groups in terms of MoCA findings, heart failure, implanted pacemaker or defibrillator, heart valve disease, the presence and severity of mitral valve disease, and type 2 diabetes, as detailed in Table 1. POD lasted an average of 3.3 ± 1.3 days, diagnosed 1.4 ± 0.7 days after cardiac surgery and ended 3.8 ± 1.3 days after intervention. Most patients exhibited hypoactive delirium symptoms (45%). A form of mixed POD occurred slightly less frequently (37%); the fewest patients presented with hyperactive POD (18%). POD was diagnosed in 73% of patients via a positive CAM-ICU score and 47% applying the I-CAM), where some patients were positive in both CAM-ICU and I-CAM.
Table 1 Characteristics of the total FINDERI cohort and stratified by postoperative delirium: demographics, heart, brain and internal medicine disease factors and plasma biomarker.
Preoperative heart and brain disease related factors
We conducted univariate logistic regression analysis to identify significant heart and brain disease related factors associated with the development of POD in those patients assessable for POD (n = 491, see supplementary Table 2). The analysis revealed several relevant factors: age (OR 1.05, 95%-CI: 1.02, 1.08, p < 0.001), MoCA assessment results (OR 0.86, 95%-CI: 0.81, 0.92, p < 0.001), the presence of heart failure (OR 2.29, 95%-CI: 1.26, 4.47, p = 0.01), heart valve disease (OR 1.73, 95%-CI: 1.09, 2.81, p = 0.024), mitral valve insufficiency (OR 1.75, 95%-CI: 1.12, 2.72, p = 0.013), mitral valve stenosis (OR 7.22, 95%-CI: 1.17, 55.9, p = 0.033), moderately severe mitral valve disease (OR 3.8, 95%-CI: 1.78, 8.00, p < 0.001), extremely severe mitral valve disease (OR 2.03, 95%-CI: 1.08, 3.74, p = 0.025), tricuspid valve insufficiency (OR 1.7, 95%-CI: 1.02, 2.82, p = 0.038), moderate tricuspid valve disease (OR 3.13, 95%-CI: 1.09, 8.66, p = 0.028), and type 2 diabetes (OR 2.12, 95%-CI: 1.35, 3.31, p < 0.001). Additionally, the presence of a defibrillator was identified as a significant factor (OR 4.76, 95%-CI: 1.24, 19.5, p = 0.022). These findings are presented in supplementary Table 2.
Plasma biomarker
Plasma biomarkers p-tau181 and IL-6 were evaluated via univariate regression analysis to determine their significance in predicting POD in our cohort of 491 patients with assessed POD status (Supplementary Table 2). Our analysis indicated that preoperative IL-6 levels represented a significant risk factor (OR 1.38, 95%-CI 1.07, 1.77; p = 0.012, n = 476), while postoperative IL-6 levels (OR 1.07, 95%-CI 0.77, 1.47; p = 0.69, n = 425), and the difference between postoperative and preoperative IL-6 levels (OR 0.88, 95%-CI 0.68, 1.12, p = 0.29, n = 422) did not constitute significant risk factors in a univariate context (Supplementary Table 2). Similarly, preoperative levels of p-tau181 (OR 2.26, 95%-CI 1.46, 3.57; p < 0.001, n = 483) were found to be a significant predictor of POD in the FINDERI cohort.
Plasma biomarker to predict postoperative delirium
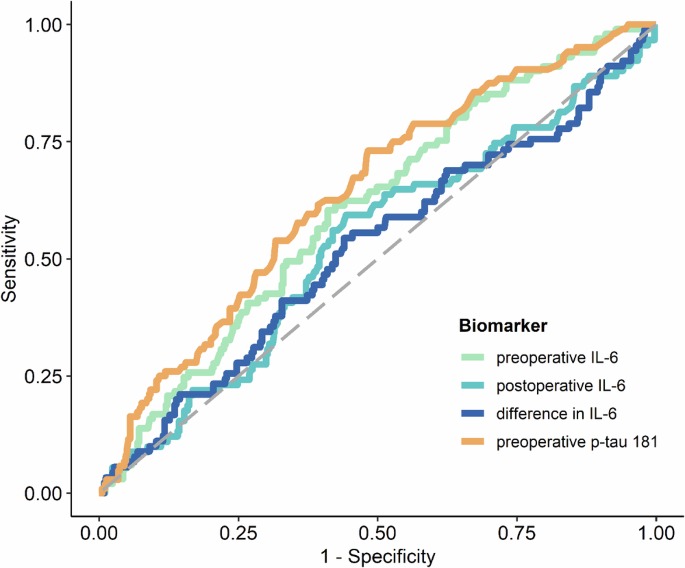
The levels of preoperative IL-6 and preoperative p-tau181 were identified as significant predictors of POD. This is illustrated in Fig. 1; Supplementary Table 4. Supplementary Figure 1 also show the log-transformed biomarker levels of IL-6 and p-tau181. ROC analysis yielded an AUC of 0.605 (95%-CI: 0.544, 0.663, p = 0.0018) for preoperative IL-6 levels and an AUC of 0.641 (95%-CI: 0.581, 0.698, p < 0.0001) for preoperative p-tau181. The optimal cut-off value for preoperative IL-6 was 4.71, demonstrating a sensitivity of 60.4% and a specificity of 58.9%, as detailed in supplementary Table 5A (for postoperative IL-6 cut off value, see Table 4B). The optimal cut-off value determined for preoperative p-tau 181 was 1.57, with a sensitivity of 61.5% and a specificity 60.7%, as reported in supplementary Table 5C. However, it was observed that POD could not be predicted based on postoperative IL-6 levels or the difference between postoperative and preoperative IL-6 levels, as indicated in supplementary Table 4, supplementary Figures 1B, C and Fig. 1. Furthermore, a linear mixed-effects model for IL-6 demonstrated that while time (p < 0.0001) and POD (p = 0.03) were significant factors, the interaction between time and POD was not significant (p = 0.09), as depicted in supplementary Figure 2. The mean group values in the difference of the log-transformed IL-6 levels for no POD were 1.809 (95%-CI: 1.71, 1.91, p < 0.0001) and 1.624 for POD (95%-CI: 1.43, 1.82, p < 0.0001).
Fig. 1: ROC curves of IL-6 and p-tau181 plasma biomarkers for predicting POD.
ROC curves of preoperative IL-6 (orange), preoperative p-tau 181 (green), postoperative IL-6 (light blue) and the difference between post- and preoperative IL-6 (dark blue) blood levels for predicting POD following the CAM and CAM-ICU POD definition. Abbreviations: CAM = confusion assessment method, CAM-ICU = Confusion Assessment Method for the Intensive Care Unit, POD = postoperative delirium, IL-6 = interleukin 6, p-tau181 = phosphorylated tau protein 181.
Predicting postoperative delirium by combining plasma biomarkers and heart and brain as well as immunotherapy related factors
To identify possible associations among biomarkers and various heart and brain as well as immune system related factors, we conducted a multiple logistic regression analysis in three different models (Table 2A). In the first model, IL-6, age, sex, tumor, corticosteroids, colchicine and cytostatic drugs were included as explanatory variables in the analysis; we found that age and log-transformed preoperative IL-6 facilitated the prediction of POD (Table 2B and Fig. 2, Model 1). We investigated the immunotherapy-associated variables in a model with IL-6, since the activity of the inflammatory marker IL-6 can be influenced by immunotherapy. Our first model was able to predict POD with reasonable accuracy, achieving an AUC of 0.658 (95%-CI: 0.596, 0.714, p < 0.0001), as shown in Table 2B and Fig. 2, Model 1. Log p-tau181, age, gender, cognitive performance measured by MoCA and education were included as explanatory variables in our second model. It also included cognitive performance together with preoperative p-tau181 levels, as neurodegenerative processes are often associated with reduced cognition. This model revealed that log-transformed preoperative p-tau181, female sex, and cognitive performance were relevant factors. POD could be predicted with this model with moderate accuracy, namely an AUC of 0.694 (95%-CI: 0.637, 0.747, p < 0.0001, Table 2C, Fig. 2, Model 2). When we combined all explanatory variables (log-transformed IL-6, log-transformed p-tau181, age, sex, tumor, corticosteroids, colchicine, cytostatic drugs, MoCA findings, education, preoperative log IL-6 and preoperative p-tau 181 and female sex) into one model (Model 3), female sex, education > 10 years and cognitive performance (MoCA) proved to be relevant factors. However, the interaction between the blood biomarkers p-tau181 and IL-6 in blood plasma was not a relevant POD predictor (OR 0.87, 95%-CI: 0.48, 1.56, p = 0.63, Table 2, Model 3). With this combined model 3, POD was predictable with moderate accuracy with an AUC of 0.709 (95% CI: 0.651, 0.763, p < 0.0001; Table 2D, Fig. 2, Model 3).
Table 2 Multiple logistic regression models.
Fig. 2: Multiple logistic regression models for predicting POD.
Model 1: Plasma log transformed preoperative IL-6 in conjunction with age predict POD with an AUC of 0.658 (95%-CI, 0.596, 0.714, p < 0.0001). Model 2: log transformed preoperative IL-6 in conjunction with female sex and cognitive performance (MoCa assessment findings) predict POD with an AUC of 0.694 (95%-CI, 0.637, 0.747, p < 0.0001). Model 3: preoperative log-transformed levels of p-tau181 and IL-6, sex and cognitive performance determine POD prediction with an AUC of 0.710 (95%-CI, 0.651, 0.763, p < 0.0001). Abbreviation: AUC = area under the curve, CI = confidence interval, MoCa= Montreal Cognitive Assessment, ROC = receiver operating characteristics.
Predicting postoperative delirium taking a machine learning approach
Decision tree
To identify the most important guidelines for predicting POD, we created a decision showing four important rules. The rules were applied in the following sequence: (1) preoperative p-tau181 level greater than 1.4, (2) the presence of moderate or severe mitral valve disease, (3) a preoperative p-tau181 exceeding 1.8, and (4) preoperative IL-6 level above 5.8, as depicted in Fig. 3. The performance of this decision tree model was quantitatively evaluated, showing an AUC of 0.672 (95%-CI: 0.604, 0.735, p < 0.0001) on the training set and 0.642 (95%-CI: 0.537, 0.738, p = 0.0108) on the validation set. These results, along with detailed visual representations, are provided in supplementary Table 6, Fig. 3.
Fig. 3: Decision tree for POD prediction.
Decision tree with the four most predictive variables for POD, ie, preoperative p-tau181 value, preoperative IL-6 and severity of mitral valve disease. Abbreviation: POD = postoperative delirium, p-tau 181 = phosphorylated tau protein 181, IL-6 = interleukin 6.
LASSO
During the application of the LASSO machine learning procedure, non-zero regression coefficient estimates were observed for two variables: age and preoperative p-tau181 levels. The performance of the LASSO model in predicting POD was assessed using ROC analysis, which demonstrated an AUC of 0.751 (95%-CI: 0.686, 0.805, p < 0.0001) for the training and an AUC of 0.652 (95%-CI: 0.539, 0.747, p = 0.0086) for the validation set, reflecting a moderate level of prediction accuracy. These findings, along with the corresponding graphical representation, are detailed in supplementary Table 6 and Fig. 4A, B.
Fig. 4: ROC curves of the classification models regularized LASSO and decision trees.
ROC analysis revealed that the classification model decision tree yielded significantly predictive accuracy of POD for the training (A) and validation (B) datasets [A, B: p < 0.05; AUC for the training dataset of 0.672 (95%-CI: 0.604, 0.735, p < 0.0001); AUC for the validation dataset of 0.642 (95%-CI: 0.537, 0.738, p = 0. 0108)]. LASSO also predicted POD accurately with an AUC of 0.751 (95%-CI: 0.686, 0.805, p < 0.0001) for the training dataset (A) and 0.652 (95%-CI: 0.538, 0.747, p = 0.0086) for the validation dataset (B). Abbreviations: CI = confidence interval, ROC = receiver operating characteristics, POD = postoperative delirium.
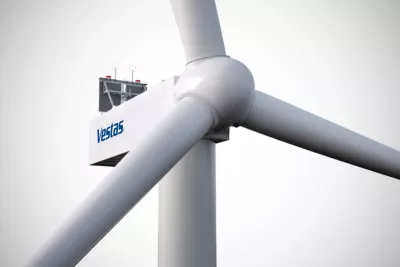
News release from Vestas-American Wind Technology Portland, 22 December 2025
Vestas is proud to have received orders for 320 MW in the USA for undisclosed projects.
For more information, please contact:
Matt Copeman Lead Specialist, Marketing & Communications Mail: mtcoe@vestas.com Tel: +1 (503) 475-6428
About Vestas Vestas is the energy industry’s global partner on sustainable energy solutions. We design, manufacture, install, and service onshore and offshore wind turbines across the globe, and with more than 197 GW of wind turbines in 88 countries, we have installed more wind power than anyone else. Through our industry-leading smart data capabilities and unparalleled more than 159 GW of wind turbines under service, we use data to interpret, forecast, and exploit wind resources and deliver best-in-class wind power solutions. Together with our customers, Vestas’ more than 37,000 employees are bringing the world sustainable energy solutions to power a bright future.
For updated Vestas photographs and videos, please visit our media images page on: https://www.vestas.com/en/media/images.
We invite you to learn more about Vestas by visiting our website at www.vestas.com and following us on our social media channels:
Dec. 22, 2025 – (SAN ANTONIO) – – CPS Energy offices, call center, and customer service centers will be closed for the Christmas holiday on Wednesday, December 24, and Thursday, December 25, as well as for the New Year holiday on Wednesday, December 31, and Thursday, January 1, 2026.
CPS Energy’s customer service centers will resume normal operations at 7:45 a.m. on Friday, January 2, 2026.
During the closure, customers can report emergency natural gas or electric notices by calling (210) 353-HELP (4357). Online services may be accessed at cpsenergy.com.
Customers can conveniently take care of the following services at any time by logging into Manage My Account:
start/stop/transfer service,
make payment arrangements,
reconnect services following full payment of past-due bill
sign up for emergency alerts, and
update contact information, mailing address, and other options.
CPS Energy has expanded its Energy Angels program to provide more donation options. Those interested in giving the gift of energy this holiday season can visit the Energy Angels webpage.
###
About CPS Energy Established in 1860, CPS Energy is the nation’s largest public power, natural gas, and electric company, providing safe, reliable, and competitively-priced service to more than 970,000 electric and 390,000 natural gas customers in San Antonio and portions of seven adjoining counties. Our customers’ combined energy bills rank among the lowest of the nation’s 20 largest cities – while generating $10.1 billion in revenue for the City of San Antonio since 1942. As a trusted and strong community partner, we continuously focus on job creation, economic development, and educational investment. We are powered by our skilled workforce, whose commitment to the community is demonstrated through our employees’ volunteerism in giving back to our city and programs aimed at bringing value to our customers.
The front of the Four Seasons shopping centre – the car park of which is set for major refurbishment work
Work on Mansfield’s Four Seasons Shopping Centre car park is due to start on 5 January and is expected to last around 40 weeks.
The work is estimated to cost around £2m and will include concrete frame repairs, re-tarmacking surfaces, a brighter environment and work to make the car park easier to navigate and use.
Shoppers will still safely be able to use the Mansfield District Council-owned car park which will be subject to only partial floor closures during the repairs.
Cllr Craig Whitby, the council’s Deputy Mayor and Portfolio Holder for Corporate and Finance, said: “It’s important that people can park their vehicles in a safe and secure place in Mansfield.
“These repairs will mean some short-term disruptions and disturbance. However, when complete, the car park will be a much more user-friendly facility, and this will help to attract more shoppers into the town centre.
“The lighting will be better and there will be new signs and colour coded flooring to make the car park easier for users to navigate and find electric vehicle charging points.
“There will also be improved walkways for pedestrians and wider parking bays in some areas and, most crucially, the car park structure will be fully repaired to secure its future safety and viability.”
The need for the work was recognised after a full structural survey in February 2024.
Extra checks were made at the car park following the partial collapse at the nearby Walkden Street car park in September, and before any decision was made on awarding the repairs contract for the Four Seasons car park.
These surveys have confirmed the structural integrity of the Four Seasons car park. Although the two car parks look similar to each other, the structural design of the reinforced concrete decks at the Four Seasons facility is different. The work at Four Seasons is being funded through the council’s capital programme budgets for 2025/26 and 2026/27.
Cemplas Waterproofing and Concrete Repairs has been awarded the contract for the work and aims to mitigate noise and closure disruptions for residents, businesses and shops near the shopping centre with businesses being notified of potential noise disruption during the day.
In addition:
All movement of materials will happen between 7am and 8.30am, Monday to Friday, with warning tones on vehicles turned off during these operations.
Partial car park closures will be a staged process with clear signage and directions for cars parking in the facility to avoid affected areas.
Alternative parking for TGS Gym customers will be available across the road on Union Street or within the open sections of the Four Seasons car park because the area of the car park that they currently use will be unavailable during the whole course of the renovation.
The maker of Jim Beam bourbon whiskey said it plans to pause production at its main distillery in Kentucky starting Jan. 1.
Jim Beam, which is owned by a U.S. subsidiary of Japan’s Suntory Holdings, said in an email to CBS News that its distillery in Clermont, Kentucky, will temporarily halt production “while we take the opportunity to invest in site enhancements.” The company plans to keep its James B. Beam campus open for visitors during that time, the company added.
Jim Beam will continue to distill at its Fred B. Noe craft distillery in Clermont and Booker Noe distillery in Boston, Kentucky.
The pause comes amid several challenges in the wine and spirits industry. Americans overall are drinking less, with Gallup finding that the share of U.S. adults who consume alcohol has fallen to 54%, near a 90-year low.
Exports of U.S.-produced spirits fell 9% in the second quarter, partly due to the impact of the Trump administration’s tariffs, according to an October report from the Distilled Spirits Council of the United States, a trade group. Exports to Canada were particularly hard hit, declining by 85% during the period, after Canadian retailers pulled U.S. spirits from shelves in retaliation for President Trump’s tariffs, the group noted.
Through August, whiskey distillers had produced 55 million fewer proof gallons this year than a year ago, a decline of 28%, according to the Lexington Herald-Leader. A proof gallon is one U.S. gallon of liquid that is 50% proof alcohol.
Traders work on the floor at the New York Stock Exchange in New York City, U.S., Dec. 8, 2025.
Brendan McDermid | Reuters
U.S. stock futures rose on Monday, spurred by a rise in technology shares, to start a shortened holiday week.
S&P 500 futures traded up 0.4%, while Nasdaq-100 futures climbed 0.7%. Dow Jones Industrial Average futures rose by 71 points, or 0.2%.
Key stocks linked to artificial intelligence offered a boost to the broader market. Nvidia shares rose nearly 2% in premarket trading after Reuters said the company is looking to begin shipments of its H200 chips to China by mid-February. Meanwhile, Micron Technology and Oracle climbed almost 4% and more than 2%, respectively.
Wall Street is coming off a mixed week for the major averages. A late-week surge in tech stocks helped lift the S&P 500 and Nasdaq Composite to their third winning week in four, up 0.1% and 0.5%, respectively. The 30-stock Dow, which has outperformed this month, fell 0.7%, snapping a three-week winning streak.
AI stocks enjoyed a resurgence last week after their recent underperformance. Shares of Oracle, a major laggard, jumped after TikTok agreed to sell its U.S. operations to a new joint venture that includes the software giant and private-equity firm Silver Lake. Nvidia also made a comeback.
However, investors are watching to see whether AI stocks can retain their leadership heading into the year-end, especially as investors rotate into cheaper parts of the market amid concerns about lofty tech valuations. There’s also doubt about whether a “Santa Claus rally” will materialize, as the S&P 500 struggles to hold a key technical level.
“My view a couple of weeks ago was an end of year grind,” said Justin Bergner, portfolio manager at Gabelli Funds. “And I think that’s become an end of year churn.”
The New York Stock Exchange will close early on Wednesday at 1 p.m. ET on Christmas Eve and will be closed Thursday for Christmas Day.
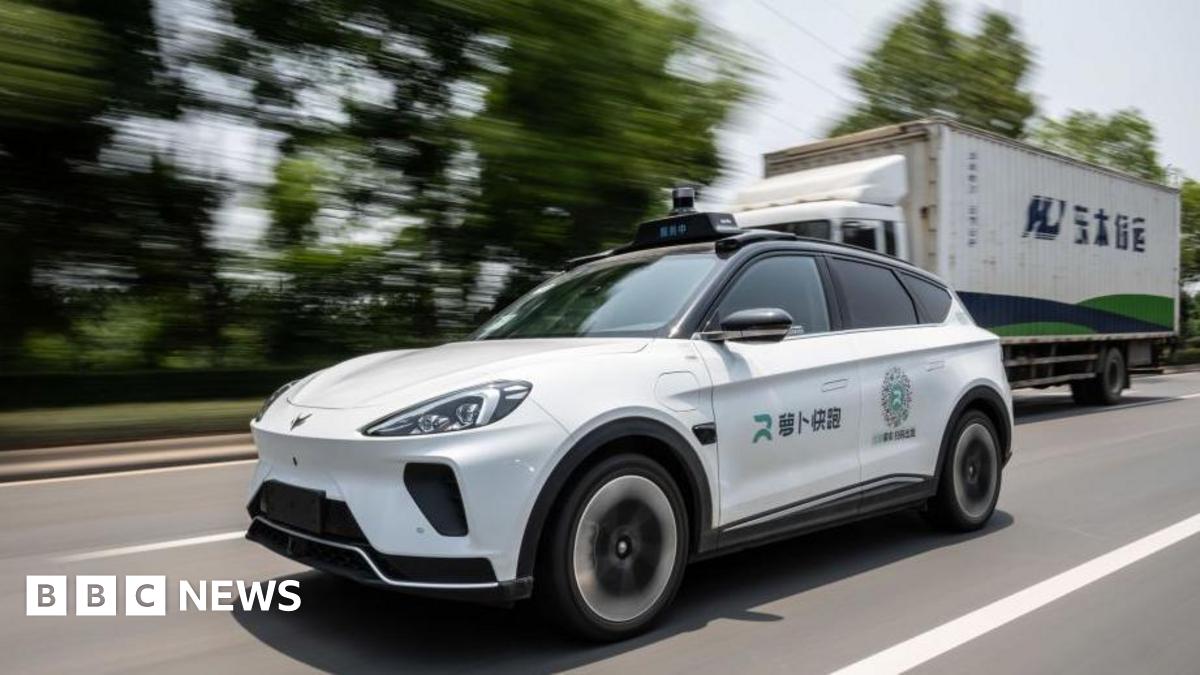
“We’re planning for self-driving cars to carry passengers for the first time from spring, under our pilot scheme – harnessing this technology safely and responsibly to transform travel,” Ms Alexander said in a post on X, external.
Uber said in June it would bring its plans to trial UK driverless cars forward as the government sought to accelerate framework to allow pilots of small autonomous “bus and taxi like” commercial services in 2026.
“We’re excited to accelerate Britain’s leadership in the future of mobility, bringing another safe and reliable travel option to Londoners next year,” it said of its Baidu partnership on Monday.
Lyft said in August it would look to deploy driverless taxis in the UK and Germany as part of a European agreement with Baidu.
It already operates “autonomous rides” in Atlanta, US – where Uber also operates a robotaxi service through its partnership with Waymo.
Lyft chief executive David Risher said in a post on X, external on Monday London passengers would be “the first in the region to experience Baidu’s Apollo Go vehicles”.
But both firms still need to convince regulators.
Mr Risher said if green lit, Lyft’s initial fleet of dozens of Baidu Apollo Go cars would begin testing next year “with plans to scale to hundreds from there”.
But Jack Stilgoe, professor of science and technology policy at University College London, said driverless cars “can’t just scale up like other digital technologies”.
“There’s a big difference between having a few test vehicles using public streets as their laboratory and a fully-developed, scaled-up system that becomes a real transport option for people,” he told the BBC.
Reference is made to the stock exchange release published earlier today, December 22, 2025, concerning the employee share purchase program and share allocation. For the December 2025 allocation, shares were sold at a price per share, excluding applicable discount, of NOK 30.1532 which equals the volume-weighted average share price of Aker Solutions on Euronext Oslo Børs from and including December 15, 2025, to and including December 19, 2025.
Under the December 2025 allocation, a total of 498 shares were allocated to Sturla Magnus, Executive Vice President, Selected Projects. Following the allocation, Magnus holds 245,238 shares in Aker Solutions.
Under the December 2025 allocation, a total of 498 shares were allocated to Hilde Karlsen, Employee Elected Director. Following the allocation, Karlsen, together with related parties, hold 33,896 shares in Aker Solutions.
Under the December 2025 allocation, a total of 498 shares were allocated to Rolf Arne Grønning, Deputy Employee Elected Director. Following the allocation, Grønning holds 33,532 shares in Aker Solutions.
Under the December 2025 allocation, a total of 498 shares were allocated to Geir Glømmi, Executive Vice President, Fixed Facility Alliance Projects. Following the allocation, Glømmi holds 20,822 shares in Aker Solutions.
Please see the attached notification for persons discharging managerial responsibilities in Aker Solutions in accordance with Regulation EU 596/2014 (MAR) article 19.