The audio version of this article is generated by AI-based technology. Mispronunciations can occur. We are working with our partners to continually review and improve the results.
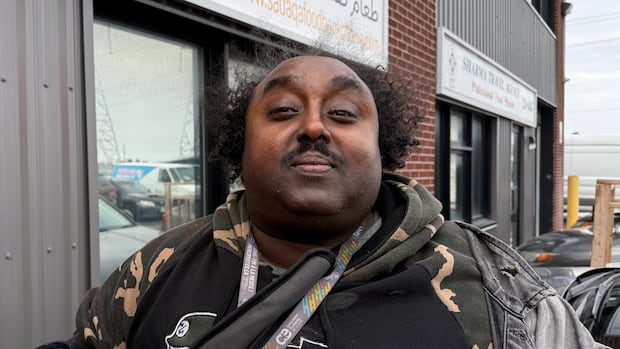
Over the past few months, Zak Khire had been budgeting extra time to reach the Sadaqa Food Bank — and even more to get home.
“It’s not like five, 10 minutes. It’s almost half an hour — more than a half-an-hour walk,” he said.
Sadaqa — which is only open on weekends — had been without bus service for eight months, after OC Transpo cut route 189’s Saturday and Sunday runs back in April.
For people like Khire, who relies on transit, it was less than ideal.
But that changed on Sunday. After months of complaints from clients, and advocacy from both Sadaqa and Knoxdale-Merivale Coun. Sean Devine, route 189’s weekend service was restored, reconnecting the Colonnade Road food bank to public transit for the first time since the spring.
“I’m really appreciative of the fact that we [can] take the bus now,” said Khire. “It saves me a headache.”
Sadaqa Food Bank manager Salim Jam says the loss of service only added to his clients’ hardships, many of whom already struggle with food insecurity, mobility challenges or limited income.
“It is very important for them to at least have this peace of mind that they are not going to sleep hungry,” he said.
Some people simply couldn’t make the trip at all, Jam said. They began asking for their food to be delivered, he said, a service the food bank didn’t have the capacity to provide.
Salim Jam says the end of the bus route’s weekend service was causing hardships for clients of the emergency food bank, one of five in Ottawa and the only one to offer halal options. (Cameron Mahler/CBC)
Only halal emergency food bank
Sadaqa is one of Ottawa’s five emergency food banks and the only one that provides halal food. It serves people from anywhere in the city when other food cupboards are closed, but it’s only open on Saturdays and Sundays — the same days the bus route had been cut.
Devine said that mismatched schedule made the situation urgent.
His office began working with the food bank and OC Transpo earlier this summer, after learning that clients were facing long walks or booking expensive taxi rides just to access free food.
Devine said the decision to restore the route “is not about the number of riders, but about the experience of the people who have lost that bus.”
OC Transpo ultimately agreed, restoring weekend service on Sunday.
“Their challenges are already tough enough and this is going to make their lives a little bit easier,” said Devine.
Jam says the return of a warm bus ride, especially heading into winter, makes a real difference for families trying to put food on the table.
“This is really something wonderful for them. They feel less worried about the food at least, and that’s what we’re here for,” said Jam.
Khire agrees.
“There’s a lot of people who come to this location,” he said, adding that now, “it’s going to be easy for them.”
BOISE, Idaho, 22 December 2025 – Clearwater Analytics (NYSE: CWAN) (“CWAN” or the “Company”), announced that it has entered into a definitive agreement to be acquired in a transaction valued at approximately $8.4 billion by a Permira and Warburg Pincus-led Investor Group (the “Investor Group”), with participation from Temasek. The Investor Group has key support from Francisco Partners.
After a thorough process including engaging with certain strategics and financial sponsors, the Special Committee of the CWAN Board of Directors, composed entirely of independent and disinterested directors, upon the advice of its independent outside legal counsel and financial advisor, unanimously recommended this transaction. The CWAN Board of Directors subsequently approved this transaction.
Under the terms of the agreement, CWAN stockholders will receive $24.55 per share in cash upon completion of the proposed transaction. The per share purchase price represents a premium of approximately 47 percent over CWAN’s undisturbed share price as of November 10, 2025, the last trading day prior to media reports regarding a potential transaction.
“This deal represents a great outcome for Clearwater Analytics and our stockholders,” said Sandeep Sahai, CEO, CWAN. “It also positions us well for our next chapter of growth. Operating as a private company will empower us to invest boldly as we integrate the platforms to deliver a next-generation front-to-back solution that natively addresses alternative assets, provides industry leading risk analytics, and delivers on agentic solutions powered by our unique and proprietary database. This will allow us to continue delighting our clients across global markets. We are thrilled to have the support of Permira and Warburg Pincus.”
“Both firms understand our business and the technology industry and have proven track records fostering growth for some of the largest and fastest-growing technology businesses globally. We look forward to building on our momentum and delivering advanced solutions for our clients and partners in the years ahead. I want to thank the Special Committee for the rigorous process and diligence with which they secured this outcome for our stockholders,” added Sahai.
“Clearwater Analytics continues to set the standard for excellence in the industry, and we are excited to invest behind the vision of creating an open, modular, front-to-back platform for institutional investment management,” said Alex Stratoudakis, Managing Director, Warburg Pincus. “We’re excited to leverage our deep financial technology expertise and partner with Permira and the CWAN team to drive the next wave of innovation and growth for the Company,” added Angel Pu Shum, Principal, Warburg Pincus.
“Clearwater Analytics built a single instance, multi-tenant platform for investment accounting in an industry that was and continues to be dominated by legacy solutions. We are excited about the vision for the platform and will continue to invest in building a true front-to-back solution by integrating the industry-leading solutions from Enfusion and Beacon. The next cycle will be shaped by AI and data, and we believe the business is positioned to continue to lead through this shift,” said Andrew Young, Partner at Permira. “We are very excited to back Sandeep and his team on their AI journey and in delivering a seamlessly integrated platform,” added Alberto Riva, Managing Director at Permira.
“The quality of Clearwater Analytics’ business and strength of its team are evident in the company’s growing leadership as it serves expanding segments of institutional investors across the US and Europe and, increasingly, delivers front-to-back solutions to these customers. We look forward to partnering with Warburg and Permira to drive the Company’s next phase of growth,” said Ashley Evans, Partner at Francisco Partners.
CWAN will continue to operate as usual during the pendency of the transaction, with the same commitment to clients, employees, and partners.
Certain Terms, Approvals and Timing
Following the recommendation of a Special Committee, the CWAN Board of Directors approved the merger agreement. The acquisition is subject to approval by CWAN’s stockholders (including a majority of votes cast by disinterested stockholders) and is expected to close in the first half of 2026, subject to customary closing conditions, including receipt of regulatory approvals.
Upon completion of the transaction, CWAN’s common stock will no longer be publicly listed on the New York Stock Exchange, and CWAN will become a privately held company.
The merger agreement provides for a “go-shop” period ending on January 23, 2026, during which CWAN, at the direction of the Special Committee and with the assistance of its advisors, will be permitted to actively solicit and evaluate alternative acquisition proposals, with a potential 10-day extension for certain parties that submit acquisition proposals during the initial go-shop period. There can be no assurance that this process will result in a superior proposal, and CWAN does not intend to disclose developments with respect to the go-shop process unless and until it determines that such disclosure is appropriate or otherwise required. CWAN will have the right to terminate the Merger Agreement to enter into a superior proposal, subject to the terms and conditions of the Merger Agreement.
The foregoing description of the merger agreement and the transactions contemplated thereby is subject to, and is qualified in its entirety by reference to, the full terms of the merger agreement, for which CWAN will file a Form 8-K with the Securities and Exchange Commission.
Advisors
PJT Partners is serving as the exclusive financial advisor, and Cravath, Swaine & Moore LLP is serving as legal counsel, to the Special Committee of the CWAN Board of Directors. J.P. Morgan is serving as the exclusive financial advisor, and Kirkland & Ellis LLP is serving as legal counsel, to CWAN. Goldman Sachs & Co. LLC is acting as financial advisor to the Investor Group. Private Credit at Goldman Sachs Alternatives provided 100% committed debt financing to the Investor Group. Latham and Watkins LLP is serving as M&A counsel to the Investor Group. Paul, Weiss, Rifkind, Wharton & Garrison LLP is serving as finance counsel to the Investor Group.
A former AFL star has been able to wipe millions of dollars in company debt and reopen the collapsed business a few hundred metres down the road, despite owing $4.5 million to staff, suppliers and the tax office.
Chris Knights, a former Adelaide and Richmond footballer, is the chief executive of marketing agency Zib Digital, which engaged in a process known as ‘legal phoenixing’, which allows a company to wind up and start again.
Mr Knights told staff in May he was closing the company’s doors, leaving about a third of its workforce without a job or their owed entitlements.
A former employee said staff were given a day’s notice that “we were surplus … and the business was put into administration”.
Four days later, Zib Digital registered a new ABN without the insolvent entity’s debts. It has reopened in an office close to its original inner Melbourne headquarters.
“Change is as good as a holiday and the new facility’s going to be built for purpose,” Mr Knights said during a company-wide meeting in May that was shared with the ABC.
The new company has opened a new office with the same signage, one street over. (ABC News: Billy Draper)
Zib’s actions are within the law but have raised questions about what some in the industry call “legal phoenix” legislation, which allows restructured insolvent companies to rise again with the same assets — but without the debts of the previous entity, and usually with fewer staff.
Scott Cowen, the assistant national secretary of the Australian Services Union, called the practice “legal trickery”.
“Once a worker finishes their job for the day, they expect to be paid,” he said
“We really need to look at reforming the laws in this area, because workers are definitely at the bottom of the pile when it comes to priority creditors in these situations.
“They’re really left powerless in terms of what they can do and in terms of what legal rights they have.“
Millions wiped
Mr Knights, lauded in an AFL article after the collapse of the company, has remained at the helm of the new entity, which owes more than $4.5 million.
“Don’t be afraid to make mistakes, that is where growth and wisdom come from,” he told the AFL this year.
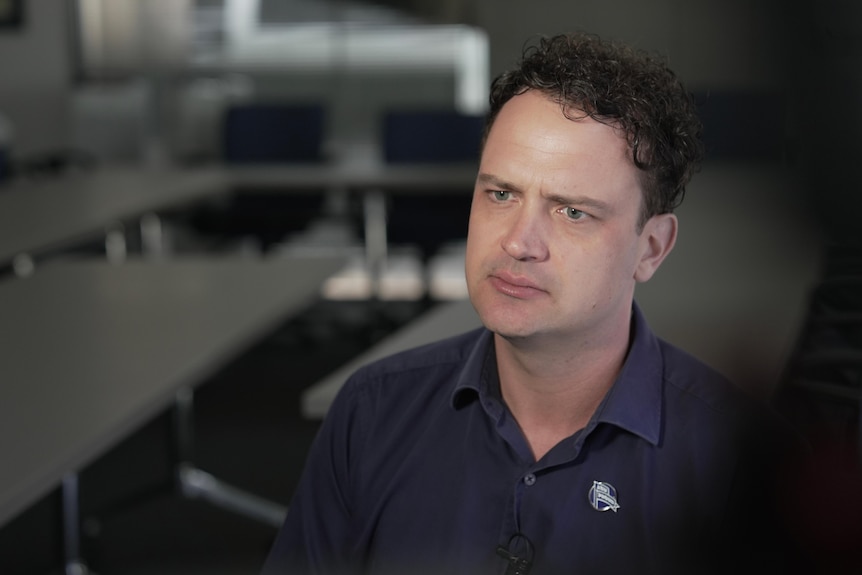
Former AFL player Chris Knights is CEO of Zib Digital. (AAP: Ben Macmahon)
According to the administrators’ report, the insolvent business has debts to staff, suppliers and the Australian Taxation Office (ATO).
Of that, $3.8 million is owed to subsidiaries and external suppliers, while staff are owed almost $450,000 in entitlements, and the ATO is owed almost $350,000.
Unpaid entitlements continue to plague Australian workers. This month, the ATO said $1.1 billion in unpaid super had been returned to nearly a million individuals’ super funds in 2024-25, with $200 million raised by the ATO in penalties.
Former employees who agreed to speak to the ABC anonymously said Zib told them to apply for the Fair Entitlements Guarantee (FEG), meaning taxpayer dollars would fund financial assistance as part of a safety net when companies go under.
“It was very much like, ‘How is this even possible?’ when … about three weeks before this happened we were meant to be going to the Philippines to celebrate how wonderful our year was,” a former staff member said.
In a statement to the ABC, Mr Knights said: “We’ve been navigating an extremely challenging economic period.
“Our industry, in particular, has experienced a sharp decline in advertising spending since the end of COVID, which has forced many major media and digital organisations to make difficult redundancies.
“No-one ever wants to let people go but, unfortunately, market conditions made it unavoidable.
“Throughout the process, we appointed an external administrator and followed their guidance and all required procedures diligently and correctly.”
Same name, same logo, new ABN
A staff member who was not made redundant said that, when the business went insolvent, he was given 24 hours to sign a contract with a new company, Zib Holdings.
In an email seen by the ABC, his manager confirms “the only thing that changes is the name of your employer”.
The former employee says he was given 24 hours to sign a contract with a new company, Zib Holdings. (ABC News: Billy Draper)
“Same name, same logo, same communications [and] emails — nothing changed,” the employee, who is no longer with the company, told ABC News.
“The communications were not to let clients know — business as usual. There was no difference to the previous business and the current business.“
According to the Australian Securities and Investments Commission (ASIC), Zib Digital’s ABN closed on May 19 and entered into administration. On May 23, a new ABN was registered under Zib Holdings.
It was not until the former staff member spoke to the administrator that he realised he had not been paid superannuation since March, something not covered by the FEG scheme.
“It’s really hard to now believe people on face value, given that we were told that we were excellent and everything was going great and the business is very profitable, to find out almost within a couple of days that the messaging had changed and this had happened,” the ex-employee said.
During a company-wide meeting after the business entered voluntary administration, Mr Knights referred to the insolvency as a “restructure” that had been planned for some time.
During the same meeting, one of Zib’s executives told staff the way to remove “frustrations” within the business was to “create a slightly leaner business, keep the right people in the right seats and ensure that people are being listened to”.
“There’s no impact on the client, so finance stays the same because we always bill the client from Zib Production,” the executive said.
About a month after the business entered voluntary administration, the new company opened an office a street away from the old business, with the same signage.
“The interesting thing for me about the whole thing is that this seems like it’s maybe a loophole that you can get away with if nobody talks about it,” a former employee said.
“Basically a business can just hand their debts over to the federal government and have them pick up the bill.“
‘Legal phoenixing’ used to wipe slate clean
The practice of phoenixing — where directors of a company deliberately shut the business to avoid debts, by transferring assets to a new company without paying true or market value — is illegal.
Corporate regulator ASIC has described illegal phoenixing as giving companies “an unfair advantage” because they have less debt and lower operating costs than other businesses.
However, there are lawful processes that can be used to wind up businesses and wipe debts, for example, a small business restructure. In Zib’s case, it used the insolvency process and then sold the assets to a new company for market value.
Zib’s administrator Adrian Hunter said the insolvency process was about making the most of a failed company’s assets and distributing money to creditors via a structured framework.
He said it allowed companies to essentially “start again”.
“[It’s known as] a ‘legal phoenix’, which is the lawful restructuring of an entity where the assets of the old insolvent company are sold at true market value to another entity, which is often a related party,” Mr Hunter, a partner at RSM Australia, said.
He argued it was a better outcome than if a company were to close down altogether.
“The value achieved for the sale of these distressed assets exceeds what would be realised in a forced sale liquidation scenario and generates a greater return for the insolvent company’s creditors,” he said.
But Mr Cowen from the ASU was critical of this kind of company restructuring and said it should not be used by companies as a way of getting out of paying their workers what they are owed.
“If we have a situation where a company can wind up one day, wipe its debts, have the taxpayer foot the bill for some of their employee entitlements, and open up … under a different legal name, you really need to question whether the law is fit for purpose.”
Scott Cowen says workers expect to be paid for the jobs they do. (ABC News: Patrick Stone)
Mr Cowen said the union had seen this practice across a number of industries and it was unfair on the workers, but also taxpayers, who ended up covering the salaries of unpaid workers once they went to to FEG.
“Sometimes [workers] see a notice posted on the office door, they can’t come into work because the company’s closed up, only to open up again in a few days time under a different legal trading name.”
In a statement to the ABC, a spokesperson for the ATO said it could not comment on individual cases, but “if a company is wound up in insolvency, the ATO will pursue recovery of outstanding debts owing to it through the liquidation process”.
“If there are insufficient funds after paying the liquidator’s or trustee in bankruptcy’s costs and priority creditors, the debt owing to the ATO is generally written off as irrecoverable at law.”
Sponsored staff lose thousands
Many of those made redundant from Zib could apply to the FEG scheme, but some were not entitled to.
Renee was sponsored by the company to work in Australia and said she was owed almost $20,000 in entitlements.
The Dutch woman, who asked that ABC News use only her first name, worries she will never see the money because the FEG scheme does not cover employees on sponsorship visas.
Renee said she had been encouraged to engage a lawyer, but would instead return to the Netherlands in January, a decision greatly influenced by her experience at Zib.
“Businesses can have financial hardship, that’s inevitable. But there is a huge difference in handling this with a human approach,”
she said.
Other staff said the impact of Zib’s manoeuvring affected them greatly.
“I think it’s the way that it’s been done, where it’s, ‘We don’t have any money’, but yet they’ve moved down the road,” one said.
“They’re telling clients nothing’s changed, everything’s still status quo.
“And yet there’s all of us who are left with nothing.”
Some staff have received their FEG entitlements, but say thousands of dollars were missing because there is a maximum weekly wage cap of $2,793 applied to all FEG payouts (meaning if you make more than that in a week, you miss out).
“It’s been really tough and I think the financial side of it is probably less so than the mental side of it. I was pretty broken,” another former employee said.
“I think if you’re going to make somebody redundant, you need to do it in the right way, which is provide them a runway to at least find another opportunity.
“I think it’s a really inhumane way of going about it.“
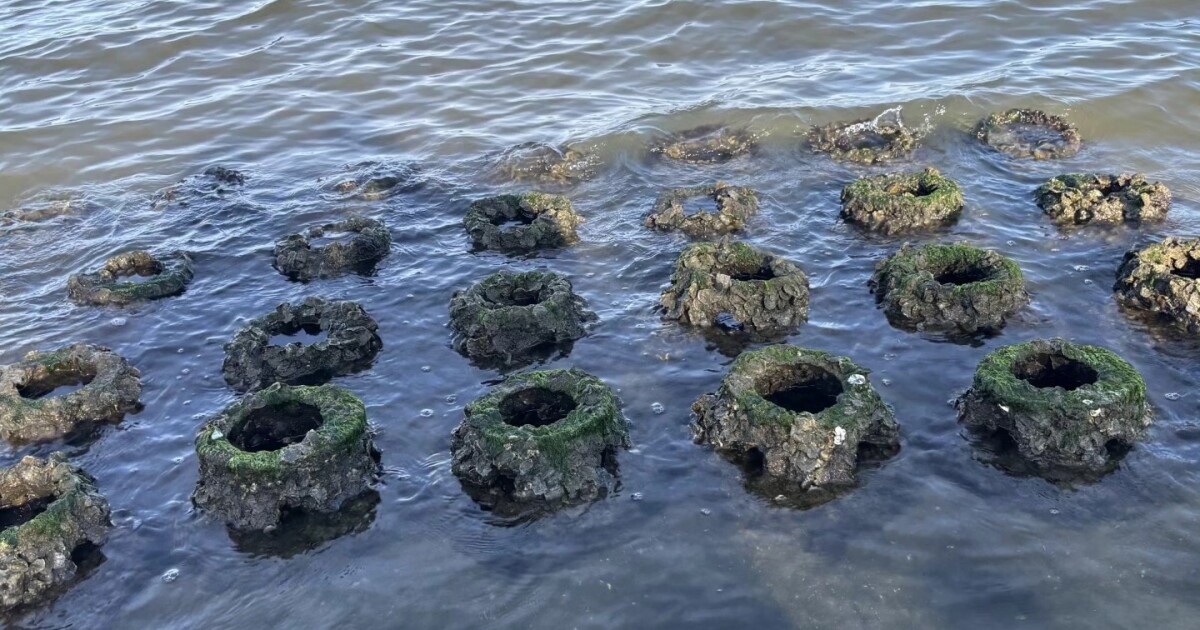
One year after oyster reef balls were installed along the shoreline at Riverview Park in Sebastian, early monitoring indicates the restoration project is beginning to meet its goals, according to the Ocean Research and Conservation Association.
The Indian River County park is the site of a multi-habitat restoration effort designed to address shoreline erosion while improving ecological function, said Natalie Stephens, a research assistant with ORCA.
“Riverview Park is a multi-habitat restoration project located in Sebastian,” Stephens said.
The project used two primary coastal restoration techniques, beginning with the installation of a living shoreline in November 2024. That phase incorporated modular oyster reef balls alongside native vegetation to reduce erosion and support habitat.
“We used two targeted coastal restoration techniques. The first phase was our living shoreline, which was installed in November of 2024, where we wanted to help stabilize the shoreline using green infrastructure as well as native plantings,” Stephens said. “That’s where we used the module-type oyster reef balls.”
Placed just offshore, the reef balls are designed to soften wave energy while also serving as habitat for marine life.
“Those are placed in the water to help with wave energy, wave abatement, and also help stabilize the shoreline,” Stephens said. “In addition, as a secondary benefit, they can recruit oysters in the area of their presence and provide that substrate for them to live and grow on.”
The reef installation was paired with changes along the upland edge of the shoreline, where turfgrass was replaced with native plants to better manage stormwater.
“The buffered shoreline, which was the second phase of this Riverview Park multi-habitat restoration project, was where we replaced a turfgrass lawn with native vegetation,” Stephens said. “What that does is help slow the flow of stormwater runoff.”
Stephens said the site was selected because of clear signs of long-term erosion caused by both routine wave action and storm impacts.
“This area was carefully chosen because we really saw the need for shoreline restoration,” she said. “That was because of shared evidence of shoreline erosion that was occurring at this site from continual wave action as well as severe hurricane impact over the years.”
She added that the project also supported broader local goals.
“In addition to that, this project aligned with the City of Sebastian’s sustainability plan, so it really provided a wonderful opportunity to show the benefits of both of these restoration techniques,” Stephens said.
Environmental pressures such as rising sea levels have made shoreline restoration increasingly urgent, she said.
“Of course, we have added issues like sea level rise,” Stephens said. “Areas can’t withstand this accelerated erosion.”
ORCA will continue to monitor the Riverview Park site quarterly for the next two to three years, tracking indicators such as water quality, shoreline slope and oyster recruitment. Early data suggests the project is already having an impact.
“So far, the results have been promising,” Stephens said. “We have seen evidence of shoreline accretion in as little as six months. We’ve also seen a large amount of oyster recruitment and growth on the reef balls at the one-year mark.”
Stephens said the reef balls were surveyed again last week, revealing continued growth compared with previous monitoring periods.
Looking ahead, ORCA plans to apply similar techniques at other locations.
“We have a living shoreline that we installed in April of 2024 at Riverside Park,” Stephens said. “We also have a few different projects on the horizon, including a proposed living shoreline behind a homeowners association in Martin County, as well as another living shoreline in the Sebastian Inlet District that we’re looking to be a part of.”
Paralyzed in 2022, the patient received a CAS brain-computer implant in 2025 and soon controlled devices
A patient involved in a BCI clinical trial plays a racing game at his home in Shanghai. PHOTO: CHINA DAILY
A patient suffering from tetraplegia steered a smart wheelchair through the neighborhood with only his thoughts and directed a robotic dog to fetch a food delivery. These scenes were achieved during a recent clinical trial of a brain-computer interface conducted by a team from the Chinese Academy of Sciences (CAS).
This shattered the conventional boundaries of rehabilitation, carrying the brain’s command from a two-dimensional cursor on a screen into full-bodied, three-dimensional interaction with the physical world.
Brain-computer interfaces are designed to create a direct communication channel between the brain and external devices. Around the world, research groups have already demonstrated the laboratory feats, including “mind typing” and robotic-arm control. The enduring challenge is to make those systems reliable enough to vanish into a patient’s daily life.
The patient became quadriplegic in 2022 due to a spinal-cord injury and received the brain-computer-interface system, developed by the Center for Excellence in Brain Science and Intelligence Technology under the CAS, in June 2025. Within weeks of training, he can reliably control a computer cursor and a tablet.
The researchers employed a high-throughput wireless invasive brain-computer interface system to enable the patient to stably control a smart wheelchair and a robotic dog using neural signals, achieving autonomous mobility and object retrieval in real-world settings.
Read More: China pioneers commercial use of supercritical CO2 power generation
It signifies that China’s research in the field is shifting from merely restoring basic interaction to expanding the real-life horizons of paralyzed patients.
The team also creatively fused two distinct decoding strategies to distill meaningful commands from noisy neural activities and boost the overall brain-control performance by more than 15 percent.
Moreover, the researchers squeezed the system’s end-to-end latency, from neural pickup to command execution, under 100 milliseconds which is below the body’s own reaction time, giving the patient control that feels fluid and natural.
SAN FRANCISCO (KGO) — Some power has been restored to San Francisco on Saturday night after about 130,000 customers — 30% of the city — were blacked out.
PG&E’s online outage status reported the number of customers without power had fallen to 95,280, or 23% of San Francisco, at 8:50 p.m. As of 9:45 p.m., PG&E said 70% of its customers’ power had been restored.
Mayor Daniel Lurie confirmed in a 10 p.m. Saturday update that customers were seeing their power restored.
A PG&E spokesperson told ABC7’s Anser Hassan that more power would be restored around midnight.
As of Sunday at 11:30 a.m., PG&E restored power to 110,000 customers. The utility company says it’s working to bring back power to 20,000 customers primarily in the Presidio, Richmond District, Golden Gate Park and small areas of downtown San Francisco.
Outages were first reported Saturday in the Inner Sunset neighborhood at about 9:40 a.m., affecting about 14,700 customers. At 10:10 a.m., more outages were reported impacting about 25,000 customers in the Richmond District, the Presidio, Golden Gate Park, Inner Sunset District, and near the Civic Center.
Scattered outages were later reported in parts of the Tenderloin and downtown before spreading to several areas around the city, including parts of the Mission District, the Chase Center, the Western Addition and other neighborhoods.
San Francisco city officials asked the public to not call 911 to report power outages, “unless there is a life safety emergency. Keep 911 phone open for emergencies.”
Lurie asked the public to stay off the streets because many traffic lights were out across the city.
The problem was centered on a substation at 8th Street and Mission Streets in the South of Market neighborhood, Supervisor Matt Dorsey said on social media. The San Francisco Fire Department said they were on the scene of a fire at the substation, which was reported at 2:14 p.m.
“We are still not clear when power will be restored to over 130,000 customers,” Lurie said on social media. “So what I am going to ask all of you to do is, if you do not need to go out tonight, stay home, be safe.”
Around 8 p.m., much of upper Market Street was still blacked out — and on one of the biggest shopping days of the year, which was a big concern for Dorsey, who represents the South of Market district.
“The Saturday before Christmas is historically one of the busiest shopping days of the year. We’ve got the Warriors game. We’ve got the ballet. We’ve got the symphony and everything going on. This is the worst time PG&E could have a problem,” Dorsey said.
San Francisco District 5 Supervisor Bilal Mahmood said the city had been using all its resources to help PG&E restore power.
“This is unacceptable. I have never seen anything like this over the decade I have been here in San Francisco. There will have to be further investigation and questions that have to be answered about what went wrong,” Mahmood said.
PG&E is still investigating the cause of the fire. But PG&E Spokesperson Tamar Sarkissian said progress was being made, with thousands getting power back by just after 8:45 p.m.
“We have restored about approximately 88,500 of our customers. So, there is about 42,000 that remain impacted. So, about that’s about 70% of customers who have been restored,” Sarkissian said.
Dorsey said the same substation was responsible for a blackout on Dec. 21, 2003, affecting about 120,000 customers at the time.
There was rain forecast Saturday, but there was no indication if the weather played any role in the outage. More rain was forecast for Saturday evening and for the next six days. Wind gusts could reach up to 25 mph Saturday, according to the National Weather Service.
LIVE: Track rain in San Francisco Bay Area with Live Doppler 7
Power outage affecting BART, Muni service
BART closed Civic Center station due to the PG&E power outage. Powell Street had also been closed but reopened in the early evening. BART green lines were running with limited service between Berryessa and Daly City and red line trains were suspended between Richmond and Millbrae. All BART services were up and running by 11 p.m. Saturday.
The SFMTA said Muni trains were not getting underground into Muni Metro or Central Subway. “Muni shuttle service is running between West Portal and Caltrain, and to consider the 8, 30, 45 for Central Subway. Avoid non-essential travel.” More Muni updates can be found here.
Traffic, business impacts
The outage caused gridlock in parts of downtown San Francisco with traffic lights out at major intersections. Traffic signals in the affected areas should be treated as four-way stop signs, the San Francisco Department of Emergency Management said.
It also forced the closure of some businesses, including the Walgreens on Market and Ninth Street.
Autonomous ridesharing service Waymo said on its app that service had been paused in the city.
Waymo’s app shows that services are currently paused during San Francisco’s mass power outage.
Waymo App
The blackout also affected Internet service by some providers, including Monkey Brains.
RELATED: Videos show Waymo cars stuck at San Francisco intersections during massive power outage
Waymo, the operator of driverless ride-hailing vehicles, was also impacted by the massive power outage in San Francisco.
Orpheum Theatre, Chase Center impacted
The outage interrupted Saturday’s matinee performance of Moulin Rouge at the Orpheum Theatre. The show was cancelled.
“And we saw about five minutes of it, and then the power went out. And we sat there for about half an hour, and it never came back on, and they said the show would be cancelled. So, we’re all sitting out here now, disappointed,” one attendee told ABC7.
ABC7 also confirmed there was a brief power outage at San Francisco’s Chase Center that lasted from 1:30 p.m. to 2 p.m.
The holidays are supposed to be busy in a good way — full calendars, full plates and full houses.
But every year, emergency rooms fill up too. Slips on icy steps. Kitchen cuts. Chest pain after one too many indulgent meals. But many of these visits are preventable with some caution and planning.
“During the holidays, we see a predictable increase in ER visits related to accidents, overexertion and stress,” says Steven Valassis, MD, an emergency medicine physician at Hartford HealthCare St. Vincent Medical Center. “A little awareness goes a long way in keeping people safe and out of the hospital.”
Here are 10 simple, realistic ways to protect your health and avoid the ER this holiday season.
1. Watch the weather and your footing
Snow, ice and wet leaves are a recipe for falls, especially on steps and driveways.
When the weather gets wintry, make sure you
Wear shoes with good traction
Clear walkways as soon as possible
Take your time when walking outside
If it’s icy, hold onto railings
Avoid carrying heavy items that throw off your balance.
> Related: Urgent or Emergent? Everything You Need to Know
2. Slow down in the kitchen
Holiday cooking is often rushed and crowded. And that’s when accidents happen.
Keep knives sharp, use cutting boards and never leave cooking unattended. If you’re frying, baking or using open flames, stay nearby and alert.
“We see an increased in cuts and burns this time of year,” says Dr. Valassis. “Most happen when people are multitasking or distracted.”
3. Enjoy holiday food in moderation
Rich meals, heavy desserts and extra salt can take a toll — especially if you have heart disease, diabetes or digestive issues.
But you don’t have to skip your holiday favorites. Just pace yourself, eat smaller portions and listen to your body when it says it’s had enough.
Eating past the point of comfort is a common trigger for chest pain and serious stomach issues around the holidays.
> Related: The Holiday Food Advice You’ll Actually Want to Follow
4. Stay hydrated, even if you’re celebrating
Holiday schedules tend to throw routines out the window — including how much water you drink.
And to make matters worse, holiday staples like alcohol, caffeine and salty foods can quietly dehydrate you.
Make it a habit to drink water throughout the day, especially if you’re enjoying cocktails or traveling, to keep headaches, dizziness and kidney issues from hampering your fun.
5. Lift smart while you prep for the holidays
Between boxes of decorations and heavy gifts, the holiday season can take a toll on your back.
Twisting or rushing through heavy lifting quickly leads to muscle strains that can sideline you for weeks.
Bend at your knees, keep items close to your body and avoid twisting. If it feels too heavy, it is — don’t be afraid to ask for help.
6. Travel safely, no matter the distance
Whether it’s a long drive across the country or a quick trip across town, holiday roads come with extra risk.
“Car accidents are a major cause of holiday ER visits,” Dr. Valassis says. “Simple precautions save lives.”
Be sure to buckle up and avoid driving if you haven’t gotten enough sleep. Build extra time into travel plans so you don’t have to rush, and never drive after drinking. Taking these basic steps can significantly reduce your risk of injury — and help you avoid the ER while traveling this holiday season.
7. Don’t let stress become a factor
The holidays bring a lot of joy, but sometimes, they bring just as much stress.
“Stress can raise blood pressure, amplify heart conditions and weaken your immune system,” says Dr. Valassis.
Overcommitting to activities and falling behind on down time can quickly cause physical symptoms. Prioritize sleep, build in breaks and don’t be afraid to say no.
> Related: 6 Healthy Ways to Reduce Stress Around the Holidays
8. Look out for fire risks
Candles, tree lights and fireplaces might be cozy, but they come with a risk.
That’s why burns and smoke inhalation are so common this time of year. Luckily, they’re also preventable.
Keep candles away from flammable items, and never leave them unattended. Check cords for fraying, and unplug lights and heaters before bed or when leaving the house.
9. Be mindful of allergies
Homemade baked goods don’t always come with a label – and they seem to show up at every holiday gathering.
“Allergic reactions can escalate quickly,” says Dr. Valassis. “It’s important to catch them early.”
If you have food allergies and sensitivities, don’t be afraid to ask questions before you dig in. And if you’re prone to seasonal allergies, keep medications on hand.
> Related: Which Allergy Medicine Is Right for Me?
10. Listen to your body
It might sound simple, but trusting your instincts is key.
If something feels off — chest pain, trouble breathing, severe pain or sudden weakness — don’t brush it off.
“The goal isn’t to avoid care when you need it,” Dr. Valassis says. “It’s to avoid preventable emergencies so you can enjoy the holidays safely.”
The holidays don’t have to come with an ER visit
With a little planning and some extra awareness, you can protect your health, avoid the ER, and keep the focus where it belongs – spending time with the people you love.
“A few thoughtful choices can make a big difference in helping you avoid the ER,” Dr. Valassis says.
SAN FRANCISCO — Power was restored Sunday morning to the bulk of the 130,000 homes and businesses in San Francisco impacted by a massive outage on Saturday that caused major disruptions in the city.
Pacific Gas and Electric Co.’s outage map showed more than 20,000 customers still remained without electricity as of 5 a.m. PST, while crews worked to fully restore service.
The outage, which occurred shortly after 1 p.m. on Saturday, left a large swath of the northern part of the city without power that began to grow in size. At its peak, the outage represented roughly one-third of the utility company’s customers in the city.
Social media posts and local media reported mass closures of restaurants and shops and darkened street lights and Christmas decorations on Saturday, one of the busiest shopping days of the year.
The San Francisco Department of Emergency Management said on X there were “significant transit disruptions” happening citywide and urged residents to avoid nonessential travel and treat down traffic signals as four-way stops. Waymo, the operator of driverless ride-hailing vehicles, suspended its services. At least one video posted on social media appeared to show a Waymo vehicle stopped in the middle of an intersection.
Some of the blackouts were caused by a fire that broke out inside a PG&E substation at 8th and Mission streets, fire officials posted on X at about 3:15 p.m. The full cause remained under investigation.
At about 4 p.m.., PG&E posted on X that it had stabilized the grid and no further outages were expected.
The Indian computer emergency response team (CERT-In) has issued an advisory for WhatsApp users warning them of a ‘device-linking’ feature that can allow attackers to take ‘complete’ control of their account. The advisory, accessed by news agency PTI says that the vulnerability called ‘GhostPairing’ put users’ messages, photos, and videos on the web version at risk. “It has been reported that malicious actors are exploiting WhatsApp’s device-linking feature to hijack accounts using pairing codes without authentication requirement,” the cyber agency said in the advisory.“This newly identified cyber campaign called GhostPairing enable cyber criminals to take complete control of WhatsApp accounts without needing password or SIM swaps,” the advisory said.For those unaware, CERT-In is the national technology arm under the Ministry of Electronics and Information Technology (Meity) to combat cyber attacks and guarding of the Indian Internet space.
The WhatsApp Scam That Gives Hackers Your Phone!
What is GhostPairing
GhostPairing is a type of WhatsApp attack where hackers secretly link their own device to a victim’s WhatsApp account, giving them almost full access without the victim noticing. The attack works by tricking users into entering their phone number on a fake website that looks like Facebook or WhatsApp.According to the advisory, the scam usually starts with a message such as “Hi, check this photo” that appears to come from a trusted contact. The message includes a link with a Facebook-style preview. When users click it, they are taken to a fake Facebook viewer page that asks them to “verify” to see the content. At this stage, attackers exploit WhatsApp’s “link device via phone number” feature by convincing users to enter their number. Once they do, the attacker’s browser becomes a hidden, trusted device — allowing them to take over the WhatsApp account.Once linked, attackers can read synced messages, receive new chats in real time, view photos, videos, and voice notes, and even send messages to the victim’s contacts and group chats.
How to stay safe
The advisory warns users not to click on suspicious links, even if they appear to come from known contacts, and to never enter their phone number on external websites claiming to be WhatsApp or Facebook.