- Drivers urged not to leave gifts and valuables on show in run-up to Christmas Nottinghamshire Police
- ‘Don’t have them out’: Police warn about leaving holiday gifts in cars WTOP
- Happy Holidays! Here are a few shopping safety tips to remember this season 🎄🎁 facebook.com
- Christmas shoppers reminded to ‘Lock it or Lose it” this holiday season 94.1 St.ThomasToday.ca
- Mall safety tips for this festive season The Citizen
Category: 3. Business
-
Drivers urged not to leave gifts and valuables on show in run-up to Christmas – Nottinghamshire Police
-

Govt revises net metering policy, cuts solar buyback rate
The Ministry of Energy has approved a major revision to Pakistan’s net metering policy, significantly altering the framework for solar power consumers across the country.
Sources in the National Electric Power Regulatory Authority (Nepra) said the decision was finalised after months of consultations with key stakeholders, including power distribution companies (Discos) and regulatory bodies. Under the revised net billing mechanism, solar consumers will now be compensated at a fixed rate of Rs11 per unit for electricity exported to the national grid.
Officials said the duration of solar power agreements has also been reduced to five years. Unlike the previous net metering regime — under which excess electricity generated by consumers was adjusted against their total consumption — the new system introduces a fixed per-unit compensation rate to be determined by Nepra. Electricity drawn from the grid will continue to be billed at the prevailing Nepra-approved tariff.
Under the earlier policy, solar consumers received a much higher buyback rate of Rs25.98 per unit. However, officials said the revised framework aims to align solar incentives with evolving market conditions and ensure long-term grid sustainability.
Sources further said that all solar installations with a load of up to 25 kilowatts will now require a licence from Nepra. Previously, domestic, commercial and industrial consumers installing systems within this capacity were exempt from licensing requirements.
The Ministry of Energy has informed the federal government that continuation of the old net metering policy was no longer viable due to mounting financial and operational pressures on the power sector.
Ministry officials maintained that the determination of solar tariffs falls under Nepra’s mandate and that tariff structures and regulatory frameworks are periodically revised in line with sectoral needs. They also sought to reassure consumers, saying the revised policy is unlikely to have a significant impact on the majority of solar users.
Continue Reading
-
Rocket Lab Successfully Launches for iQPS, Ends 2025 with 21 Launches and 100% Mission Succes
December 21, 2025. MAHIA, New Zealand: Rocket Lab Corporation (Nasdaq: RKLB) (“Rocket Lab” or “the Company”), a global leader in launch services and space systems, today successfully launched its 21st Electron rocket of the year to deploy the latest satellite to space for multi-launch customer Institute for Q-shu Pioneers of Space, Inc. (iQPS), a Japan-based Earth imaging company.
‘The Wisdom God Guides’ mission launched from Rocket Lab Launch Complex 1 in New Zealand on December 21 at 7:36 p.m. (06:36 UTC) to deploy the QPS-SAR-15 to space for iQPS. The spacecraft will join the company’s synthetic aperture radar (SAR) constellation providing near-real time imagery across twelve different orbits for iQPS’ global customers. Rocket Lab first launched for iQPS in 2023 and has gone on to deploy seven satellites to the iQPS constellation, making Electron the primary launcher for iQPS. A further five launches on Electron for iQPS are planned from 2026.
Today’s mission has set a new annual launch record for Electron: 21 launches in one year with 100% mission success. The record cements Electron as both America’s preeminent small launch provider and the world’s most frequently-launched small-lift orbital rocket.
Rocket Lab founder and CEO, Sir Peter Beck, says: “Congratulations to iQPS on this latest successful mission for their constellation, and to the Rocket Lab team on a fantastic record-setting year of Electron launches. Electron makes frequent and reliable launch look easy as it outpaces all other American small-lift orbital rockets, year after year. In 2026 we’re expanding Electron’s global reach with more multi-launch constellation deployments, dedicated missions for domestic civil space and international space agencies in Japan and Europe, and both suborbital and orbital launches with defense applications for hypersonic technology and national security. Our new record of annual launches and the breadth of upcoming missions goes to show how much of a global impact Electron continues to have on the space industry, and we’re looking forward to another year of continued execution in 2026.”
‘The Wisdom God Guides’ mission was Rocket Lab’s 79th overall Electron mission and final scheduled launch for 2025. The next Electron launch is slated to take place in early Q1 2026.
‘The Wisdom God Guides’ launch images: F79 | The Wisdom God Guides
‘The Wisdom God Guides’ launch broadcast: Rocket Lab – ‘The Wisdom God Guides’ Launch
ENDS
Rocket Lab Media Contact
Murielle Baker
media@rocketlabusa.comAbout Rocket Lab
About Rocket Lab Rocket Lab is a leading space company that provides launch services, spacecraft, payloads and satellite components serving commercial, government, and national security markets. Rocket Lab’s Electron rocket is the world’s most frequently launched orbital small rocket; its HASTE rocket provides hypersonic test launch capability for the U.S. government and allied nations; and its Neutron launch vehicle in development will unlock medium launch for constellation deployment, national security and exploration missions. Rocket Lab’s spacecraft and satellite components have enabled more than 1,700 missions spanning commercial, defense and national security missions including GPS, constellations, and exploration missions to the Moon, Mars, and Venus. Rocket Lab is a publicly listed company on the Nasdaq stock exchange (RKLB). Learn more at www.rocketlabcorp.com.Forward Looking Statements
This press release contains forward-looking statements within the meaning of the Private Securities Litigation Reform Act of 1995. We intend such forward-looking statements to be covered by the safe harbor provisions for forward-looking statements contained in Section 27A of the Securities Act of 1933, as amended (the “Securities Act”) and Section 21E of the Securities Exchange Act of 1934, as amended (the “Exchange Act”). All statements contained in this press release other than statements of historical fact, including, without limitation, statements regarding our launch and space systems operations, launch schedule and window, safe and repeatable access to space, Neutron development, operational expansion and business strategy, are forward-looking statements. The words “believe,” “may,” “will,” “estimate,” “potential,” “continue,” “anticipate,” “intend,” “expect,” “strategy,” “future,” “could,” “would,” “project,” “plan,” “target,” and similar expressions are intended to identify forward-looking statements, though not all forward-looking statements use these words or expressions. These statements are neither promises nor guarantees, but involve known and unknown risks, uncertainties and other important factors that may cause our actual results, performance or achievements to be materially different from any future results, performance or achievements expressed or implied by the forward-looking statements, including but not limited to the factors, risks and uncertainties included in our Annual Report on Form 10-K for the fiscal year ended December 31, 2024, as such factors may be updated from time to time in our other filings with the Securities and Exchange Commission (the “SEC”), accessible on the SEC’s website at www.sec.gov and the Investor Relations section of our website at https://investors.rocketlabcorp.com which could cause our actual results to differ materially from those indicated by the forward-looking statements made in this press release. Any such forward-looking statements represent management’s estimates as of the date of this press release. While we may elect to update such forward-looking statements at some point in the future, we disclaim any obligation to do so, even if subsequent events cause our views to change.Continue Reading
-
Govt introduces changes to solar net metering policy, launches new billing system – Hum News English
- Govt introduces changes to solar net metering policy, launches new billing system Hum News English
- NEPRA introduces new regulations for net metering users The Express Tribune
- Axe may fall on prosumers to save power utilities Dawn
- Pakistan revises net metering policy for solar consumers Daily Times
- Hebei Juhang Energy Technology plans solar panel factory in Pakistan pv magazine International
Continue Reading
-

Food truck plan for Oxenhope’s Millennium Green
The proposal to the authority, by applicant Rachel Coe, said: “The proposal introduces a small-scale, modern feature into the green.
“The introduction of a catering trailer will deliver a clear community facility, enhancing the social and economic vitality of Oxenhope, increasing local activity and visitor engagement with the Millennium Green and thereby outweighing any limited adverse impact.
“The applicants intend this to be a short-term measure to start their business. The long-term goal is to find premises within the village and have a cafe.”
Continue Reading
-

‘Iconic’ Nottingham city centre vintage shop to close
Mr Hague, from Hertfordshire, has worked in the vintage clothing business on and off since the 90s, and took on the store in 2023 as he “couldn’t bear” to see it close.
He added: “I have been aware of Nottingham coming up here in the 90s to get stock from Robin. I sort of got to love the city through that.
“Clothes and music have always been part of my life, it was very much led by the heart.
“Robin and Mary worked really hard for 37 years. They rarely took holidays and dedicated their lives to it.
“When it became available I did not think it was going to be the best idea financially, but I really wanted to give it a go.
“We have always had a great team. That is the saddest thing, that we have had to give notice [to staff] and that is a real tragedy.”
The last day of trading is set to be New Year’s Eve.
Continue Reading
-
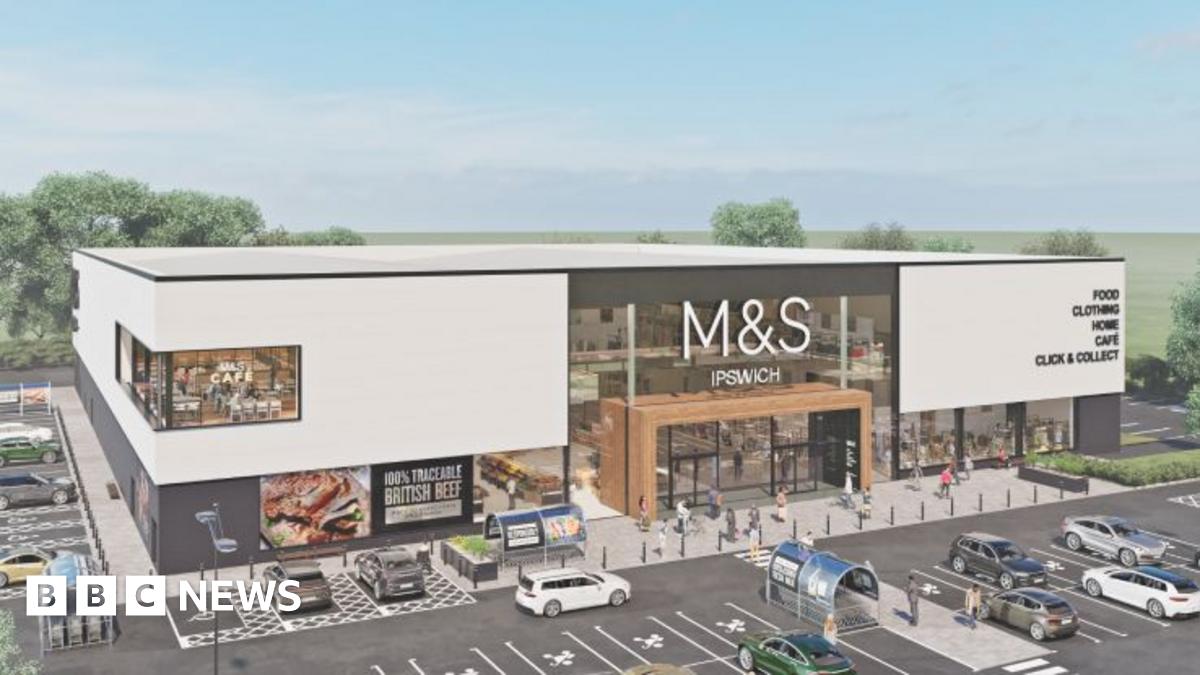
Ipswich Copdock Toys R Us: What will happen to M&S in town?
Helen Davies, Babergh councillor for Sproughton & Pinewood, which encompasses the site, told the meeting that ever since she had moved to the ward in 2011, the site had always been “a little bit run down”.
“It’s lain derelict for ages, and I think we are all well aware that the nature of shopping has changed,” she said.
“I try and make an effort to do my shopping physically, but I fail dismally at times, especially now, and it is a lot easier for us to go to an outside retail area because generally you can park pretty easily, so you can do your bigger purchases there.
“The site is rundown, it’s fenced off, it would be great to have it back into use, but I also feel we need to make certain that the Ipswich store is protected to a degree.”
She said she had felt some promise of this from M&S, but said there was still a risk.
Ipswich Borough Council, prior to the decision, said it was in support of the proposal.
In a letter within the planning documents, its head of planning and development acknowledged that while the new store would have an impact on the town centre, “there are reasons to be optimistic about the direct of travel in the town centre that will keep footfall and investor sentiment high”.
Continue Reading
-
Proximal guided hybrid federated learning approach with parameter efficient adaptive intelligence for pneumonia diagnosis
Carter, M. J. et al. Evaluation of Acute and Convalescent Antibody Concentration Against Pneumococcal Capsular Polysaccharides for the Diagnosis of Pneumococcal Infection in Children with Community-Acquired Pneumonia. Pediatr. Infect. Dis. J. 43(2), E67–E70. https://doi.org/10.1097/INF.0000000000004185.
Duan, B. Advances in Pneumonia Detection: A Comprehensive Investigation of Federated Learning and Deep Learning-Based Approaches, in scitepress.org, pp. 714–718. (2024). https://doi.org/10.5220/0012969400004508
Khan, R. et al. Advanced federated ensemble internet of learning approach for cloud based medical healthcare monitoring system. Sci. Rep. 14(1), https://doi.org/10.1038/s41598-024-77196-x (2024).
Hassan, E., Saber, A., El-Kenawy, E. S. M., Bhatnagar, R. & Shams, M. Y. Early Detection of Black Fungus Using Deep Learning Models for Efficient Medical Diagnosis, in Proceedings of the International Conference on Emerging Techniques in Computational Intelligence, ICETCI 2024, 2024, pp. 426–431., 2024, pp. 426–431. (2024). https://doi.org/10.1109/ICETCI62771.2024.10704103
Hassan, E., Saber, A., El-Sappagh, S. & El-Rashidy, N. Optimized ensemble deep learning approach for accurate breast cancer diagnosis using transfer learning and grey wolf optimization, Evol. Syst., vol. 16, no. 2, pp. 1–17, Jun. (2025). https://doi.org/10.1007/s12530-025-09686-w
Khan, S. H. & Alam, M. G. R. A Federated Learning Approach to Pneumonia Detection, in 7th International Conference on Engineering and Emerging Technologies, ICEET 2021, (2021). https://doi.org/10.1109/ICEET53442.2021.9659591
Li, J. et al. Mar., A Federated Learning Based Privacy-Preserving Smart Healthcare System, IEEE Trans. Ind. Informatics, vol. 18, no. 3, pp. 2021–2031, (2022). https://doi.org/10.1109/TII.2021.3098010
Feki, I., Ammar, S., Kessentini, Y. & Muhammad, K. Federated learning for COVID-19 screening from chest X-ray images. Appl. Soft Comput. 106, 107330. https://doi.org/10.1016/j.asoc.2021.107330 (Jul. 2021).
Hu, E. et al. Jun., LoRA: Low-Rank Adaptation of Large Language Models, ICLR 2022–10th Int. Conf. Learn. Represent., Accessed: Jul. 08, 2025. [Online]. (2021). Available: https://arxiv.org/abs/2106.09685v2
Kaissis, G. A., Makowski, M. R., Rückert, D. & Braren, R. F. Secure, privacy-preserving and federated machine learning in medical imaging. Nat. Mach. Intell. 2 (6), 305–311. https://doi.org/10.1038/s42256-020-0186-1 (2020).
Kermany, D. S. et al. Identifying Medical Diagnoses and Treatable Diseases by Image-Based Deep Learning. Cell 172 (5), 1122–1131. https://doi.org/10.1016/j.cell.2018.02.010 (Feb. 2018). .e9.
Rajpurkar, P. et al. CheXNet: Radiologist-Level Pneumonia Detection on Chest X-Rays with Deep Learning,., Accessed: Jul. 17, 2025. [Online]. (2017). Available: https://stanfordmlgroup.github.io/projects/chexnet/
Irvin, J. et al. CheXpert: A large chest radiograph dataset with uncertainty labels and expert comparison, in 33rd AAAI Conference on Artificial Intelligence, AAAI 31st Innovative Applications of Artificial Intelligence Conference, IAAI 2019 and the 9th AAAI Symposium on Educational Advances in Artificial Intelligence, EAAI 2019, 2019, pp. 590–597. (2019). https://doi.org/10.1609/aaai.v33i01.3301590
Pardamean, B., Cenggoro, T. W., Rahutomo, R., Budiarto, A. & Karuppiah, E. K. Transfer Learning from Chest X-Ray Pre-trained Convolutional Neural Network for Learning Mammogram Data, in Procedia Computer Science, Jan. vol. 135, pp. 400–407. (2018). https://doi.org/10.1016/j.procs.2018.08.190
Brendan McMahan, H. et al. y Communication-efficient learning of deep networks from decentralized data, in Proceedings of the 20th International Conference on Artificial Intelligence and Statistics, AISTATS, Feb. 2017. Accessed: Jul. 08, 2025. [Online]. Available: https://arxiv.org/abs/1602.05629v4, Feb. 2017. Accessed: Jul. 08, 2025. [Online]. Available: https://arxiv.org/abs/1602.05629v4 (2017).
Asokan, M., Benjamin, J. G., Yaqub, M. & Nandakumar, K. A Federated Learning-Friendly Approach for Parameter-Efficient Fine-Tuning of SAM in 3D Segmentation, in Lecture Notes in Computer Science (including subseries Lecture Notes in Artificial Intelligence and Lecture Notes in Bioinformatics), Jul. 15274 LNCS, 226–235 https://doi.org/10.1007/978-3-031-77610-6_21 (2025).
C. Mathew and P. Asha, “FedProx: FedSplit Algorithm based Federated Learning for Statistical and System Heterogeneity in Medical Data Communication,” J. Internet Serv. Inf. Secur., vol. 14, no. 3, pp. 353–370, Aug. 2024, https://doi.org/10.58346/JISIS.2024.I3.021 .
Mabrouk, A., Díaz, R. P., Redondo, M., Abd Elaziz & Kayed, M. Ensemble federated learning: an approach for collaborative pneumonia diagnosis. Appl. Soft Comput. 144, 110500. https://doi.org/10.1016/j.asoc.2023.110500 (Sep. 2023).
Sun, Y., Li, Z., Li, Y. & Ding, B. IMPROVING LORA IN PRIVACY-PRESERVING FEDERATED LEARNING, in 12th International Conference on Learning Representations, ICLR, 2024., 2024. (2024).
Ulku, I., Tanriover, O. O. & Akagunduz, E. Low-Rank Adaptation of Vision Transformers for Remote Sensing With Near-Infrared Imagery. IEEE Geosci. Remote Sens. Lett. 21, https://doi.org/10.1109/LGRS.2024.3449372 (2024).
Dai, Y., Gao, Y. & Liu, F. Transmed: Transformers advance multi-modal medical image classification. Diagnostics 11(8), https://doi.org/10.3390/diagnostics11081384 (2021).
Lotfinia, M., Tayebiarasteh, A., Samiei, S., Joodaki, M. & Arasteh, S. T. Boosting multi-demographic federated learning for chest radiograph analysis using general-purpose self-supervised representations. Eur. J. Radiol. Artif. Intell. 100028. https://doi.org/10.1016/j.ejrai.2025.100028.
Slika, B., Dornaika, F., Merdji, H. & Hammoudi, K. Lung pneumonia severity scoring in chest X-ray images using transformers, Med. Biol. Eng. Comput., vol. 62, no. 8, pp. 2389–2407, Aug. (2024). https://doi.org/10.1007/s11517-024-03066-3
Liu, J. et al. Adaptive Parameter-Efficient Federated Fine-Tuning on Heterogeneous Devices, IEEE Trans. Mob. Comput., no. 01, pp. 1–18, Jul. (2024). https://doi.org/10.1109/TMC.2025.3586644
Wu, P. et al. FedFMSL: federated learning of foundation models with sparsely activated LoRA. IEEE Trans. Mob. Comput. 23 (12), 15167–15181. https://doi.org/10.1109/TMC.2024.3454634 (2024).
Cho, Y. J., Liu, L., Xu, Z., Fahrezi, A. & Joshi, G. Heterogeneous LoRA for Federated Fine-tuning of On-Device Foundation Models, in EMNLP –2024 Conference on Empirical Methods in Natural Language Processing, Proceedings of the Conference, Jan. 2024, pp. 12903–12913., Jan. 2024, pp. 12903–12913. (2024). https://doi.org/10.18653/v1/2024.emnlp-main.717
Continue Reading
-
Federated two-edge graph attention network with weighted global aggregation for electricity consumption demand forecasting
Accurate electricity demand forecasting is crucial for the stable operation of smart grids, as it enables proactive resource allocation and prevents grid failures caused by demand–supply mismatches. However, achieving precise predictions requires modeling both temporal consumption patterns and peak variations in electricity usage data. Regional power consumption data may contain sensitive commercial information, while federated learning (FL) offers a privacy-preserving approach to address data scarcity. Nevertheless, existing FL approaches struggle with two critical limitations: (1) the inherent risk of overfitting when modeling peak demand variations with sparse client-side data, and (2) the loss of client-specific features during the aggregation process, which can result in over-smoothing of predictions for some clients due to parameter inconsistencies across local models. To overcome these challenges, this paper proposes a Federated Two-Edge Graph Attention Network with Weighted Global Aggregation (FapDGN) for electricity demand forecasting. The FapDGN framework initiates by constructing a hybrid feature representation that simultaneously encapsulates both temporal dynamics and numerical fluctuations in electricity consumption patterns. Recognizing that temporal characteristics are crucial for prediction accuracy while peak variations pose higher overfitting risks, the system employs two-edge graph structures to process these elements independently. Specifically, it utilizes temporal edges in graphs coupled with a multi-scale attention mechanism to capture consumption trends over time, while implementing dynamic covariance through numerical structure edges in graphs to represent peak variations as parameterized Gaussian distributions, an approach that mitigates overfitting. The model subsequently combines these extracted temporal and peak variation features to produce its final predictive outputs. Furthermore, to combat potential over-smoothing issues, FapDGN integrates a similarity-based adaptive dynamic fusion mechanism for parameter aggregation at the server level when building the global model. Experimental results show that FapDGN outperforms commonly used FL methods in forecasting electricity demand.
Continue Reading
-

Al Jazeera launches new integrative AI model, ‘The Core’ | Media News
Al Jazeera Media Network says initiative will shift role of AI ‘from passive tool to active partner in journalism’.
Published On 21 Dec 2025
Al Jazeera Media Network is launching a new integrative artificial intelligence (AI) model in collaboration with Google Cloud.
Al Jazeera said on Sunday that it was expanding its collaboration with Google Cloud on the network’s new initiative, dubbed “The Core”, that will integrate AI into its news operations.
“The Core” aims to shift the role of AI “from a passive tool to an active partner in journalism”, Al Jazeera said.
Relying on six pillars, the initiative will integrate AI systems to help Al Jazeera journalists process complex data, produce immersive content, gain access to analytical context and automate internal workflows, among other things.
“Al Jazeera is committed to establishing a global technological ecosystem that cements our leadership in the AI era,” said Sheikh Nasser bin Faisal Al Thani, director general of Al Jazeera Media Network.
“‘The Core’ is the embodiment of this vision – an integrated model where human expertise and artificial intelligence work in tandem to modernize journalism,” Al Thani said.
“Google Cloud’s proven expertise in AI make it the ideal partner to help us execute this ambitious transformation, ensuring our journalism remains agile, accurate, and deeply engaging for our global audience.”
Alex Rutter, AI managing director for Europe, the Middle East and Africa at Google Cloud, welcomed Al Jazeera’s decision to build “The Core” platform as a “pivotal step in developing the next generation of intelligent media”.
“This transformational program leverages our advanced AI tools to reshape how journalists report and create news, and how audiences consume it. Together, Google Cloud and Al Jazeera are setting a new future direction for digital journalism,” Rutter said.
Ahmad Al-Fahad, executive director of technology and network operations at Al Jazeera, added: “Al Jazeera is committed to keeping pace with the technological advances shaping the media industry. We consistently strive to integrate the latest tools and best practices into content production across our channels and platforms.”
Continue Reading