From tomorrow, Saturday 20 December, Kids Go Free returns on the region’s buses.
This week, Bristol-based celebrity chef and presenter Briony May Williams (2018 The Great British Bake Off semi-finalist and 2019 The Great Christmas Bake Off winner, Food Unwrapped and Escape to the Country presenter) joined the Mayor for a Love Actually inspired video on social media to promote the scheme.
Around 150,000 kids in Bath & North East Somerset, Bristol, North Somerset, and South Gloucestershire aged from 5-15 years old can benefit from free bus travel again this winter – just by hopping on board, with no bus pass or registration required. The return of the popular initiative, which runs from 20 December to 4 January, was announced earlier this month by regional political and tourism leaders at Bath’s world-famous Christmas Markets, which celebrate their 25th anniversary this year with more than 250 stalls.
Over the seven weeks of the summer holidays, more than 910,000 free journeys saw almost £1 million was put back into the pockets of parents and carers through Kids Go Free. The top word used by people to describe the scheme was “money-saving”. Children’s journeys increased by 32% compared to 2024, with parents and carers across the region sharing how the scheme helped them do things they otherwise would not have been able to afford. For families usually unable to travel at all, this opened the door to the brilliant things that our region offers – in some cases for the first time ever.
Local visitor attractions and retail centres saw an uplift in footfall during that time. Radstock (+16.1%), Bath (+15.8%) Midsomer Norton (+14.4%), Yate and Chipping Sodbury (+12.2%) saw the largest increases in spending, and all also performed above the UK-average for August. Bristol BID data shows that non-essential spend (entertainment, hospitality etc) increased by 3.5% (almost £100,000) year-on-year, above the national average; Visit West-surveyed attractions in the city enjoyed their busiest post-pandemic July and almost got back to their 2021 peak level for August.
The return of Kids Go Free follows the publication of the region’s first child poverty action plan on Thursday (18 December). The Brigstow Institute at the University of Bristol and Room 13 Hareclive, who have long campaigned for free bus travel for children, are currently working with schools and youth groups, including in Hartcliffe and Barton Hill, to further understand the impact of Kids Go Free in more deprived communities. Short surveys are running over the festive period, for parents/carers, secondary-school-age, and primary-school-age children to share their experiences.
Kids Go Free is being funded using some of the £13.5 million Bus Grant funding secured from the Department for Transport by the West of England Mayoral Combined Authority.
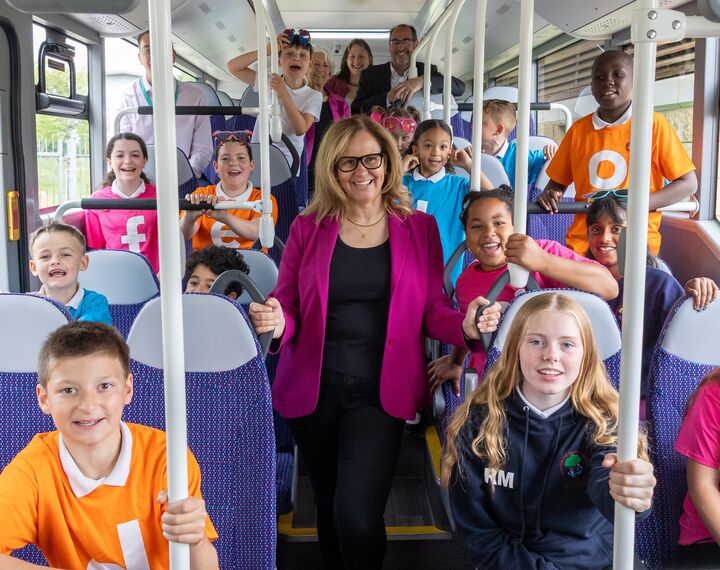
Helen Godwin, Mayor of the West of England, said:
“Kids Go Free is back! After 910,000 free journeys for under-16s this summer, putting almost £1 million back in people’s pockets, the return of our regional initiative will spread some Christmas cheer and help families at what’s often an expensive time of year.
“Working with local councils and bus operators, using devolved funding from government, we hope to see more children using the West’s buses once again – opening up more of our wonderful region for more of our young people.”
Transport Secretary Heidi Alexander said:
“I’m delighted to see the return of Kids Go Free across the West of England this Christmas, building on the huge success of the summer scheme which delivered hundreds of thousands of free journeys and saved families almost £1 million – all thanks to Government funding.
“By making bus travel free for young people, we’re creating better-connected communities and supporting families with the cost of living. We’re not only easing the burden on households during an expensive time of year, but we’re also encouraging the next generation to use the bus.”
Councillor Kevin Guy, Deputy Mayor and Leader of Bath & North East Somerset Council, said:
“Kids Go Free has been a huge success here in Bath & North East Somerset and the wider region, helping families save money and making it easier for children and young people to get out and enjoy everything our area has to offer. Over the summer, we saw thousands of extra journeys on local buses, reducing car use and cutting emissions while supporting our high streets and attractions. This initiative demonstrates how sustainable travel can deliver real benefits for residents, businesses and the environment.”
Councillor Tony Dyer, Leader of Bristol City Council, said:
“I’m delighted to see the Kids Go Free initiative return in time for the winter break, especially after its hugely successful launch over the summer holidays.
“This scheme isn’t just about free travel; it’s about giving children and young people the freedom to discover more of their city and region over the busy festive season.
“We’re proud to work once again with the Mayoral Combined Authority and our regional partners to bring this programme to life and look forward to seeing children and families make the most of this fantastic offer.”
Councillor Mike Bell, Leader of North Somerset Council, said:
“We want to make it easier for families to choose the bus, especially at Christmas when the roads are busiest and budgets are tight. By offering free bus travel for children during the festive season, we’re helping families save money, reduce congestion, and enjoy a more relaxed, shared journey experience. I hope this encourages more people to give the bus a try this Christmas and discover how convenient it can be.”
Councillor Maggie Tyrrell, Leader of South Gloucestershire Council, said:
“We are delighted to see the Kids Go Free offer return for Christmas. The festive period can be an expensive time, so it’s great that this initiative can ease the pressure for families and help them enjoy all that the region has to offer. It also supports our shared ambition to make sustainable public transport accessible to everyone.”
Kathryn Davis, CEO of Visit West, said:
“We are delighted that the Kids Go Free offer will return for the festive season to enable local people to make the most of the exciting Christmas events and experiences taking place across the region. We encourage people to check out everything that’s happening at the Visit Bristol and Visit Bath social channels and websites to make the most of this special time of the year.”
Rob Pymm, Commercial Director of First Bus in the West of England, said:
“This is a brilliant way for under 16s to get around during the festive period, helping families to save money and build bus travel habits as we head into the new year.
“We’re delighted to be supporting the scheme again and look forward to welcoming everyone on board.”
Jason Freeman, Operations Manager Bristol, Bath & The West of England at the Big Lemon, said:
“The Big Lemon are very happy to support Mayor Helen Godwin in this initiative. It is important that young people are encouraged to make use of public transport.”
The Christmas offer runs on all registered commercial and supported bus services starting in Bath & North East Somerset, Bristol, North Somerset and South Gloucestershire, with limited exemptions set out on the Travelwest website – e.g. for airport services.
Outside of the offer period, child fares in the West remain among the cheapest in country: capped at £1. Children under five years of age already travel for free on the majority of services in the West of England.