- Trastuzumab Pamirtecan Elicits Responses in HER2-Expressing Advanced/Metastatic Endometrial Cancer OncLive
- BioNTech and DualityBio’s ADC success The Pharma Letter
- BioNTech’s Trastuzumab Pamirtecan Achieves Positive Phase 2 Results in Advanced HER2-Expressing Endometrial Cancer Quiver Quantitative
- BioNTech reports promising Phase II data for uterine cancer ADC European Biotechnology Magazine
- In recurrent endometrial cancer, BioNTech drug held off progression 8 months Stock Titan
Category: 3. Business
-
Trastuzumab Pamirtecan Elicits Responses in HER2-Expressing Advanced/Metastatic Endometrial Cancer – OncLive
-

CEO Nadella Deploys Emergency Overhaul To Crush AI Rivals
Microsoft Corp stock could regain momentum as improving AI execution, cloud growth and financial balance address investor concerns, according to BNP Paribas analyst Stefan Slowinski.
Slowinski said investor frustration stems from limited traction in Microsoft’s Copilot offering despite its leadership in SaaS through 365 Commercial Cloud.
He noted that CEO Satya Nadella is driving a “Copilot code red” effort to improve performance and the user experience, with the E7 suite launching on May 1 and additional features rolling out throughout the year. He added that early product feedback is improving, and a stronger Copilot perception could ease investor concerns, especially as competition from Anthropic remains a risk.
Don’t Miss:
Slowinski said Microsoft allocated about 30% of new cloud capacity last quarter to internal uses such as Copilot and large language model development, raising investor concerns about competition with partners like OpenAI. Despite this, he said Azure could still exceed consensus expectations even if internal usage rises to 50%, supported by growing token demand and higher GPU pricing.
Slowinski said Microsoft could better balance capital spending, free cash flow, and growth as it leverages neocloud partner capacity, potentially slowing capex expansion. He added that strong free cash flow margins of around 20%, combined with improving Copilot sentiment and potential upside in Azure, could help put the stock back on track.
Trending: Avoid the #1 Investing Mistake: How Your ‘Safe’ Holdings Could Be Costing You Big Time
At $368.93, Microsoft is trading 2.9% below its 20-day simple moving average (SMA), the stock’s average price over the last 20 sessions, which suggests the near-term trend is still tilted lower. It’s also 15.9% below its 100-day SMA, indicating the intermediate trend remains pressured, and rebounds may face overhead supply.
The moving-average structure remains a headwind, with the 20-day SMA below the 50-day SMA and a death cross in January (when the 50-day SMA fell below the 200-day SMA), consistent with a longer-lasting downtrend. Moving average convergence divergence (MACD), a trend/momentum measure, is slightly constructive, with the MACD at -9.3784 above the -10.5723 signal line, suggesting that downside momentum is easing, even if the trend is still negative.
Continue Reading
-

How The Hexatronic Group (OM:HTRO) Investment Story Is Shifting While Fair Value Stays Put
Get insights on thousands of stocks from the global community of over 7 million individual investors at Simply Wall St.
Hexatronic Group’s fair value estimate is currently set at SEK 28.5 per share, and this anchor has been kept unchanged in the latest update. Analysts are split between more optimistic and more cautious readings of the recent research, which helps explain why the price target is holding steady at SEK 28.5 despite ongoing debate around growth expectations and execution risk. Read on to see what is driving these views and how to track the shifting narrative from here.
Stay updated as the Fair Value for Hexatronic Group shifts by adding it to your watchlist or portfolio. Alternatively, explore our Community to discover new perspectives on Hexatronic Group.
-
The SEB Equities upgrade on 5 February 2026 signals that, at that point, the firm saw Hexatronic’s risk and reward profile as more attractive relative to its previous stance. This supports keeping the SEK 28.5 fair value as a reasonable reference level.
-
Following the upgrade, SEB Equities commentary points to potential for upside if Hexatronic can execute on its plans and convert its operating position into steadier earnings. Some investors may view this as underappreciated in the current market debate.
-
The later downgrade by SEB Equities on 27 March 2026 highlights renewed concerns around execution risk, with the firm turning more cautious even as the fair value anchor holds at SEK 28.5 per share.
-
This shift in tone from the same research house within a short period underlines how sensitive the Hexatronic equity story is to perceived delivery on growth plans. It also helps explain why sentiment around the shares remains divided.
Do your thoughts align with the Bull or Bear Analysts? Perhaps you think there’s more to the story. Head to the Simply Wall St Community to discover more perspectives!
OM:HTRO 1-Year Stock Price Chart We’ve flagged 1 risk for Hexatronic Group. See which could impact your investment.
-
Fair value is unchanged at SEK 28.5 per share. The core valuation anchor remains the same.
-
Forecast revenue growth remains around 5.48%, indicating no material shift in topline expectations in SEK terms.
-
Projected net profit margin stays effectively stable at about 6.31%, keeping earnings efficiency assumptions in SEK consistent.
-
The future P/E multiple moves slightly from 13.58x to 13.39x. This represents a small recalibration of how future earnings are valued.
-
The discount rate adjusts modestly from 8.82% to 8.31%, reflecting a slightly different risk and return assumption in the model.
Continue Reading
-
-

A Look At Azelis Group (ENXTBR:AZE) Valuation As Governance Votes And Board Changes Approach
Get insights on thousands of stocks from the global community of over 7 million individual investors at Simply Wall St.
Azelis Group (ENXTBR:AZE) has called ordinary and extraordinary general meetings for 13 May 2026, putting share capital powers, buyback authority, founder rights and board composition in front of shareholders for fresh approval.
See our latest analysis for Azelis Group.
The upcoming meetings and board changes arrive after a sharp 24.87% 1 month share price return and a 5.37% 7 day share price return. However, the 1 year total shareholder return of 36% and 3 year total shareholder return of 56.47% point to longer term investors still facing pressure, suggesting recent momentum may reflect shifting views on governance and capital allocation.
If these governance moves have you rethinking your watchlist, it could be a good time to widen your search and check out a 95 top founder-led companies
With Azelis trading at €9.42, at a 28% discount to the consensus price target and an estimated 58% discount to intrinsic value, investors may ask whether this represents a genuine opportunity or if the market is already pricing in future growth.
Based on the most followed narrative, Azelis Group’s fair value of €12.48 sits above the latest close at €9.42, putting the recent rally in a wider context.
The analysts have a consensus price target of €19.557 for Azelis Group based on their expectations of its future earnings growth, profit margins and other risk factors. However, there is a degree of disagreement amongst analysts, with the most bullish reporting a price target of €24.0, and the most bearish reporting a price target of just €16.0.
Read the complete narrative.
Want to see what sits behind that valuation gap? The narrative leans on steadier revenue uplift, firmer margins and a higher future earnings multiple to reach its fair value.
Result: Fair Value of €12.48 (UNDERVALUED)
Have a read of the narrative in full and understand what’s behind the forecasts.
However, that gap can close quickly if working capital pressures persist, or if regional weakness in markets like China and Australia weighs more heavily on revenue and margins.
Find out about the key risks to this Azelis Group narrative.
While the narrative and fair value estimate of €12.48 point to upside potential, the current P/E of 20.6x tells a more cautious story. It sits above the European Trade Distributors average of 17.2x, and even above the fair ratio of 19.5x implied by regression analysis.
Continue Reading
-

NEW MEASURES TO MARCO POLO/CNRC BY GOLDEN POWER PMO DECREE
NEW MEASURES IN FORCE AS LONG AS MARCO POLO HOLDS STAKE ABOVE 9.99% IN PIRELLI
MARCO POLO/CNRC CAN PARTECIPATE IN THE APPOINTMENT UP TO MAXIMUM OF THREE DIRECTORS, OF WHOM TWO INDEPENDENT
DIRECTORS INDICATED BY MARCO POLO/CNRC CANNOT HOLD COMPANY OFFICE SUCH AS CHAIRMAN, VICE CHAIRMAN OR CHIEF EXECUTIVE OFFICER NOR CHAIR ANY COMMITTEE
EVENTUAL SHARE TRANSFERS BY MARCO POLO/CNRC MUST BE COMMUNICATED TO THE MINISTRY OF ENTERPRISES AND MADE IN ITALY, AND CANNOT BE IN FAVOUR OF SUBJECTS AFFILIATED WITH, CONTROLLED BY, CONTROLLING OR IN ANY CASE SUBJECT TO THE COMMON CONTROL OF SASAC
Milan, 11 April 2026 – In relation to the so-called “Golden Power Procedures” that were launched by the Prime Ministerial Office (“PMO”) following notifications submitted by the shareholders Camfin S.p.A. (”Camfin”) and Marco Tronchetti Provera & C. S.p.A. (“MTP SpA”) and China National Tire & Rubber Corporation, Ltd. (“CNRC”) in accordance with Decree-Law 21/2012 (“Golden Power Decree”), Pirelli & C. S.p.A. (“Pirelli” or “Company”) announces that, on 10 April 2026, it was informed of the decree, approved on 9 April 2026, with which the Cabinet exercised the special powers of the Golden Power Decree (the “Golden Power PMO Decree”).
The Golden Power PMO Decree, among other things, considered that Pirelli is the first operator at the global level to have invested in a technology, the Cyber Tyre, which transforms the tyre into a sensor capable of collecting sensitive information, including the condition of the tyre and its maintenance, the habits of users, driving conditions, the traceability of the state of road surfaces. In addition, in relation to the Cyber Tyre technology, the Golden Power PMO Decree also recognized that it has evolved over time to the point that it can be considered an enabling technology for different cutting edge usages, including the monitoring of critical infrastructure, advanced simulation through the realization of digital versions of physical elements (digital twins, elaborated through super computing systems), autonomous driving.
In adopting the Golden Power PMO Decree, it has therefore been confirmed that Pirelli – already having obtained the security clearance Nulla Osta di Sicurezza Industriale Strategico – is included among the companies that have goods or relationships of strategic importance in accordance with article 2 of the Golden Power Decree, and of articles 6 and 9 of the Prime Ministerial Decree of 18 December 2020, no. 179.
The Golden Power Decree maintained that, in the absence of a shareholders’ agreement regulating Pirelli, signed by the shareholders Camfin and MTP SpA and the Sinochem Group, the need to protect the assets held by Pirelli, can be satisfied, adequately and proportionally, through the imposition of additional measures together with the re-proposal of part of those contained in the Prime Ministerial Office Decree of 16 June 2023.
In detail, the Golden Power PMO Decree has ordered the imposition of the following specific measures to Marco Polo International Italy S.r.l. (“Marco Polo”):
a. at the shareholders meeting of Pirelli, the company:
(i) can present a slate for the renewal of the Board of Directors of Pirelli with a maximum of three candidates, of whom two independent; it remaining that none of these, if elected to the Board of Directors, can hold company offices such as, for example and not limited to, Chairman, Vice Chairman, Chief Executive Officer, nor chair any board committees; further, none of these Directors will be given management delegations, executive powers or attributions able to influence the strategic, industrial or financial decisions of Pirelli; should the presented slate obtain the majority of votes, it cannot contribute in any way to the appointment of the Directors needed to complete the Board of Directors;
(ii) can present a slate of candidates for the appointment of the Board of Statutory Auditors of Pirelli with a maximum of one nomination for a standing member and one nomination for an alternate member;
b. with the exception of any further obligations of notification that may emerge for the provisions codified by the Golden Power Decree, the measures indicated in the present decision will remain in force as long as the company Marco Polo maintains a stake in the share capital of Pirelli above 9.99%. Further, should there be a change in the context which justified the adoption of the limitation indicated in paragraph a), Marco Polo will have the option of requesting a revision of the above-mentioned measures.
The Golden Power PMO Decree, in addition, also calls for the imposition of the following specific measures to CNRC:
a) to guarantee that Marco Polo respects the measures imposed;
b) to not exercise activities of direction or coordination and, in particular, as detailed below, as non-exhaustive examples:
1) ensure the full autonomy of Pirelli regarding relationships with customers and suppliers;
2) guarantee that Pirelli prepares strategic, industrial, financial and/or budget plans autonomously for the company and the Group;
3) guarantee that Pirelli is not subject to instructions from the Sinochem Group;
4) not take actions or decisions or issue communications that could lead one to believe that the decisions of Pirelli are the result of an intention imposed or demanded by CNRC;
5) not centralize treasury services or other assistance or coordination services (eg. cash pooling) nor other technical coordination functions (eg. integration of Pirelli’s computer systems into those of Sinochem Holdings Corporation Ltd., including those of the Chinese units of Pirelli);
6) not issue directives or instructions, and in any case not to coordinate initiatives, concerning decisions in the financial or credit matters or research and development matters of Pirelli;
7) not issue directives regarding the execution of extraordinary operations by Pirelli, such as, for example, the listing of financial instruments, acquisitions, disposals, concentrations, conferrals, mergers, spin-offs, etc.;
8) not adopt determining decisions regarding the operating strategies of Pirelli nor formulate strategic directives for the group;
9) guarantee the absence of organizational/functional links between Pirelli on the one hand and CNRC on the other;
c) with the exception of any additional obligations of notification that may emerge from the provisions codified by the Golden Power Decree, the measures indicated in the present provision will remain in force as long as the company Marco Polo maintains a stake in the share capital of Pirelli above 9.99%. Further, should there be a change in the context which justified the adoption of the measures indicated in paragraphs a) and b), CNRC will have the option of requesting a revision of the above-mentioned limitations.
Further, the imposition of the following specific measures has been called for regarding Pirelli:
a. with the exception of the legitimate requests of shareholders tacitly foreseen by civil law and the Legislative Decree 58/1998, refuse any request outside of the normal exercising of shareholder prerogatives as well as implementing any managerial or organizational initiative from subjects deriving from the Chinese State-owned Assets Supervision and Administration Commission of the State Council (“SASAC”), with special reference to requests regarding:
– the sharing of the sensitive company information (non-public technical information of Pirelli, including the sensitive activities of research and development (also not directly linked to the Cyber Tyre)), or information referring to technologies covered by industrial copyright, intellectual property rights or, however, any information regarding know-how stemming from these technologies, also if in the development phase;
– the mechanism of centralized treasury managed by the company Sinochem Holding Corporation Ltd.;
– the direct access to the information, management and administration systems, including the Enterprise Resource Planning (ERP) platforms of Pirelli and of the companies it controls, including Chinese subsidiaries;
– the transfer of goods, systems and ICT services of the Pirelli group located in infrastructure situated outside of territory where European law applies and/or subjects deriving from the Chinese government;
– the transfer or sharing with subjects deriving from the Chinese government of any data collected or processed through Cyber Tyre technology;
– commit to making sure that the communication of CNRC with Pirelli personnel involved in the above-mentioned activities is limited ;
– commit to make sure that in the board committees, where instituted, that a maximum of only one member may be nominated that is an expression of the slate presented by CNRC; in any case, no committee will be composed of a majority of Directors presented by CNRC;
It also remains that the measures are relative to the organizational units predisposed for the company activities of importance for national security (“Organizzazione di Sicurezza”) and to that end it is also prescribed to guarantee the presence on the Board of Directors of one component, empowered with legal representation, who: i) has exclusively Italian citizenship; ii) is in possession of suitable personal security qualifications; iii) has an exclusive mandate over the Organizzazione di Sicurezza; iv) has, in any case, the assent of the Government with regard to his or her suitability for the role with the aim of protecting goods and relationships of strategic importance for the Company.
The implementation of the measures will be subject to monitoring by the Ministry for Enterprises and Made in Italy. Pirelli is held to send to the Ministry within 30 days from the approval of the annual financial statements, beginning from those referring to 2026, a report prepared by the Board of Directors in which it communicates the measures adopted in compliance with the determinations assumed with the Golden Power PMO Decree and any other important company or corporate measures with regard to the same.
Further, with the exception of matters covered in the applicability of the Golden Power Decree requiring formal notification, CNRC must communicate to the Ministry for Enterprises and Made in Italy any transfer of shares, which in any case, should not take place in favor of subjects connected to, controlled by, controlling or however subject to the common control of SASAC.
';
Continue Reading
-

Assessing Taiwan Semiconductor Manufacturing’s Valuation After Recent Share Price Strength
Get insights on thousands of stocks from the global community of over 7 million individual investors at Simply Wall St.
Taiwan Semiconductor Manufacturing (NYSE:TSM) has drawn fresh investor attention after recent share price moves, with the stock last closing at US$370.60 and posting positive returns over the week, month and past 3 months.
For readers tracking longer horizons, the company’s total return sits in double digits over the past year and multi year periods. This has prompted closer scrutiny of its current valuation and business performance.
See our latest analysis for Taiwan Semiconductor Manufacturing.
Recent trading has been strong, with the latest share price of US$370.60 following a 15.95% year to date share price return and a very large 3 year total shareholder return. Together, these factors point to momentum that investors are reassessing in light of Taiwan Semiconductor Manufacturing’s current earnings profile and valuation.
If you are looking beyond a single semiconductor name, this is a useful moment to broaden your search and review 36 AI infrastructure stocks
With a share price at US$370.60, double digit annual growth in revenue and net income, and a mixed picture from valuation indicators, the key question is whether Taiwan Semiconductor Manufacturing still offers a buying opportunity or if markets are already pricing in future growth.
According to oscargarcia, the most followed narrative places Taiwan Semiconductor Manufacturing’s fair value at $400, above the recent $370.60 share price. This puts extra focus on what is driving that gap.
TSMC is the central pillar of the global semiconductor ecosystem, powering the AI revolution with unmatched scale, cutting-edge process technology, and disciplined execution. With record profits, dominant client base, and massive expansion underway, both in Taiwan and abroad, it stands as a low-risk way to own the AI infrastructure wave.
Read the complete narrative.
Curious what sits behind that fair value? The narrative leans heavily on rapid earnings expansion, firm margins and a future profit multiple tied to AI infrastructure demand. The exact mix of growth, profitability and required return is where the valuation story becomes particularly important.
Result: Fair Value of $400 (UNDERVALUED)
Have a read of the narrative in full and understand what’s behind the forecasts.
However, concentrated production in Taiwan and heavy AI focused capex plans mean geopolitical shocks or weaker demand could quickly challenge that 7.3% undervalued narrative.
Continue Reading
-

Assessing Viasat (VSAT) Valuation After Analyst Upgrades And Free Cash Flow Break Even Hopes
Never miss an important update on your stock portfolio and cut through the noise. Over 7 million investors trust Simply Wall St to stay informed where it matters for FREE.
Viasat (VSAT) has attracted fresh attention after Barclays and several other firms upgraded their views, pointing to approaching break-even free cash flow, an upcoming satellite launch, and potential spectrum monetization.
See our latest analysis for Viasat.
Those upgrades come after a powerful run in the shares, with a 21.3% 1 month share price return and a 49.5% year to date share price return, alongside a very large 1 year total shareholder return that signals strong positive momentum.
If you are looking beyond Viasat for the next potential opportunity in connectivity and infrastructure, this is a good moment to scan 30 power grid technology and infrastructure stocks
With Viasat trading at US$56.25, above an average analyst price target of US$51.14 yet showing a 25% intrinsic discount score, the key question is whether recent momentum leaves upside on the table or if markets already price in future growth.
Viasat’s most followed narrative puts fair value at about $41.13 per share, well below the last close of $56.25. This frames the discussion around stretched expectations and execution risk.
The focus on operational efficiency, portfolio review, and progressing integration with Inmarsat, in addition to CapEx peaking with the ViaSat-3 program, sets up Viasat for positive free cash flow inflection, deleveraging, and earnings improvement as major investment cycles wind down. Rising government and commercial interest in bridging the digital divide, especially in underserved and remote areas, provides a multi-year tailwind through subsidy programs and public or private contracts, supporting stable, recurring revenue streams and margin visibility.
Read the complete narrative.
Curious how modest revenue growth, a reset profit margin, and a higher future earnings multiple combine to justify that $41 fair value signal? The narrative hinges on a specific pace of top line expansion, a profit swing from current losses, and a valuation multiple that sits well below many peers, all pulled together using a discount rate just under 11%. To see exactly how those moving parts fit, you need the full story behind the fair value model.
Result: Fair Value of $41.13 (OVERVALUED)
Have a read of the narrative in full and understand what’s behind the forecasts.
However, that story can quickly change if capital spending at ViaSat 3 and Inmarsat keeps free cash flow under pressure, or if competition in broadband and connectivity squeezes margins.
Continue Reading
-

Does Arthur J. Gallagher (AJG) Now Offer Value After A 35% One Year Share Price Slump
Never miss an important update on your stock portfolio and cut through the noise. Over 7 million investors trust Simply Wall St to stay informed where it matters for FREE.
-
Wondering whether Arthur J. Gallagher at around US$213.55 is offering fair value or a potential mispricing opportunity today.
-
The stock has been choppy, with a 1.9% decline over the last 7 days, a 1.8% gain over the past month, and returns of 16.6% decline year to date and 35.4% decline over the last year. These moves can change how the market prices its risk and prospects.
-
Recent coverage has focused on the stock’s longer term track record, including 9.6% returns over 3 years and 64.5% over 5 years, which offers a useful contrast to the weaker 1 year performance. This mix of shorter and longer term returns helps frame whether current pricing reflects a temporary setback or a more persistent shift in sentiment.
-
On Simply Wall St’s 6 point valuation checklist, Arthur J. Gallagher currently scores 3 out of 6. The rest of this article will walk through the key valuation methods behind that score, then finish with a way to look beyond the models to understand what the market might be pricing in.
Find out why Arthur J. Gallagher’s -35.4% return over the last year is lagging behind its peers.
The Excess Returns model looks at how efficiently a company converts shareholders’ equity into earnings above its estimated cost of equity, then capitalizes those “extra” returns into an intrinsic value per share.
For Arthur J. Gallagher, the model uses a Book Value of $90.74 per share and a Stable EPS of $15.97 per share, based on weighted future Return on Equity estimates from 4 analysts. The Cost of Equity is $7.75 per share, which implies an Excess Return of $8.22 per share. This is supported by an Average Return on Equity of 14.39% and a Stable Book Value of $111.02 per share, sourced from weighted future Book Value estimates from 2 analysts.
Simply Wall St converts these inputs into an estimated intrinsic value of about $341.51 per share using its Excess Returns framework. Compared with the recent share price of about $213.55, this implies the stock is roughly 37.5% undervalued based on this model.
Result: UNDERVALUED
Our Excess Returns analysis suggests Arthur J. Gallagher is undervalued by 37.5%. Track this in your watchlist or portfolio, or discover 58 more high quality undervalued stocks.
AJG Discounted Cash Flow as at Apr 2026 Head to the Valuation section of our Company Report for more details on how we arrive at this Fair Value for Arthur J. Gallagher.
Continue Reading
-
-
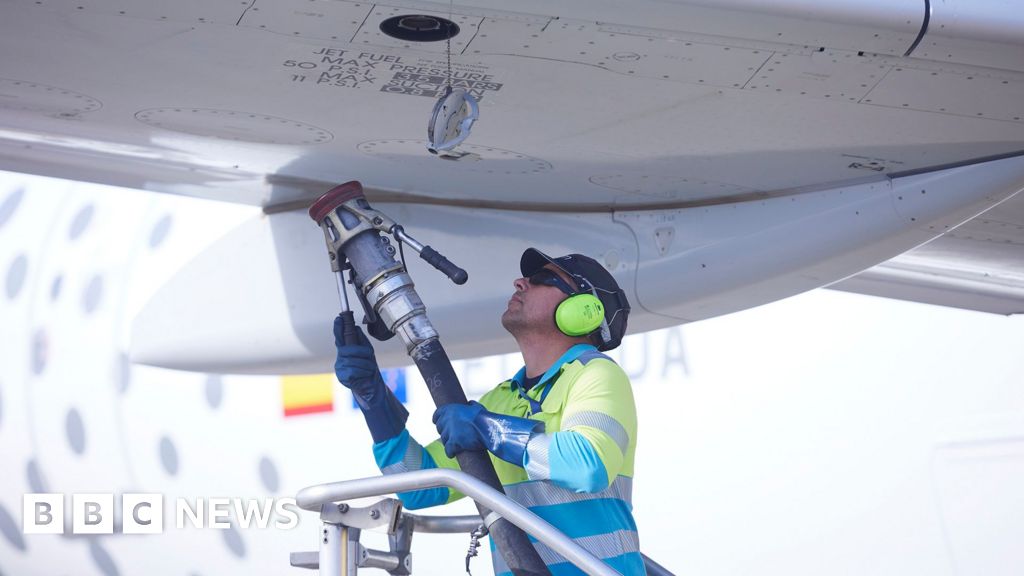
EU airline industry warns of fuel shortages if Strait of Hormuz stays closed – BBC
- EU airline industry warns of fuel shortages if Strait of Hormuz stays closed BBC
- Fears of UK and EU flight cancellations as airports warn of jet fuel shortages The Guardian
- Jet fuel supply concerns grow as war with Iran drags on, airlines cut flights CNBC
- Europe Jet Fuel Crunch Threatens Summer Flight Plans thetraveler.org
- Airfares Rise This Spring as Airlines Pass Soaring Fuel Costs to Passengers — Travel Planning Guide Travel And Tour World
Continue Reading
-

A Look At Global Business Travel Group (GBTG) Valuation After Buyback Expansion And Easing U.S. Iran Tensions
Find your next quality investment with Simply Wall St’s easy and powerful screener, trusted by over 7 million individual investors worldwide.
Global Business Travel Group (GBTG) moved higher after U.S.-Iran tensions eased, with calmer macro conditions improving sentiment on enterprise travel spending, while a larger US$600 million buyback authorization pointed to management confidence.
See our latest analysis for Global Business Travel Group.
That move came after a tougher run, with a 90 day share price return of 31.29% decline and a 1 year total shareholder return of 16.91% decline, so recent momentum looks more like a short term sentiment rebound than a sustained trend.
If you are looking beyond Global Business Travel Group and want more ideas in tech enabled services, this is a good moment to check out 18 top founder-led companies
With Global Business Travel Group trading at US$5.60, sitting at a discount to analyst targets and some intrinsic value estimates, you have to ask whether there is still a buying opportunity here or if the market is already pricing in future growth.
With Global Business Travel Group last closing at $5.60 against a narrative fair value of $12.00, the current share price sits well below what this widely followed framework assumes. This puts the focus on how realistic those embedded growth and profitability targets look.
The company’s intensified investments in AI-driven personalization, proprietary digital platforms, and automation position it to monetize growing demand for managed travel, unlocking superior client retention and new ancillary revenue streams that could lift revenue per transaction and support margin expansion.
Read the complete narrative.
Investors may want to understand what earnings path would need to play out for that valuation to hold up. The narrative leans on faster top line expansion, higher margins, and a richer future earnings multiple, all working together in a way the current share price does not reflect.
Result: Fair Value of $12.00 (UNDERVALUED)
Have a read of the narrative in full and understand what’s behind the forecasts.
However, you also need to weigh the risk that digital communication tools curb corporate travel demand, while large clients and tech focused rivals pressure fees and margins.
Find out about the key risks to this Global Business Travel Group narrative.
If this mix of risks and rewards leaves you undecided, now is a good time to look through the details yourself and see what stands out. To weigh both sides of the argument in one place, start with the 3 key rewards and 1 important warning sign
Continue Reading
