The company linked to the largest global raid on an illicit weight-loss drug facility is still selling unlicenced drugs to thousands of customers, a Guardian investigation has found.
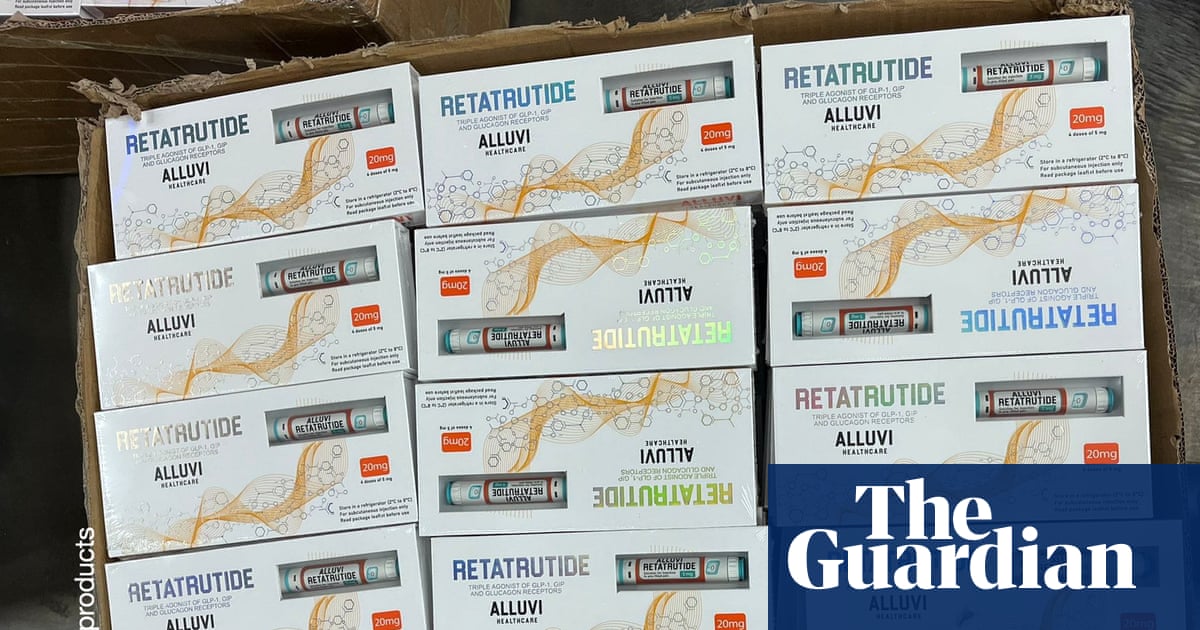
Just over a month after the Medicines and Healthcare products Regulatory Agency (MHRA) raided the site and released images of seized products with the Alluvi brand name visible, the company is still selling replicas of retatrutide. It is understood that nobody has yet been arrested in connection to the raid.
Retatrutide, which has not yet completed clinical trials, is an experimental injection developed by the US drugmaker Eli Lilly that targets three gut hormones: GLP-1, GIP and glucagon. Because it remains in clinical trials and is not approved for use, any sale to consumers is illegal. Despite this, counterfeit versions are being widely promoted on social media, with Alluvi – which did not respond to a request for comment – emerging as a key seller.
During the October raid, the MHRA carried out one of the largest single seizures of trafficked weight-loss drugs ever recorded globally. Officers confiscated tens of thousands of empty pens ready to be filled, raw chemical ingredients, and more than 2,000 unlicensed retatrutide and tirzepatide branded Alluvi pens destined for customers.
They also found large quantities of sophisticated packaging and manufacturing equipment, along with about £20,000 in cash suspected to be linked to medicines trafficking.
Despite this, Alluvi Healthcare Limited continues sales on multiple Telegram channels, one of which has nearly 3,000 subscribers. On 27 October, shortly after news of the raid emerged, one of its channels showed Alluvi-branded retatrutide pens, stating, “we are still fully in stock via telegram”.
Alluvi’s website is also still up and running as of 5 December, selling a “retatrutide 40mg x2 Bundle (R&D Only) for £339.99”. It advises customers: “If you’re using retatrutide for the first time, it’s essential to follow a gradual dosing plan to allow your body to adjust and minimise side effects.”
Buying retatrutide illegally carries serious risks. Because the drug is still experimental, products sold online or through unofficial channels are unregulated and may not contain the correct ingredients or dosage, and may not be sterilised to the correct standard.
Contaminated or incorrectly dosed injectable hormones can cause infections, dangerous blood sugar crashes, pancreatitis and cardiovascular side-effects. Using an unfinished clinical-trial drug outside legitimate medical settings is unsafe and potentially life-threatening.
One person who bought the Alluvi pen told the Guardian, speaking anonymously, that they had experienced severe “gastrointestinal issues, unstable peaks and troughs of energy, and dehydration”.
One of Alluvi’s Telegram channels also shares a video claiming to show a Royal Mail employee assuring buyers that “orders will be scanned in and they will be out for delivery”, and prompting the worker to say “from Alluvi”. The post promised next-day delivery.
On 1 December, the same account advertised that its “pens [are] in stock”, offering a 25% discount and directing customers to another Telegram channel for payments. Another Telegram channel – with over 2,000 members – includes a plethora of customers talking about their experiences taking the counterfeit weight-loss drugs.
The Guardian has seen evidence suggesting that payments for Alluvi products are being processed by an e-commerce business called Nutri Collectiv. Screenshots of orders indicate that customers buy what is described as a “weight loss plan”, with payments routed through Stripe, allowing the transactions to masquerade as fitness-programme purchases and avoid detection.
A Channel 4 investigation found that individuals who spoke negatively about Alluvi had their social media accounts taken over. Two TikTok accounts with millions of followers were used to impersonate legitimate weight-loss influencers who had criticised fake weight-loss drugs. The operators cloned the influencers’ profiles by copying their names and profile pictures, then contacted TikTok claiming to be the real account holders and alleging impersonation.
TikTok subsequently shut down the legitimate accounts, leaving the fake ones active. Five weight-loss affiliates told Channel 4 they had lost their TikTok accounts in this way.
Concerns about illicit production models of weight-loss drugs are heightened during the winter months, as it becomes harder to know whether products have been stored correctly.
Experts warn that colder temperatures can pose risks when it comes to storing weight-loss injections. Jason Murphy, a weight-loss expert and head of pharmacy at Chemist4U, said that winter temperatures can affect storage conditions and that the effectiveness and safety of the drug could be compromised.
“These drugs are made from living organisms and are highly sensitive to temperature variations and extreme highs or lows,” he added. “Extremely cold temperatures or freezing can damage their protein structure, reduce their medicinal effect, and potentially make them unsafe to use even after thawing … If you believe your weight-loss injection has been frozen, dispose of it immediately.”
The MHRA declined to comment.
sarah.marsh@theguardian.com