Category: 3. Business

  • Stocks manage to close volatile week in green – Newspaper

    Stocks manage to close volatile week in green – Newspaper

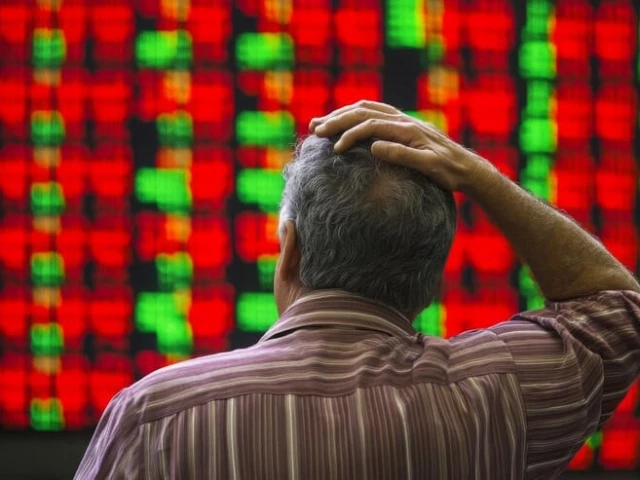
    KARACHI: The Pakistan Stock Exchange (PSX) managed to close the first week of December in positive territory, despite early volatility and a lack of positive economic triggers. Investors were seen taking profits after a turbulent start, but mid-week developments, particularly in the political and investment sectors, provided some much-needed optimism.

    According to Topline Securities, the KSE-100 index rose by 0.24 per cent on a week-on-week basis, buoyed by the approval of the prime minister’s summary for Field Marshal Syed Asim Munir’s appointment as Chief of Defence Forces, ending months of uncertainty. Additionally, Saudi Arabia’s decision to extend its $3 billion deposit with Pakistan’s central bank for another year was a key catalyst for market recovery.

    Pakistan’s headline inflation for November stood at 6.15pc, slightly down from 6.24pc in October, indicating a minimal change. Meanwhile, the country’s trade deficit for November widened to $2.86bn, a 33pc year-on-year increase. Exports fell by 15.4pc year-on-year, while imports saw a modest 5.4pc rise, further exacerbating the trade imbalance.

    Other economic indicators showed mixed results. Cement despatches (domestic and exports) dropped by 3.2pc year-on-year in November, while urea offtake surged by 25pc year-on-year, driven by strong demand for the rabi season.

    Index posts modest rise as political clarity and Saudi rollover boost investor confidence

    On the foreign reserves front, the State Bank of Pakistan’s reserves increased by $14m to $14.57bn. The commercial banks’ foreign exchange holdings remained stable at $5.01bn, pushing the country’s total liquid reserves to $19.59bn.

    The cement sector emerged as a major contributor to the KSE-100’s weekly performance, adding 535 points, with the sector benefiting from a 2pc year-on-year growth in local despatches. Meanwhile, the energy and petroleum (E&P) sector added 351 points, driven by progress on the LNG diversion plan and the auction of offshore blocks, which attracted Turkish investment.

    AKD Securities noted that market participation dropped by 22pc week-on-week due to volatility, with average traded volume declining to 680m shares from 863m the previous week. However, the market closed on a positive note, largely thanks to developments on the political and international fronts.

    According to Arif Habib Ltd (AHL), the KSE-100 index rose modestly from 166,677 to 167,086 points, a 407.88 points week-on-week increase. The IMF’s Executive Board’s anticipated approval of a $1.2bn disbursement under the Extended Fund Facility (EFF) and Resilience and Sustainability Fund (RSF) on Monday is expected to bolster investor sentiment further. Additionally, the government’s progress in tackling the power sector’s circular debt could provide further optimism.

    The market’s current price-to-earnings (P/E) ratio of 8.43x is slightly below its 15-year average of 8.59x, while its dividend yield of 5.78pc is also somewhat lower than the historical average of 6.11pc. These factors make local equities attractive relative to other investment avenues.

    Central government debt rose to Rs77 trillion in October, reflecting a 0.5pc month-on-month increase and an 11.4pc year-on-year rise. Despite this, the rupee showed signs of stabilisation, appreciating by 0.04pc week-on-week to close at Rs280.42 against the US dollar.

    AKD Securities foresees continued momentum in the KSE-100 index, supported by successful IMF Executive Board approval, reduced flood impacts, and improved credit ratings by global agencies. These developments, alongside the likelihood of foreign portfolio and direct investment inflows, particularly from Saudi Arabia and the US, could provide a foundation for sustained market growth.

    Looking ahead, AHL analysts expect the positive market sentiment to persist, particularly in the wake of an inflow of $1.2bn from the IMF.

    The outlook remains cautiously optimistic, with investors focusing on economic stabilisation and political developments as key drivers for the market in the near term.Political stability and foreign support are key factors keeping investor confidence afloat, even as ongoing issues like the trade deficit and inflation continue to weigh on sentiment.

    With key IMF approvals on the horizon, market participants will be closely watching any further developments that could affect the investment climate.

    Published in Dawn, December 7th, 2025

    Continue Reading

  • Rupee to break Rs280 barrier against dollar – Newspaper

    Rupee to break Rs280 barrier against dollar – Newspaper

    KARACHI: Though the rupee has been appreciating against the dollar in what dealers describe as a managed way, the market expects the local currency to break the Rs280 barrier by the end of this month.

    At the same time, market players believe it will be difficult for the State Bank to engineer a weaker rupee to boost exports, arguing that past experiences of devaluation failed to deliver a sustained increase in export volumes.

    Some currency experts said the scope for further devaluation to support exports was limited, particularly as the US dollar itself has come under pressure against major global currencies.

    “There is no mathematical calculation behind this expectation that the dollar may slip below Rs280 by the end of this month. It is the market sentiment and it happens at the end of the year,” said Atif Ahmed, a currency dealer in the interbank market. He believes the dollar will slip below Rs280 only for a brief period.

    Experts warn against devaluation, say past episodes failed to increase exports

    Other experts said dollar demand would remain steady but sentiment had improved after a $3 billion rollover from Saudi Arabia, which they expect to support the rupee.

    “If anything, the risk right now is that the rupee may trade below 280 per dollar, which could destabilise export-based industries, whereas a mild depreciation would be the right way forward,” said Faisal Mamsa, CEO of Tresmark.

    During the current fiscal year, the rupee has appreciated gradually, with more noticeable gains since July 31, when the dollar hit its peak for the year. On July 31, the dollar was traded at Rs284.27, compared to Rs280.42 on the last trading day of the outgoing week.

    One dealer noted that the US dollar has already lost about 12 per cent against major international currencies, arguing that the rupee had effectively helped the dollar remain relatively strong and stable in the local market.

    Exports, however, have been declining. They fell 15.4pc in November, swelling the trade deficit for the first five months of FY26 to $37.2bn and putting pressure on the current account.

    The market has been rife with speculation that the government is under pressure to devalue the rupee to support exporters, but the currency’s gradual appreciation has dismissed such perceptions.

    “Yes, the calls for a weaker rupee have grown louder. You hear the usual arguments: global demand is soft, INR (the Indian rupee) drifting towards 90 per dollar, exporters cannot price orders due to high costs, and a correction will magically ‘fix competitiveness’,” Mr Mamsa said.

    The rupee had collapsed from 180 to 300 against the dollar in just two years — one of the sharpest devaluations in the region. But there was no meaningful export boom, no import compression beyond what the SBP manually enforced and no structural improvement.

    “A few publications this week are again glorifying REER (Real Effective Exchange Rate) and implying that a weaker rupee is somehow ‘necessary’. It’s a familiar narrative: REER goes above 100, currency is ‘overvalued’, therefore devalue it. It’s an incomplete way to look at a modern FX (foreign exchange) market,” Mr Mamsa said.

    Currency experts also pointed out that the IMF has not treated REER as a primary barometer for the exchange rate since 2018, but exporters continue to exert political pressure for devaluation to shore up margins.

    Published in Dawn, December 7th, 2025

    Continue Reading

  • Did Cameco’s (TSX:CCO) Expanded Role in Nuclear Fuel Just Reframe Its Long-Term Investment Narrative?

    Did Cameco’s (TSX:CCO) Expanded Role in Nuclear Fuel Just Reframe Its Long-Term Investment Narrative?

    • Cameco Corporation recently presented at the Mines and Money @ Resourcing Tomorrow conference in London, where Global Managing Director Dominic Kieran outlined the company’s role in the nuclear fuel supply chain.

    • The presentation highlighted how Cameco’s combination of uranium mining, fuel services, and its interest in Westinghouse is increasingly central to long-duration reactor projects and secure nuclear fuel sourcing.

    • We’ll now explore how Cameco’s expanding role across uranium supply and Westinghouse exposure could influence its investment narrative and long-term positioning.

    AI is about to change healthcare. These 30 stocks are working on everything from early diagnostics to drug discovery. The best part – they are all under $10b in market cap – there’s still time to get in early.

    Cameco mainly suits investors who believe in a long-lived nuclear buildout and tighter uranium supply, with Westinghouse broadening its role from mining into the wider fuel cycle. The London conference appearance reinforces that narrative but does not materially change the near term focus on utility contracting momentum as a key catalyst, or on production and supply chain reliability as the most immediate risk.

    The recent binding term sheet with Brookfield Asset Management and the US Department of Commerce around Westinghouse reactors, with at least US$80 billion of proposed project financing support, is particularly relevant here. It underlines how Cameco’s exposure to Westinghouse could benefit if long duration reactor projects advance to final investment decisions, even as any delays or cancellations would still weigh on the broader thesis.

    Yet against this expanding opportunity set, the risk that final investment decisions for new reactors slip further is something investors should be very aware of…

    Read the full narrative on Cameco (it’s free!)

    Cameco’s narrative projects CA$3.9 billion revenue and CA$1.2 billion earnings by 2028. This requires 2.6% yearly revenue growth and an earnings increase of about CA$666 million from CA$533.6 million today.

    Uncover how Cameco’s forecasts yield a CA$151.75 fair value, a 20% upside to its current price.

    TSX:CCO Community Fair Values as at Dec 2025

    Fourteen fair value estimates from the Simply Wall St Community span roughly CA$50.81 to CA$151.75, showing how differently retail investors weigh Cameco’s prospects. As you compare these views, keep in mind that many are anchored to expectations that long term reactor buildouts eventually unlock higher uranium and fuel services demand, which may or may not materialize on the timelines currently assumed.

    Explore 14 other fair value estimates on Cameco – why the stock might be worth less than half the current price!

    Disagree with existing narratives? Create your own in under 3 minutes – extraordinary investment returns rarely come from following the herd.

    Don’t miss your shot at the next 10-bagger. Our latest stock picks just dropped:

    This article by Simply Wall St is general in nature. We provide commentary based on historical data and analyst forecasts only using an unbiased methodology and our articles are not intended to be financial advice. It does not constitute a recommendation to buy or sell any stock, and does not take account of your objectives, or your financial situation. We aim to bring you long-term focused analysis driven by fundamental data. Note that our analysis may not factor in the latest price-sensitive company announcements or qualitative material. Simply Wall St has no position in any stocks mentioned.

    Companies discussed in this article include CCO.TO.

    Have feedback on this article? Concerned about the content? Get in touch with us directly. Alternatively, email editorial-team@simplywallst.com

    Continue Reading

  • Genetics of High-Grade Endometrioid Adenocarcinoma of the Ovary With Yolk Sac Differentiation: A Case Report

    Genetics of High-Grade Endometrioid Adenocarcinoma of the Ovary With Yolk Sac Differentiation: A Case Report

    Continue Reading

  • Does Lumen’s New AWS Firewall Product and CTO Shift Reframe Its Cloud Security Ambitions (LUMN)?

    Does Lumen’s New AWS Firewall Product and CTO Shift Reframe Its Cloud Security Ambitions (LUMN)?

    • In early December 2025, Lumen Technologies announced the launch of Lumen Defender Managed Rules for AWS Network Firewall and confirmed upcoming leadership changes, with Executive Vice President and Chief Technology and Product Officer David Ward resigning and board member James Fowler stepping into the role in January 2026.

    • The combination of a new AI-era cloud security offering powered by Black Lotus Labs and the appointment of a seasoned technology leader positions Lumen to push further into higher-value, security-focused enterprise services.

    • We’ll now examine how Lumen’s new AWS-integrated cybersecurity product reshapes its investment narrative around higher-margin, cloud-centric enterprise growth.

    The end of cancer? These 29 emerging AI stocks are developing tech that will allow early identification of life changing diseases like cancer and Alzheimer’s.

    For Lumen, the core belief is that its pivot from shrinking legacy telecom services toward AI-enabled, cloud-centric enterprise networking and security can eventually outweigh ongoing revenue declines and losses. The new AWS-integrated Defender rules strengthen that story on the product side, but they do not materially change the near term financial catalyst, which is still progress on stabilizing revenue and managing the balance sheet, nor do they ease the biggest risk around high debt levels and continued unprofitability.

    The launch of Lumen Defender Managed Rules for AWS Network Firewall looks most relevant because it directly connects Black Lotus Labs threat intelligence to a major cloud marketplace, aligning with the catalyst around expanding Network as a Service and digital platform adoption. Getting Lumen’s security stack closer to where enterprises already run workloads, such as AWS, could help support utilization of its network and security services, which is central to the investment case.

    Yet against this push into AI era security, investors should also be aware of how Lumen’s large debt load and ongoing losses could…

    Read the full narrative on Lumen Technologies (it’s free!)

    Lumen Technologies’ narrative projects $11.8 billion revenue and $1.5 billion earnings by 2028.

    Uncover how Lumen Technologies’ forecasts yield a $7.23 fair value, a 12% downside to its current price.

    LUMN Community Fair Values as at Dec 2025

    Ten fair value estimates from the Simply Wall St Community span about US$2 to US$14.50 per share, highlighting very different views on Lumen’s upside. As you weigh those perspectives, remember that continued double digit declines in legacy revenue and the company’s ongoing unprofitability may have a significant bearing on how the turnaround story ultimately plays out.

    Explore 10 other fair value estimates on Lumen Technologies – why the stock might be worth as much as 76% more than the current price!

    Disagree with existing narratives? Create your own in under 3 minutes – extraordinary investment returns rarely come from following the herd.

    Opportunities like this don’t last. These are today’s most promising picks. Check them out now:

    This article by Simply Wall St is general in nature. We provide commentary based on historical data and analyst forecasts only using an unbiased methodology and our articles are not intended to be financial advice. It does not constitute a recommendation to buy or sell any stock, and does not take account of your objectives, or your financial situation. We aim to bring you long-term focused analysis driven by fundamental data. Note that our analysis may not factor in the latest price-sensitive company announcements or qualitative material. Simply Wall St has no position in any stocks mentioned.

    Companies discussed in this article include LUMN.

    Have feedback on this article? Concerned about the content? Get in touch with us directly. Alternatively, email editorial-team@simplywallst.com

    Continue Reading

  • PSX stays quiet amid mixed macros

    PSX stays quiet amid mixed macros


    KARACHI:

    The Pakistan Stock Exchange (PSX) saw a quiet week, with the KSE-100 index edging up 408 points to close at 167,086, as sentiment remained steady amid mixed economic indicators and key developments on the external financing front.

    AHL’s weekly review noted that Saudi Arabia rolled over its $3 billion deposit with the State Bank of Pakistan until December 2026, while headline inflation held nearly unchanged at 6.1% in November. However, weakness in trade performance, slower OMC and cement dispatches, and a widening deficit underscored persisting macro pressures, even as reserves and the rupee marked marginal improvement.

    On a day-on-day basis, the PSX kicked off Dec’25 on a strong note, with the KSE-100 index closing at 168,062, up 1,385 points, or 0.83%. On Tuesday, the market witnessed profit-taking as the index closed at 167,642, down 420 points, or 0.25%.

    As anticipated, the bourse continued its consolidation between the 166-168k range on Wednesday, with the KSE-100 closing at 166,145, down 1,495 points, or 0.89%. The PSX extended its consolidation phase on Thursday and closed flat at 166,284, up 138 points, or 0.08%.

    The market ended the week by extending its consolidation phase but the KSE-100 managed to close above the 167k mark at 167,086, posting a gain of 802 points, or 0.48%.

    AHL observed that the KSE-100 index increased from 166,677 last week to 167,086 this week, posting a modest increase of 408 points (+0.24% WoW). Saudi Arabia on Thursday rolled over its $3 billion deposit with the State Bank for another year, extending the facility to Dec’26.

    Headline inflation for Nov’25 stood at 6.1% YoY, showing little change from October’s reading of 6.2% and broadly aligning with expectations. Oil marketing companies’ sales in Nov’25 came in at 1.4 million tons, reflecting a 5% MoM and 10% YoY decline, whereas cumulative 5MFY26 sales rose by 1% YoY to 6.81 million tons.

    Pakistan’s trade deficit widened to $2.9 billion in Nov’25, as exports fell to $2.4 billion (a decline of 15.4% YoY and 15.8% MoM) while imports increased to $5.3 billion (up 5.4% YoY, though down 13.7% MoM). Over 5MFY26, the cumulative deficit expanded by 37.2% YoY to $15.5 billion.

    Cement dispatches in Nov’25 stood at 4.14 million tons, marking a 3.2% YoY and 13.1% MoM decline due to softer domestic demand and lower exports. Despite this, 5MFY26 dispatches grew 11.5% YoY to 21.4 million tons.

    Urea offtake rose sharply by 25% YoY in Nov’25 to 817k tons, driven by strong Rabi-season demand and increased discounts by manufacturers, although cumulative 11MCY25 urea sales remained 4% lower YoY. DAP offtake, however, declined by 14% YoY to 216k tons.

    The central government debt reached Rs77 trillion in Oct’25, reflecting a 0.5% MoM increase and an 11.4% YoY rise from Rs69.1 trillion in Oct’24. The SBP-held reserves rose by $14 million to $14.57 billion during the week, while commercial bank reserves remained broadly stable at $5.01 billion, AHL said.

    Danyal Hussain of JS Global wrote that the KSE-100 remained largely range bound during the week, closing at 167,086 points, reflecting a 0.2% WoW increase. Market participation improved, with average daily turnover increasing 21% WoW.

    The week commenced with inflation for Nov’25 arriving at 6.1%, taking 5MFY26 average inflation to 5% compared to 7.9% during the same period of last year. Meanwhile, the country’s trade deficit widened by 33% YoY to $2.85 billion, as exports fell 15% YoY while imports rose 5% during the month.

    Additionally, the FBR’s tax revenue collection recorded a shortfall of around Rs349 billion in 5MFY26. In governance and reform developments, the finance minister stated that an action plan for implementing 15 priority IMF recommendations will be finalised by the end of December 2025.

    In other news, Saudi Arabia extended its $3 billion deposit facility for Pakistan until Dec’26, providing a much-needed external account support. Pakistan’s central government debt rose to Rs77 trillion in Oct’25, driven mainly by domestic borrowings, which climbed 23% YoY to Rs45.49 trillion. On the privatisation front, final bidding for PIA is scheduled for December 23, Hussain said.

    Continue Reading

  • Pat Gelsinger wants to save Moore’s Law, with a little help from the Feds

    Pat Gelsinger wants to save Moore’s Law, with a little help from the Feds

    Image Credits:Slava Blazer Photography / TechCrunch

    A year after being pushed out of Intel, Pat Gelsinger is still waking up at 4 a.m., still in the thick of the semiconductor wars — just on a different battlefield. Now a general partner at venture firm Playground Global, he’s working with 10 startups. But one portfolio company has captured an outsized share of his attention: xLight, a semiconductor startup that last Monday announced it has struck a preliminary deal for up to $150 million from the U.S. Commerce Department, with the government set to become a meaningful shareholder.

    It’s a nice feather in the cap of Gelsinger, who spent 35 years across two stints at Intel before the board showed him the door late last year owing to a lack of confidence in his turnaround plans. But the xLight deal is also shining a spotlight on a trend that’s making people in Silicon Valley quietly uncomfortable: the Trump administration taking equity stakes in strategically important companies.

    “What the hell happened to free enterprise?” California Governor Gavin Newsom asked at a speaking event this week, capturing the unease that’s rippling through an industry that has long prided itself on its free-market principles.

    Speaking at one of TechCrunch’s StrictlyVC events at Playground Global, Gelsinger — who is xLight’s executive chairman — seemed unbothered by the philosophical debate. He’s more focused on his bet that xLight can solve what he sees as the semiconductor industry’s biggest bottleneck: lithography, the process of etching microscopic patterns onto silicon wafers. The startup is developing massive “free electron lasers” powered by particle accelerators that could revolutionize chip manufacturing. If the technology works at scale, that is.

    “You know, I have this long-term mission to continue to see Moore’s law in the semiconductor industry,” Gelsinger said, referencing the decades-old principle that computing power should double every two years. “We think this is the technology that will wake up Moore’s law.”

    The xLight deal is the first Chips and Science Act award under Trump’s second term, using funding earmarked for early-stage companies with promising technologies. Notably, the deal is currently at the letter of intent stage, meaning it’s not finalized and details could still change. When pressed on whether the funding could end up being double the announced amount — or potentially not materialize at all — Gelsinger was candid.

    “We’ve agreed in principle on the terms, but like any of these contracts, there’s still work to get done,” he said.

    The technology xLight is pursuing is pretty serious in both scale and ambition. The company plans to build machines roughly 100 meters by 50 meters — about the size of a football field — that will sit outside semiconductor fabrication plants. These free electron lasers would generate extreme ultraviolet light at wavelengths as precise as 2 nanometers, far more powerful than the 13.5 nanometer wavelengths currently used by ASML, the Dutch giant that utterly dominates the EUV lithography market.

    “About half of the capital goes into lithography,” Gelsinger explained of the entire semiconductor industry. “In the middle of a lithography machine is light. . . [and] this ability to keep innovating for shorter wavelength, higher power light is the essence of being able to continue to innovate for more advanced semiconductors.

    Leading xLight is Nicholas Kelez, whose background is unusual for the semiconductor world. Before founding xLight, Kelez led quantum computer development efforts at PsiQuantum (a Playground Global portfolio company) and spent two decades building large-scale X-ray science facilities at national labs including SLAC and Lawrence Berkeley, where he was Chief Engineer for the Linac Coherent Light Source.

    So why is this viable now when ASML abandoned a similar approach almost a decade ago? “The difference was the technology wasn’t as mature,” explained Kelez, who was speaking at the event alongside Gelsinger. Back then, only a handful of extreme ultraviolet lithography (EUV) machines existed, and the industry had already sunk tens of billions into the incumbent technology. “It just wasn’t the time to take on something completely new and orthogonal.”

    Now, with EUV ubiquitous in leading-edge semiconductor manufacturing and existing light source technology hitting its limits, the timing looks better. The key innovation, according to Kelez, is treating light like a utility rather than building it into each machine. “We go away from building an integrated light source with the tool, which is what [ASML does] now and that fundamentally constrains you to make it smaller and less powerful,” he said. And instead, “We treat light the same way you treat electrical power or HVAC. We build outside the fab at utility scale and then distribute in.”

    The company is aiming to produce its first silicon wafers by 2028 and have its first commercial system online by 2029.

    There are, naturally, hurdles, though right now, competing with ASML directly does not appear to be one of them. “We’re working very closely with them to basically design how we integrate with an ASML scanner,” Kelez said. “So we’re working with both them, as well as their providers, [like] Zeiss, who does their optics.”

    When asked whether Intel or other major chipmakers have committed to purchasing xLight’s technology, Gelsinger said they have not. “Nobody has committed yet, but the work is going on with everybody on the list that you would expect, and we’re having intense conversations with all of them.”

    Meanwhile, the competitive landscape is heating up. In October, Substrate — a semiconductor manufacturing startup backed by Peter Thiel — announced it raised $100 million to develop U.S. chip fabs, including an EUV tool that sounds awfully similar to xLight’s approach. Gelsinger doesn’t see them as direct competition though. “If Substrate is successful, they could be a customer for us,” he said, offering that Substrate is focused on building a full-stack lithography scanner that would ultimately need a free electron laser, which is exactly what xLight is developing.

    Gelsinger’s relationship with the Trump administration adds another layer to the story. He brought up xLight to Commerce Secretary Howard Lutnick back in February, before Playground funded the startup and before Lutnick was confirmed. At that point, Kelez says, he’d already spent more than a year pitching xLight to the government as a way to bring chip manufacturing back to the U.S., but the new arrangement has drawn criticism from some who view the administration’s approach as overreach.

    Gelsinger is unapologetic, framing it as necessary for national competitiveness. “I measure it by the results,” he said. “Does it drive the results that we want and that we need to reinvigorate our industrial policies? Many of our competitive countries don’t have such debates. They’re moving forward with the policies that are necessary to accomplish their competitive outcomes.”

    He pointed to energy policy as another example. “How many nuclear reactors are being built in the US today? Zero. How many being built in China today? 39. Energy policy in a digital AI economy equals the economic capacity of the nation.”

    For xLight, the government stake comes with minimal strings attached. The Commerce Department won’t have veto rights or a board seat, says Kelez (pictured above). “No information rights, nothing,” Gelsinger adds. “It’s a minority investment, in a non-governing way, but it also says we need this company to succeed for national interest.”

    xLight has raised $40 million from investors including Playground Global and is planning another fundraising round next month, in January. Unlike fusion or quantum computing startups that need billions, Kelez said xLight’s path is more manageable. “This is not fusion or quantum,” he said. “We don’t need billions.”

    The company also signed a letter of intent with New York to build its first machine at the New York CREATE site near Albany, though that agreement also needs finalization.

    For Gelsinger, xLight is clearly more than just another portfolio company. It’s a chance to cement his relevance in the semiconductor industry that he helped build, even if his methods put him at odds with Silicon Valley’s traditional ethos.

    Asked about navigating his principles in the current political environment, Gelsinger retreated to a more technocratic view of corporate leadership — one where the money is from the U.S. government, administrations are temporary, and CEOs must remain above the fray.

    “CEOs and companies should neither be Republican or Democrat,” he said. “Your job is to accomplish the business objective, serve your investors, serve your shareholders. That is your objective. And as a result, you need to be able to figure out what policies are beneficial on the R side or what policies are beneficial in the D side, and be able to navigate through them.”

    He added separately of that $150 million from the Trump administration, “Taxpayers will do well.”

    When asked if working across 10 startups is enough for someone who used to run Intel, Gelsinger was emphatic. “Absolutely. The idea that I can now influence across such a wide range of technologies — I’m a deep tech guy at the core of who I am. My mind is so stretched here, and I’m just grateful that the Playground team would have me to join them and let me make them smarter and be a rookie venture capitalist.”

    He paused, then added with a grin: “And I gave my wife back her weekends.”

    It’s a nice thought, though anyone who knows Gelsinger’s reputation as a workaholic might wonder how long that arrangement will last.

    Continue Reading

  • Improving Outcomes in Diffuse B-Cell Lymphoma Requires Multidisciplinary Evolution

    Improving Outcomes in Diffuse B-Cell Lymphoma Requires Multidisciplinary Evolution

    Diffuse large B-cell lymphoma (DLBCL) is an aggressive and common form of cancer that impacts thousands of individuals globally. In recent years, the treatment landscape of DLBCL has shifted rapidly due to evolutions in molecular profiling, immunotherapy, and response-adapted monitoring. At the 67th American Society of Hematology Annual Meeting and Exposition, which takes place December 6 through 9 in Orlando, Florida, experts discussed how emerging modalities and novel research insights are powering the next frontier of DLBCL care.1

    Presenters at the session, titled “Now Is the Time to Improve Outcomes in Diffuse Large B-Cell Lymphoma,” included Sarah Rutherford, MD, an associate professor of clinical medicine in the division of hematology/oncology at Weill Cornell Medicine; Jennifer Crombie, MD, a senior physician at Dana Farber Cancer Institute; and Franck Morschhauser, PhD, Centre Hospitalier Universitaire de Lille, Lille, France. Together, the presenters outlined a series of innovations that are helping to inform personalized treatment strategies, in addition to expected challenges as these methods are utilized.1

    Early Response Assessment Could Lead to Treatment Modification, Improved Outcomes in DLBCL

    Improving outcomes in patients with DLBCL begins with earlier response assessments that can be analyzed to determine therapy modifications, according to Jennifer Crombie. Her presentation detailed opportunities for improving prognosis and early detection, including using interim positron emission tomography (iPET) scans and measuring circulating tumor DNA (ctDNA) to detect minimal residual disease (MRD). Crombie explains why utilizing ctDNA could be particularly effective at identifying patients who may benefit from a treatment alteration.1

    After frontline chemotherapy, often consisting of treatment with rituximab (Rituxan; Roche), cyclophosphamide (Cytoxan; Bristol Myers Squibb), doxorubicin (Adriamycin; Pfizer), vincristine (vincristine sulfane injection; Pfizer), and prednisone (R-CHOP) or polatuzumab (Polivy; Genentech) with the R-CHOP regimen, many patients will achieve significant improvements in their disease. For patients who do not exhibit a complete response following cycles of therapy, a PET scan—at the end of treatment—or an iPET scan—in the middle of treatment—determines the state of the cancer and impact of treatment.1

    Crombie described numerous challenges regarding the use of PET scans that could hamper efforts to assess the patient’s cancer. These include imperfections in end-of-treatment PET that, despite predicting progression-free survival (PFS) and overall survival (OS) after first-line (1L) treatment, could miss patients who relapse.1

    “There is a high false-positive rate,” Crombie explained. “It makes you worry about potentially changing the therapy of someone who may be driving benefit [from their current regimen.”1

    Moreover, investigators of response-adapted trials have attempted to derive a clinical benefit with intensive chemotherapy using iPET with little results. In a 10-year follow-up of the PETAL trial (NCT00554164), for example, although iPET predicted outcomes in aggressive lymphoma, iPET-based treatment alterations did not improve outcomes.2-4

    Crombie highlights molecular testing using ctDNA assessments as a more productive avenue, asking the crowd, “Can we do better?” She outlined a series of next-generation sequencing assays for MRD, including clonoSEQ (Adaptive Biotechnologies Corporation), CAPP-Seq (Roche), and PhasED-Seq (Foresight Diagnostics). Recent studies demonstrate improved personalized cancer profiling and heightened sensitivity with these novel diagnostic assays, especially in Roschewski et al, who demonstrated that PhasED-Seq can be prognostic at both interim and end-of-therapy assessments.1,5,6

    Barriers remain erected against the use of interim MRD in clinical practice, including workflow and turnaround time considerations, along with a lack of commercial availability of diagnostic assays. However, Crombie envisions a future where frontline induction—whether it be chemotherapy or a novel agent—could be followed by iPET and interim ctDNA assessment, with results that can guide future treatment plans. These interim assessments could play a complementary role in future DLBCL treatment.1

    “We’re not there yet, but this is, I think, an attractive potential strategy to consider for the future,” Crombie explained. “And I hope clinical trials start to answer these types of questions, as to whether or not we can use MRD and PET scans in this fashion.”1

    Optimizing Treatment Sequencing in Second and Third Lines

    Novel modalities of response assessments in the form of ctDNA MRD could transform how DLBCL is treated. But how do health care professionals determine exactly which treatments to utilize in each patient in relapsed or refractory disease, especially given the myriad novel therapies and regimens now available? Franck Morschhauser explained how this consideration finds itself at the forefront of a shifting field, which is transitioning from defining patients after the 1L based on their transplant eligibility to defining them on their eligibility for chimeric antigen receptor (CAR) T-cell therapy.1

    CAR T-cell therapies have transformed the paradigm of second-line treatment in DLBCL. In phase 2 trials such as ALYCANTE (NCT04531046) and PILOT (NCT03483103), agents like axicabtagene ciloleucel (axi-cel, Yescarta; Gilead Sciences) and lisacabtagene maraleucel (liso-cel, Breyanzi; Bristol Myers Squibb) have demonstrated strong PFS rates within 1 year. CAR T-cell therapy carries numerous advantages compared with autologous stem cell transplantation, including not requiring a response from a prior line of therapy and not necessitating a referral to a specialty setting. Still, Morschhauser cautions providers that “eligibility for CAR T-cell therapy is a dynamic process,” noting that older adults and patients with comorbidities face a higher risk of neurotoxicities.1,7-10

    While new CAR T-cell therapies are becoming standard of care options, bispecific antibodies (BsAbs) and combination agents with antibody-drug conjugates are pushing treatment capabilities even further. Investigators have tested regimens such as glofitamab (Columvi; Genentech) plus gemcitabine and oxaliplatin, mosunetuzumab (Lunsumio; Genentech) plus polatuzumab vedotin, and polatuzumab vedotin, rituximab, gemcitabine, and oxaliplatin. The sheer number of combinations provides countless new ways to better treat patients with DLBCL in the relapsed or refractory setting, Morschhauser explained.1,11-13

    Still, Morschhauser noted that data on the impacts of prior BsAb exposure on CAR T-cell outcomes remains limited; he told the audience that “we should be very cautious…before making a decision to shift the sequence in the other direction.” Given the unanswered questions that remain in the field, Morschhauser gave his preference in the second line setting towards CAR T-cell therapy. However, in the third line—following the failure of CAR T-cell therapy—Morschhauser discussed the merits of treatment with BsAbs. Research led by Topp et al previously demonstrated the effectiveness of monotherapy with the BsAb odronextamab in patients with disease progression after CAR T-cell therapy.1,14

    “Patients experiencing disease progression after CAR T and bispecifics still have [significant] unmet need, and we should focus our research on those patients,” Morschhauser concluded.1

    REFERENCES
    1. Crombie J, Morschhauser F, Rutherford S. “Now Is the Time to Improve Outcomes in Diffuse Large B-Cell Lymphoma.” Presented: 67th American Society of Hematology (ASH) Annual Meeting and Exposition; December 6, 2025; Orlando, FL; Orange County Convention Center; Tangerine Ballroom. Accessed via ASH Virtual Platform on December 6, 2025.
    2. Kostakoglu L, Martelli M, Sehn LH, et al. End-of-treatment PET/CT predicts PFS and OS in DLBCL after first-line treatment: results from GOYA. Blood Adv. 2021;5(5):1283-1290. doi:10.1182/bloodadvances.2020002690
    3. Dührsen U, Bockisch A, Hertenstein B, et al. Response-guided first-line therapy and treatment of relapse in aggressive lymphoma: 10-year follow-up of the PETAL trial. Blood Neoplasia. 2024;1(3):100018. doi:10.1016/j.bneo.2024.100018
    4. Positron emission tomography guided therapy of aggressive non-Hodgkin’s lymphomas (PETAL). ClinicalTrials.gov Identifier: NCT00554164. Last Updated May 5, 2017. Accessed December 6, 2025. https://www.clinicaltrials.gov/study/NCT00554164
    5. Falchi L, Jardin F, Haioun C, et al. Glofitamab (Glofit) plus R-CHOP has a favorable safety profile and induces high response rates in patients with previously untreated (1L) large B-cell lymphoma (LBCL) defined as high risk by circulating tumor DNA (ctDNA) dynamics: Preliminary safety and efficacy results. Presented: 65th A American Society of Hematology (ASH) Annual Meeting and Exposition; December 11, 2023; San Diego, CA. Accessed Online December 6, 2025. https://ash.confex.com/ash/2023/webprogram/Paper173953.html
    6. Roschewski M, Kurtz DM, Westin JR, et al. Remission assessment by circulating tumor DNA in large B-cell lymphoma. J Clin Oncol. 2025;43(34):3652-3661. doi:10.1200/JCO-25-01534
    7. Houot R, Bachy E, Cartron G, et al. Axicabtagene ciloleucel as second-line therapy in large B cell lymphoma ineligible for autologous stem cell transplantation: a phase 2 trial. Nature Medicine. 2023;29:2593-2601. doi:10.1038/s41591-023-02572-5
    8. Axi-cel as a 2nd line therapy in patients with relapsed/refractory aggressive B lymphoma ineligible to autologous stem cell transplantation. ClinicalTrials.gov Identifier: NCT04531046. Last Updated October 9, 2024. Accessed December 6, 2025. https://clinicaltrials.gov/study/NCT04531046
    9. Sehgal A, Hoda D, Riedell PA, et al. Lisocabtagene maraleucel as second-line therapy in adults with relapsed or refractory large B-cell lymphoma who were not intended for haematopoietic stem cell transplantation (PILOT): an open-label, phase 2 study. Lancet Oncol. 2022;23(8):1066-1077. doi:10.1016/S1470-2045(22)00339-4
    10. Lisocabtagene maraleucel (JCAR017) as second-line therapy (TRANSCEND-PILOT-017006). ClinicalTrials.gov Identifier: NCT03483103. Last Updated December 12, 2023. Accessed December 6, 2025. https://clinicaltrials.gov/study/NCT03483103
    11. Abramson JS, Ku M, Hertzberg M, et al. Glofitamab plus gemcitabine and oxaliplatin (GemOx) versus rituximab-GemOx for relapsed or refractory diffuse large B-cell lymphoma (STARGLO): a global phase 3, randomised, open-label trial. Lancet. 2024;404(10466):1940-1954. doi:10.1016/S0140-6736(24)01774-4
    12. Westin J, Zhang H, Kim W, et al. Mosunetuzumab plus polatuzumab vedotin is superior to R-GemOx in transplant-ineligible patients with R/R LBCL: primary results of the Phase III SUNMO trial. Presented: 2025 International Conference on Malignant Lymphoma Annual Meeting; June 17 to 21, 2025; Lugano, Switzerland. Accessed Online December 6, 2025. https://medically.gene.com/global/en/unrestricted/haematology/ICML-2025/icml-2025-presentation-westin-mosunetuzumab-plus-polatu.html
    13. Matasar M, Li Z, Vassilakopoulos TP, et al. Polatuzumab vedotin, rituximab, gemcitabine and oxaliplatin (Pola-R-GemOX) for relapsed/refractory (r/r) diffuse large b-cell lymphoma (DLBCL): results from the randomized phase III POLARGO trial. Presented: European Hematology Association Congress 2025; June 12 to 15, 2025; Milan, Italy. Accessed Online December 6, 2025. https://library.ehaweb.org/eha/2025/eha2025-congress/4159178/matthew.matasar.polatuzumab.vedotin.rituximab.gemcitabine.and.oxaliplatin.html
    14. Topp MS, Matasar M, Allan JN, et al. Odronextamab monotherapy in R/R DLBCL after progression with CAR T-cell therapy: primary analysis of the ELM-1 study. Blood. 2025;145(14):1498-1509. doi:10.1182/blood.2024027044

    Continue Reading

  • Capital cities lead, while other cities lag in the EU

    Economic growth in the EU has been persistently slower than in the US over the past two decades. Economic growth has been slowing, mainly due to weakening labour productivity growth according to the Draghi Report (Draghi 2024). While much of the debate has focused on investment gaps, regulatory barriers, and labour market dynamics at the national level, less attention has been paid to the role of economic structure at a fine geographical scale in shaping Europe’s diverging growth trajectories.

    Our recent analysis (Dijkstra et al. 2025) aims to fill this gap by building on previous studies (Enflo 2010, Le Gallo and Kamarianakis 2011, Gómez-Tello et al. 2020, Kilroy and Gana 2020, Martin et al. 2018) and using novel data from the Annual Regional Database of the European Commission (ARDECO). Armed with these data, we examine for the first time productivity dynamics across metropolitan regions (‘metros’) in Europe over the period 2001–2021 with a ten-sector disaggregation analysis.

    The results reveal a nuanced geography of economic growth. In capitals, growth was fuelled by both productivity growth and employment growth, which may explain why they also saw the highest population growth (Table 1). In other metropolitan areas, however, employment, productivity, and populations grew at half the rate of capitals. In the rest of the EU (i.e. non-metros), populations shrank and employment barely grew, but labour productivity grew almost as fast as in capitals.

    Table 1 Decomposing the growth of gross value added (GVA) per capita in EU capitals, other metros, and non-metro regions, 2001-2021

    Note: A decomposition means that growth is split into its components:  GVA per capita growth = Productivity growth + Employment over population growth (A = B + C); Employment per capita growth = Employment growth – Population growth (C = D – E).

    When we look at the drivers of productivity growth, one pattern stands out: productivity growth occurred mostly within economic sectors rather than through shifts to more productive sectors in all three types of regions, although its relative importance varied. Capitals experienced high productivity growth, but employment growth was higher in less productive sectors, suggesting that the concentration of highly productive sectors – such as finance and professional services – generates more demand for employment in other sectors, such as retail, arts, and sports (Moretti 2012). Other metros and non-metros also achieved part of their growth through higher employment growth in more productive sectors, reflecting the fact that structural transformations are still ongoing.

    Changes in employment by sector confirm this. Between 2001 and 2021, capital regions expanded their employment shares in services (e.g. information and communication services, professional services), while employment in industry, and trade, transport, and hotels declined (Figure 1). Other metropolitan regions followed a similar but less pronounced trajectory. In contrast, non-metropolitan regions remained more dependent on traditional sectors and experienced limited employment growth. This implies that the shift of employment happened through reductions in employment in industry and agriculture rather than through labour expansion.

    Figure 1 Employment per sector by type of region in the EU in 2001, 2011, and 2021

    Productivity growth over the period 2001-2021 was fuelled by:

    • capital city status (capital metro regions lead growth, concentrating both economic and political power; see Figure 2);
    • population density (but not enough to prevent other metro regions from lagging behind);
    • lower initial productivity levels, showing signs of convergence;
    • patenting activity, as well as the employment share in ICT and finance; and
    • good transport infrastructure.

    Figure 2 Labour productivity growth in capitals and other metros, 2001-2021

    Our findings suggest that productivity at the local level is more nuanced than simply “cities are good and other places are lagging”. The findings contribute to the growing debate on agglomeration economies and labour productivity inequalities. Specifically, our work underscores the need to assess why other metro regions have underperformed over the past two decades, and whether non-metro regions will continue to converge or whether their growth will stall once they have transitioned to more productive sectors.

    Innovation can increase regional productivity, as shown in our regression analysis and the literature. This analysis is relevant for regional development policy, especially in the context of the debate on EU cohesion policy in the next programming period.  Our study highlights the different trends in productivity growth and sectoral composition of capitals, other metros and non-metros. This suggests that a tailored approach to address the distinct challenges and opportunities of different regional contexts may be more successful. Furthermore, the findings can help to identify strategies that enhance European competitiveness by embracing regional specificities (Capello and Rodríguez-Pose 2025).

    References

    Capello, R and A Rodríguez-Pose (2025), “Europe’s quest for global economic relevance: On the productivity paradox and the Draghi report”, Scienze Regionali 24(1): 7-15.

    Dijkstra, L, M Kompil and P Proietti (2025), “Are cities the real engines of growth in the EU?”, Geography and Environment Discussion Paper No. 2025, LSE.

    Draghi, M (2024), The future of European competitiveness, European Commission.

    Enflo, K S (2010), “Productivity and employment—Is there a trade-off? Comparing Western European regions and American states 1950–2000”, The Annals of Regional Science 45(2): 401-421.

    Gómez‐Tello, A, M J Murgui‐García and M T Sanchis‐Llopis (2020), “Exploring the recent upsurge in productivity disparities among European regions”, Growth and Change 51(4): 1491-1516.

    Kilroy, A and R Ganau (2020), “Economic growth in European Union NUTS-3 regions”, Finance, Competitiveness and Innovation Global Practice, World Bank.

    Le Gallo, J and Y Kamarianakis (2011), “The evolution of regional productivity disparities in the European Union from 1975 to 2002: A combination of shift–share and spatial econometrics”, Regional Studies 45(1): 123-139.

    Martin, R, P Sunley, B Gardiner, E Evenhuis and P Tyler (2018), “The city dimension of the productivity growth puzzle: the relative role of structural change and within-sector slowdown”, Journal of Economic Geography 18(3): 539-570.

    Moretti, E (2012), The New Geography of Jobs, Houghton Mifflin Harcourt.

    Continue Reading

  • Real-World Data Suggest ctDNA Status More Accurately Captures EFS Outcomes Than PET-CT

    Real-World Data Suggest ctDNA Status More Accurately Captures EFS Outcomes Than PET-CT

    The presence of circulating tumor DNA (ctDNA) at end of treatment (EOT) was shown to be prognostic of event-free survival (EFS) outcomes for patients with lymphoma regardless of subtype, according to findings from a retrospective, real-world analysis presented at the 2025 ASH Annual Meeting and Exposition.1

    Findings showed that the median EFS was not achieved (NA) in the ctDNA minimal residual disease (MRD)–negative group (n = 49) vs 1.97 months in the ctDNA-MRD-positive group (n = 19; adjusted HR, 22.43; 95% CI, 6.76-74.45; P < .0001). The 12- and 24-month HRs in the ctDNA-MRD-negative population were 0.83 (95% CI, 0.71-0.98) and 0.79 (95% CI, 0.64-0.96), respectively. The respective HRs in the ctDNA-MRD-positive population were 0.05 (95% CI, 0.01-0.35) and 0.00 (95% CI, NA-NA), respectively.

    “EOT ctDNA status can clarify ambiguous imaging results and enables earlier relapse detection,” Natalie Galanina, MD, lead study author and clinician investigator at UPMC Hillman Cancer Center in Pittsburgh, Pennsylvania, stated in during the presentation. “ctDNA kinetics offer real-time insights into treatment response during first-line therapy and can further predict response to CAR T-cell treatment,” she added.

    Topline Findings From the Real-World Study

    • EOT ctDNA-MRD status was a strong prognostic indicator, with MRD negativity linked with significantly longer EFS across lymphoma subtypes.
    • ctDNA outperformed PET-CT in detecting residual disease and the likelihood of subsequent relapse.
    • Early or delayed ctDNA clearance was associated with improved EFS outcomes, supporting ctDNA’s role in routine management and surveillance.

    What served as the foundation for this study?

    Personalized, tumor-informed ctDNA assays have shown the ability to capture prognostic and predictive information in diffuse large B-cell lymphoma (DLBCL), but its prognostic capability has been understudied in diverse subsets of lymphoma.2

    To bridge that gap, investigators prospectively collected real-world data of MRD detection and ctDNA clearance kinetics in patients with newly diagnosed or relapsed/refractory lymphoma across 14 subtypes.1

    “[Signatera is a] personalized tumor-informed assay, where both the tumor and a source of matched normal [tissue] is sequenced, either by whole exome or whole-genome sequencing. Based on the somatic mutation profile of a patient, a custom patient-specific assay is designed to track ctDNA in the plasma. This makes the test ultrasensitive while maintaining extremely high specificity,” Galanina said.

    How was the trial designed to answer how ctDNA can be applied in various lymphomas?

    The schema was such that 1105 prospectively collected plasma samples from 144 patients with lymphoma were subject to ctDNA assessment. Samples included aggressive (n = 123) T-cell (n = 13) and B-cell (n = 110) lymphomas, as well as indolent (n = 21) follicular (n = 10), marginal zone (n = 5), and cutaneous T-cell lymphoma (n = 6).

    The demographics of the patient cohort were representative of the real-world population, Galanina said. The median age was 61 years (range, 18-84) and most patients were male (n = 77; 53%). Most patients had stage IV disease (n = 75; 56%), although those with stage I (n = 15; 11%), II (n = 29; 21%), and III (n = 16; 12%) were also included. ECOG performance status was predominantly 0 (n = 50; 46%), followed by 1 (n = 35; 32%), 2 (n = 16; 15%), 3 (n = 6; 5.6%), and 4 (n = 1; 0.9%). Revised International Prognostic Index score fell between 0 and 2 in 25.2% (n = 31) of patients and between 3 and 5 in 26.8% (n = 33) of patients; 80 scores were not reported.

    With respect to therapy, patients reported receiving Pola-R-CHP (n = 6; 4.3%), R-CHOP (n = 72; 51%), R-EPOCH (n = 14; 10%), other rituximab (Rituxan; n = 17; 12%), and other (n = 31; 22%).

    The median number of ctDNA MRD timepoints was 7 (range, 1-32). Median follow-up for EFS and overall survival (OS) was 20 (range, 1-108) and 21 (range, 1-108) months, respectively.

    Pretreatment ctDNA was detectable in 94% of patients with lymphoma. “The median number of tumor molecules per mL was about 100 in aggressive and about 20 in indolent lymphomas, respectively, which may reflect differences in circulating tumor burden,” Galanina stated.

    What else was reported on with respect to ctDNA’s validity as a prognostic tool?

    Additional data revealed that ctDNA provided a better indication for treatment response than traditional imaging. Patients who had a negative PET-CT at EOT (n = 35) experienced a median EFS that was NA vs 5.16 months in those whose PET-CT was positive at EOT (n = 25; adjusted HR, 8.68; 95% CI, 2.41-31.29; P = .0010). Conversely, patients who had negative ctDNA-MRD at EOT (n = 44) experienced a median EFS that was NA vs 2.04 months in those who had positive ctDNA-MRD at EOT (n = 16; adjusted HR, 49.77; 95% CI, 9.91-250.02; P < .0001).

    Furthermore, PET-negative patients with negative ctDNA-MRD (n = 32) had a median EFS that was NA vs 2.76 months in those with positive ctDNA-MRD (n = 3; HR, 45.29; 95% CI, 4.63-443.27; P = .0011). PET-positive patients with negative ctDNA-MRD (n = 12) had a median EFS that was NA vs 1.97 months in those with positive ctDNA-MRD (n = 13; HR, 12.26; 95% CI, 3.23-46.59; P = .0002).

    “The clinical significance of this result is that EOD PET-positive patients present a significant clinical challenge, and most of them ultimately proceed to receive additional therapy. However, although the patient numbers are small, our data clearly show that the majority or 75% of PET-positive MRD-negative patients do not progress, and therefore may not require any additional therapy,” Galanina said. “Based on this, it is reasonable to integrate ctDNA as an adjunct to EOT assessment to help further risk stratify patients who are likely to relapse vs those who remain disease free.”

    “For patients who are EOD PET negative, if they are ctDNA positive, this may inform post treatment surveillance, as these patients may need to be monitored more closely, and patients who are PET positive, if they’re MRD negative, may be appropriate candidates for observation only, or at the very least require pathologic confirmation of the PET-positive lesions to rule out the non-etiology of the FDG uptake, as those patients have generally good outcomes,” Galanina added.

    In multi-variable analysis investigators demonstrated that ctDNA was the most significant predictor of EFS after correcting for all other factors, including age, tumor histology, and stage (P < .001).

    ctDNA clearance during frontline therapy was also shown to be prognostic of outcomes in all lymphoma subtypes. The median EFS was NA in patients who cleared their ctDNA (n = 48) vs 2.05 months in those who did not (n = 12; adjusted HR, 8.57; 95% CI, 2.55-28.81; P = .0005). Moreover, the median EFS was NA, NA, and 2.05 months in patients with cycle 1 clearance (n = 14), delayed clearance (n = 34), and no clearance, respectively. The adjusted HRs for patients without clearance vs those with cycle 1 clearance and delayed clearance were 20.95 (95% CI, 2.09-21.11; P = .0097) and 7.45 (95% CI, 2.22-24.98; P = .0011), respectively.

    “Early clearance by cycle 1 may have significant implications for potential de-escalation of therapy, especially for older patients and those with comorbidities,” Galanina explained.

    Can ctDNA be used to predict response to CAR T-cell therapy?

    “Lastly, we also looked at ctDNA clearance in patients undergoing CAR T-cell therapy [and we found that] ctDNA clearance retains its predictive value in this setting as well. Most MRD-positive patients who cleared ctDNA within 3 months post CAR T attained durable remission at 1 year. There was one patient who became ctDNA negative 1 month post CAR T, but then relapsed more than 1 year after, and this patient turned positive prior to recurrence. This suggests that single time point measurement post CAR T may not be sufficient, and longitudinal testing at various time intervals for several years of follow-up may be more optimal to detect patients who may relapse,” Galanina stated.

    “MRD assessment supports the integration of ctDNA testing into routine clinical management and surveillance to personalize lymphoma care,” Galanina said in conclusion.

    Disclosures: Galanina had no financial relationships to disclose.

    References

    1. Galanina N, Iqbal M, Nousome D, et al. Real-world evaluation of ctdna for risk stratification across the spectrum of both aggressive and indolent lymphomas. Blood. 2025;146(suppl 1):281. doi:10.1182/blood-2025-281
    2. Narkhede M, Tomassetti S, Iqbal M, et al. Tumor-informed ctDNA assessment as a valuable prognostic and predictive biomarker in diffuse large B-cell lymphoma. Front Oncol. Published online July 29, 2024. doi:10.3389/fonc.2024.1407003

    Continue Reading