SAO DOMINGOS DO NORTE, Brazil, Dec 6 (Reuters) – Amid the din of a chic coffee shop on Sao Paulo’s posh Oscar Freire Avenue, a barista pulls an atypical espresso. Extra creamy, with an aroma of cocoa nibs, the shot lacks the hallmark acidity prized in coffee made from the finest arabica beans.
That is because this premium espresso is made of 100% robusta beans, long derided in the coffee world as cheap filler better suited for instant coffee.
Sign up here.
“It’s a coffee that makes a wonderful crema … and has much more chocolatey notes,” said Marco Kerkmeester, co-founder of the Santo Grao coffee chain, noting the appeal of a variety cheekily labeled “0% Arabica.”
CHANGE ON THE FARM
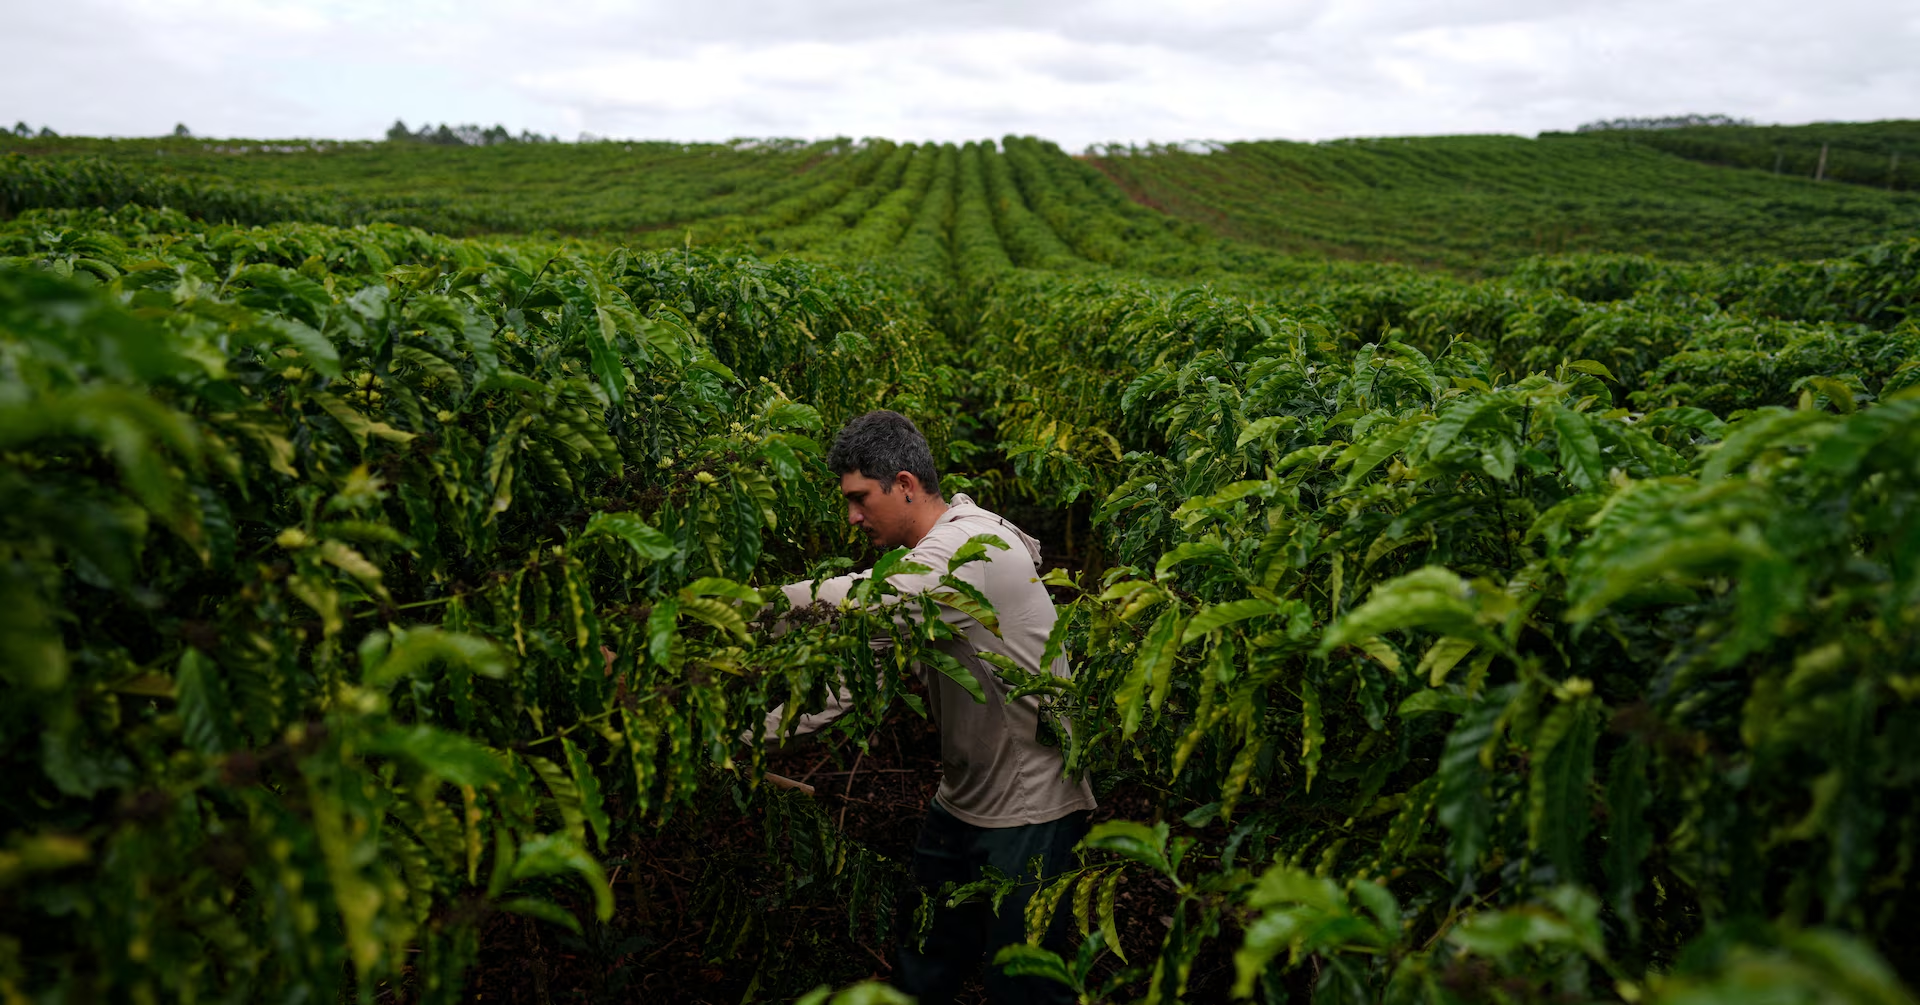
As climate change threatens the arabica beans traditionally used in high-end brews, Brazilian robusta farmers are investing in harvesting and drying techniques to produce top-notch robusta that appeals to the most demanding consumers.
Brazil is the world’s second-largest robusta producer after Vietnam and top arabica grower. However, a 2022 study found that more than three quarters of Brazil’s best land for growing arabica coffee could become unsuitable by 2050 due to higher temperatures and drought.
With global coffee prices and consumption hitting record highs this year amid trade tensions and extreme weather, premium robusta beans also offer a way for roasters to lower the cost of espresso blends with more expensive arabica.
“My dad is from a mountainous region where they produce high-quality arabica coffee,” said Lucas Venturim, a coffee farmer some 500 miles (805 km) away in Espirito Santo state, whose beans went into that espresso served on a corner of Oscar Freire. “He never accepted that robusta coffee is bad just because it’s robusta.”
In the same spirit, the Specialty Coffee Association (SCA), which sets global specialty coffee standards, this year revised its evaluation course to appeal to would-be graders of both arabica and robusta beans. Now, anyone trained to assess top-notch coffee will be able to accurately describe and reward deserving brews, regardless of the species, or type of bean.
“We saw the writing on the wall,” said Kim Ionescu, SCA’s chief strategy development officer, citing growing consumer demand for premium robusta in Southeast Asia, for example. “It just seems like species is not the thing that we should use to define specialty or non-specialty.”
In 2026, SCA will begin to revise the lexicon of flavor descriptors used by coffee evaluators to include attributes associated with fine robusta, such as aromatic spice.
Brands like Nguyen Coffee Supply, which offers quality robusta from Vietnam, have already blazed a path in the U.S., while coffee shops from London to Berlin are showcasing robusta’s finer qualities.
FIRES OUT, DRYERS IN
The opportunity has kicked off a transformation in Espirito Santo, home to most of Brazil’s robusta production, which now prioritizes not just yield but the highest quality.
The state aims to produce 1.5 million 60-kg bags of specialty robusta annually by 2032, up from 10,000 currently, according to a presentation by the state agriculture secretariat seen by Reuters.
That amounts to about a tenth of the state’s current output, requiring wider adoption of the best post-harvest practices now common among arabica producers, according to Jose Roberto Goncalves, agricultural manager of Brazil’s top robusta co-op, Cooabriel.
In recent years, Cooabriel has participated in specialty coffee trade shows around the world.
While some growers once dried robusta beans indirectly with fire, where smoke and high temperature could negatively affect the taste, Cooabriel is teaching farmers the advantages of using modern dryers and careful sorting practices, Goncalves said.
Experts at state research agency Incaper and federal university IFES said they have seen a surge in robusta farmers looking to certify quantities of their beans as higher-priced specialty grade.
“If in the past robusta coffee was considered lower quality, that perception is changing,” said Douglas Gonzaga de Sousa, coordinator of the Center for Specialty Coffees of Espirito Santo.
The growing recognition of top-quality robusta in Brazil, along with historically high yields compared to arabica, has lured more arabica farmers to try their hand with robusta – bringing their savvy to the variety.
Espirito Santo’s undersecretary for rural development, Michel Tesch, said the traffic is largely one-way.
“We don’t have people leaving robusta to produce arabica,” he said.
Cooabriel is expanding its robusta nursery in Espirito Santo to produce around 10 million saplings per year, from 2 million at present.
PRICES JUMP
The rising quality of Brazilian robusta has translated into stronger demand and higher prices, said Marcio Ferreira, the head of national coffee exporter group Cecafe.
This year, the average price per bag of specialty Brazilian robusta surpassed $295 per 60-kilogram bag through October, more than double the average 2021 price, according to Cecafe data shared with Reuters. Robusta futures have risen over 80% since 2021 to around $4,370 per metric ton, while arabica futures grew by over 60% to $3.7254 per pound.
“Improving quality allows you to increase the percentage of robusta in blends around the world,” Ferreira said, adding that roasters are more openly noting the robusta qualities in their espresso blends as they pare back the share of arabica.
At the same time, specialty robusta is not trying to go toe-to-toe with arabica as a direct competitor, said Jordan Hooper, head of green coffee trading at Sucafina.
“The original approach to specialty robusta was to kind of try to compete with specialty arabica,” he said. “Now it’s like: robusta can be interesting in and of itself.”
Natalia Ramos Braga, the barista who pulled the all-robusta shot in Sao Paulo’s Santo Grao cafe, said Brazil is a natural hotbed for those tastes to evolve.
“People, especially here in Brazil, tend to prefer coffee with a fuller mouthfeel and a more bitter finish,” she said. “If someone prefers more bitterness and a fuller body, great, we have a coffee for that: robusta.”
Reporting by Oliver Griffin and Alexandre Meneghini
Editing by Brad Haynes and Rod Nickel
Our Standards: The Thomson Reuters Trust Principles.