HOUSTON, Feb. 25, 2026 /PRNewswire/ — Crescent Midstream Intermediate Holdings, LLC (“Crescent Midstream” or the “Company”) is pleased to announce that on February 18, 2026, the Company successfully raised $600 million of senior secured credit facilities, comprising a $500 million 7-year Term Loan B and $100 million 5-year Revolving Credit Facility. In connection with the transaction, the credit facilities were assigned an issue rating of B+ by Standard & Poor’s and B1 by Moody’s. Proceeds were used to refinance Crescent Midstream’s existing debt.
Crescent Midstream’s CEO, Jerry Ashcroft, stated, “The outcome of our debt capital raise exemplifies the business we have built over the past decade. The new facilities extend Crescent’s debt maturities, strengthen our credit profile, and provide access to fund growth capital in the institutional and bank markets as we execute on our backlog of accretive growth projects. We look forward to the next chapter of Crescent Midstream generating significant free cash flow while growing strategically and providing dividends to our equity holders.”
Joint Lead Arrangers and Joint Bookrunners for the financing were Royal Bank of Canada, JPMorgan Chase Bank, N.A., Sumitomo Mitsui Banking Corporation, Mizuho Bank, Ltd., and The Bank of Nova Scotia, with Royal Bank of Canada also acting as Administrative Agent. Allen Overy Shearman Sterling US LLP acted as legal counsel to Crescent Midstream.
About Crescent Midstream Intermediate Holdings, LLC Crescent Midstream is a leading independent energy company that sits at the intersection between producers and consumers, delivering safe and reliable crude oil services throughout the Gulf of America and Louisiana. Our network of pipelines serves more than 80 deepwater platforms and transports over 500 thousand barrels of crude per day, linking shippers to essential trading and receipt points. For more information about Crescent Midstream, visit www.crescentmidstream.com/.
The kick-off meeting for the second phase of the European Next Generation Rotorcraft Technologies (ENGRT II) project took place on 29 January 2026 in Brussels. The three-year development initiative aims to deliver next-generation rotorcraft by 2030, exploring advanced configurations such as compound and tilt-rotor architectures to optimise speed, range and payloads.
Building on the successes of its predecessor, ENGRT, this project pushes the boundaries of innovation across several key domains. ENGRT II integrates AI-driven interfaces, cognitive cockpits, and crewed-uncrewed teaming, thereby embracing cutting-edge innovation essential for modern defence systems. By maturing these technologies today, the project ensures that European armed forces will have access to the most advanced vertical-lift capabilities when needed.
ENGRT II was selected under the European Defence Fund (EDF) 2024, with a total budget of €160 million and a maximum EU contribution €100 million, making it one of the projects receiving the highest EDF funding contributions. The consortium, led by Airbus Helicopters and Leonardo Helicopters, consists of 53 companies, research institutions and SMEs from across Europe. The project is supported by 13 Member States.
Next steps
ENGRT II’s roadmap focuses on long-term operational needs. It aims to replace and complement current military rotorcraft fleets after 2040. This horizon will translate today’s research into high-performance military assets for the future.
About the European Defence Fund
Since the EDF’s launch, the European Commission has invested close to €6.5 billion in defence research and development, positioning the EU among the world’s leading defence investors. The Fund has a total budget of nearly €7.3 billion for the 2021–2027 period.
“This article takes a deeper look into who can apply for an exploration license under DSHMRA and the key milestones and timelines that applicants can expect in the application process.”
The first article of this four-part series introduced the US regulatory framework for deep sea mining in the US and international waters under the Deep Seabed Hard Mineral Resources Act 30 U.S.C. § 1401 et seq. (“DSHMRA”), the role of the US National Oceanic and Atmospheric Administration (“NOAA”) and the significance of President Trump’s Executive Order 14285 issued in April 2025 for invigorating corporate activity in the deep sea mining sector.
This article takes a deeper look into who can apply for an exploration license under DSHMRA and the key milestones and timelines that applicants can expect in the application process.
Obtaining an Exploration License under DSHMRA
Who can apply?
A broad range of commercial actors can access the US licensing regime. US citizens, companies organised under US law or consortia that include US entities are eligible to apply for an exploration license under DSHMRA.
In addition, applicants must:
demonstrate that they have the technical and financial capability to conduct their proposed exploration activities;
commit to environmental protection measures set out in the regulations implementing DSHMRA, 15 CFR Part 970 – Deep Seabed Mining Regulations for Exploration Licenses (“DSHMRA Exploration Regulations”);
provide NOAA with a detailed exploration plan outlining the geographic area for the proposed exploration activities and the proposed methods and timelines for the exploration work; and
provide a preliminary environmental impact assessment with mitigation measures and a safety and compliance plan for their activities.
What is the application process?
Obtaining an exploration license issued by NOAA is a multi-stage process that is designed to be transparent, systematic and commercial, while ensuring the applicant’s compliance with US regulations and environmental considerations.
Individual timelines may vary depending on the scale of the proposed exploration project, however applicants can generally expect a clear sequencing of steps from submission to approval under the DSHMRA Exploration Regulations.
Key milestones throughout the application process are:
1. submission of exploration license application to NOAA:
the applicant applies to NOAA, including among other things, a detailed exploration plan and a preliminary environmental impact assessment of its proposed exploration activities;
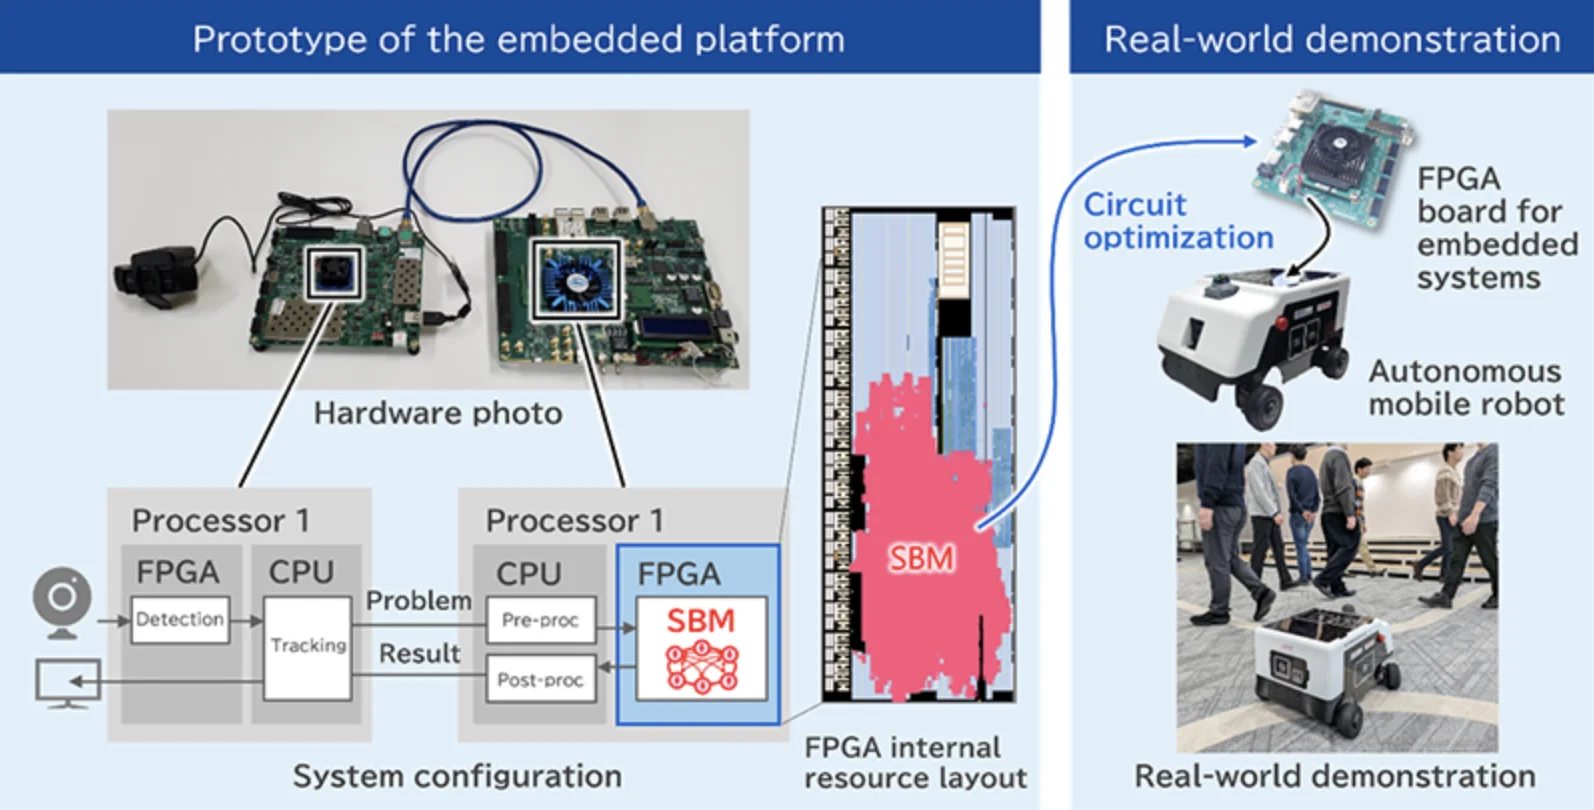
Toshiba and MIRISE embedded Toshiba’s quantum-inspired Simulated Bifurcation Machine into an autonomous mobile robot, marking what they describe as the first deployment of such a system directly onboard a mobile platform for real-time control.
The companies developed a new multi-object tracking algorithm implemented on an embedded FPGA that achieved 23 frames per second processing and improved tracking accuracy by 4% on standard benchmarks and 23% on obscuration-focused tests.
Real-world trials showed the robot could navigate crowded environments by tracking and predicting the movement of multiple objects in real time, with potential applications in vehicles, factory robots and other autonomous systems.
Image: Embedded platform and autonomous mobile robot equipped with SBM. (Toshiba)
Autonomous robots may soon carry a new kind of brain on board — one inspired by quantum computing but built from conventional chips.
Toshiba Corporation and MIRISE Technologies Corporation said in a web post that they have achieved what they describe as the world’s first deployment of a quantum-inspired optimization computer embedded directly inside an autonomous mobile robot. The companies reported that the system enabled the robot to track multiple moving objects and navigate in real time, even in crowded environments where people and vehicles frequently cross paths.
The work, published in Nature Communications and two other academic journals — here and here, centers on Toshiba’s Simulated Bifurcation Machine, or SBM, a proprietary system designed to solve complex optimization problems quickly using algorithms derived from quantum computing theory. Unlike a true quantum computer, the SBM runs on standard semiconductor hardware.
According to the researchers, autonomous machines — from warehouse robots to self-driving vehicles — must process large volumes of sensor data under tight constraints. They rely on cameras and laser sensors to detect obstacles and map their surroundings. They must then decide, within fractions of a second, how to move safely and efficiently. At the same time, engineers must limit the size, power use and cost of the onboard computing hardware.
Balancing those competing demands has become increasingly difficult as the environments in which robots operate grow more complex, according to the companies.
Quantum-inspired systems such as SBM are designed to tackle a class of problems known as combinatorial optimization. These are tasks in which a system must evaluate many possible combinations — such as matching detected objects in camera frames to previously tracked objects — and choose the best arrangement under given constraints. Classical computers can solve such problems, but the computational load can rise sharply as the number of variables increases.
Quantum-inspired approaches aim to speed up this search process by using algorithms modeled on physical processes described in quantum mechanics. Unlike quantum computers, however, they do not require cryogenic temperatures or exotic materials. They can run on familiar chips such as field-programmable gate arrays, or FPGAs, graphics processing units and application-specific integrated circuits.
Embedding Optimization at the Edge
Previous implementations of quantum-inspired optimization systems have typically been centralized, running on servers that control fleets of robots or vehicles remotely. Toshiba and MIRISE said their achievement marks the first time such a system has been embedded directly into a mobile platform and used for autonomous control.
To do so, Toshiba developed a new multi-object tracking algorithm designed to run on the SBM and then implemented it on an embedded FPGA using proprietary circuit design techniques. An FPGA is a reconfigurable semiconductor chip that can be programmed to perform specialized tasks efficiently.
The multi-object tracking problem is central to autonomous navigation. A robot must identify each person, vehicle or object in its field of view and follow their movements over time. When objects overlap or temporarily disappear behind others, conventional systems can lose track of them or mistakenly swap identities.
According to the companies, their new algorithm approaches the association between detected objects and tracked objects as a matching problem, a type of combinatorial optimization challenge. In addition to standard one-to-one matching, the approach uses the SBM’s search capabilities to consider one-to-many possibilities, improving the system’s ability to re-identify objects after they have been obscured.
In tests, researchers report the system showed measurable gains. Using a standard benchmark known as Higher Order Tracking Accuracy, or HOTA, the researchers reported a 4% improvement over established multi-object tracking benchmarks. On newly constructed benchmarks designed to emphasize object obscuration, the improvement rose to 23%.
The companies said those gains translate into more reliable tracking and better motion prediction, which in turn can contribute to safer and smoother operation in crowded environments.
From Server Rooms to Robots
According to the teams, one central technical challenge was fitting the optimization engine into hardware small and efficient enough for mobile use.
The SBM is designed with high parallelism, meaning it can perform many calculations simultaneously. Toshiba said it leveraged that architecture along with custom circuit design to achieve high-speed performance even under the power and performance constraints of embedded FPGAs.
In laboratory tests, the embedded system processed repeated detection and tracking cycles at 23 frames per second. For comparison, automated driving systems typically require around 10 frames per second to operate effectively, according to the companies. That margin suggests the system could handle real-time demands without relying on remote servers or high-power computing units.
By moving advanced optimization processing from centralized machines to compact, onboard hardware, the approach could reduce latency — the delay between sensing and action — and limit dependence on network connections.
Real-World Robot Trials
To test the system outside the lab, MIRISE mounted the FPGA running the SBM-based algorithm onto an autonomous mobile robot of its own design. In real-world experiments, the robot navigated while avoiding multiple moving objects.
MIRISE said it enhanced path planning by incorporating the tracking information generated by the SBM. The system analyzes the confidence of object positions and their direction of movement to predict future locations. It dynamically adjusts the space around each object that the robot treats as occupied, reducing unnecessary detours while maintaining safe distances.
Using cameras and other sensors alongside the tracking technology, the robot selected efficient routes in real time in environments that included both static obstacles and moving people or vehicles.
Demand for autonomous systems has been rising in logistics, manufacturing and mobility, driven in part by labor shortages and the push for automation. Warehouse transport robots, agricultural machines and urban delivery vehicles all face similar challenges: operating safely in dynamic settings while keeping hardware compact and affordable.
Toshiba and MIRISE said they plan to expand the use of embedded quantum-inspired optimization to other forms of autonomous control. Potential applications include coordinating multiple robots, optimizing routes in more complex spaces and allocating tasks in real time among fleets of machines.
The companies also said they aim to extend the technology to other embedded systems, including factory and warehouse robots, construction and agricultural machinery, infrastructure monitoring and energy management systems.
As for the work’s impact on the quantum technology field, while it does not involve a true quantum computer, the research reflects a broader trend of adapting concepts from quantum research to classical hardware. By embedding such algorithms directly into mobile machines, the companies are betting that quantum-inspired computing can help bridge the gap between increasingly sophisticated decision-making demands and the physical limits of onboard electronics.
TORONTO, February 25, 2026 – Thomson Reuters (TSX/Nasdaq: TRI) today announced that it plans to repurchase up to US$600 million of its common shares under an amended normal course issuer bid (NCIB) that has been approved by the Toronto Stock Exchange (TSX) and that it plans to return US$605 million to shareholders through a return of capital transaction.
Amended Normal Course Issuer Bid
Shares will be repurchased for the new US$600 million repurchase program under an amended NCIB. The amended NCIB, which has been accepted by the TSX, will become effective on February 27, 2026. The amended NCIB will increase the maximum number of common shares that may be repurchased by an additional 6 million. Under the amended NCIB, up to 16 million common shares (representing approximately 3.55% of the company’s 450,687,724 issued and outstanding shares as of August 12, 2025) may be repurchased between August 19, 2025 (the Effective Date) and August 18, 2026. The NCIB, as originally approved in August 2025, contemplated the repurchase of up to 10 million common shares. To date under the current NCIB, Thomson Reuters has repurchased 6,022,437 common shares for a total cost of approximately US$1.0 billion, representing an average price of US$166.05 per share.
Under the amended NCIB, shares may be repurchased on the TSX, the Nasdaq Global Select Market (Nasdaq) and/or other exchanges and alternative trading systems or by such other means as may be permitted by the TSX and/or the Nasdaq or under applicable law. Based on the average daily trading volume on the TSX of 364,105 for the six months preceding the Effective Date (net of repurchases made by TR during that time period), daily purchases are limited to 91,026 common shares, other than block purchase exceptions. Any shares that are repurchased will be cancelled.
Prior to its next regularly scheduled quarterly blackout period, Thomson Reuters intends to enter into an automatic share purchase plan (ASPP) with its broker to allow for the purchase of shares under the NCIB during pre-determined times when the company would ordinarily not be permitted to purchase shares due to customary blackout periods or other regulatory restrictions. Purchases under the ASPP are made by the company’s broker based upon parameters set by Thomson Reuters when it is not in possession of material non-public information relating to the company or the shares. The ASPP will be entered into in accordance with the requirements of the TSX and applicable Canadian and U.S. securities laws, including Rule 10b5- 1 under the U.S. Exchange Act of 1934, and will terminate when the NCIB expires, unless terminated earlier in accordance with its terms. All purchases made under the ASPP are included in computing the number of shares purchased under the NCIB. Outside of pre-determined blackout periods, shares may be purchased under the NCIB based on management’s discretion, in compliance with TSX rules and applicable securities laws.
Decisions regarding any future share repurchases will depend on certain factors, such as market conditions, share price and other opportunities to invest capital for growth. Thomson Reuters may elect to suspend or discontinue share repurchases at any time, in accordance with applicable laws.
Return of Capital
Thomson Reuters will return gross proceeds derived from the May 2024 sales of London Stock Exchange Group shares through a return of capital consisting of a special cash distribution of US$605 million in the aggregate, or approximately US$1.36 in cash per participating share (estimated based on the number of common shares issued and outstanding as of February 24, 2026 and assuming no shareholders opt-out of the return of capital transaction), followed by a share consolidation, or “reverse stock split”, which will reduce the number of common shares on a basis that is proportional to the special cash distribution. To that end, the share consolidation ratio will be based on the volume weighed average trading price of the common shares on the Nasdaq Stock Market LLC for the five trading days immediately prior to the transactions becoming effective.
DUBLIN (February 25, 2026)—AECOM, the trusted global infrastructure leader, today announced it has been awarded cost management appointments with both the National Transport Authority (NTA) and Transport Infrastructure Ireland (TII), supporting the planning and delivery of major transport and mobility infrastructure of national significance across the country.
Following a tender process, AECOM has been appointed to serve as the single source provider for the NTA’s infrastructure cost management framework, covering the full scope of cost management services including cost estimation, risk management, value management, peer review of services provided by other companies, and development of cost management guidelines and procedures. This is a three-year framework with the option of an additional year extension.
At the same time, AECOM has also been appointed to TII’s multi-party framework for the provision of commercial services, including cost management, claim advisory, claims mitigation and expert witness services, among others. The scope parameters of this framework are broad ranging and could grow to include engineering, project management and other professional services. This framework is set to run for four years, supporting TII alongside the ROI’s network of regional design offices and local authorities.
“These wins mark a significant strategic milestone for AECOM, strengthening our key relationships with both the NTA and TII as they gain access to AECOM’s industry leading commercial, technical and cost management expertise – providing greater certainty, efficiency and value across their portfolios, and supporting the efficient delivery of complex infrastructure programmes of national importance,” says Ciaran Timpson, Cost Management Infrastructure Lead for Ireland, AECOM.
“Both frameworks represent an opportunity to support transformational programmes that enhance connectivity and drive sustainable economic growth, fully aligning with AECOM’s focus on sustainable development and delivering a better world for future generations.”
AECOM has previously been appointed to a number of NTA and TII frameworks, currently delivering technical advisory and transport modelling services for the NTA through respective frameworks, as well as technical consultancy and transport planning services on separate TII frameworks.
About AECOM
AECOM is the global infrastructure leader, committed to delivering a better world. As a trusted professional services firm powered by deep technical abilities, we solve our clients’ complex challenges in water, environment, energy, transportation and buildings. Our teams partner with public- and private-sector clients to create innovative, sustainable and resilient solutions throughout the project lifecycle – from advisory, planning, design and engineering to program and construction management. AECOM is a Fortune 500 firm that had revenue of $16.1 billion in fiscal year 2025. Learn more at aecom.com.
The US owner of Deliveroo has said it is pulling the platform from two countries in Asia, months after completing its takeover of the British delivery firm.
DoorDash, which bought the London-based business last year, said it was ceasing Deliveroo’s operations in Qatar and Singapore.
This decision follows a review into the specific conditions within each country and a focus on investing in the places it thinks it can grow, according to the firm.
Some 85 jobs will be impacted from pulling out of the two countries, and the platforms will be live until March 4, it said.
Furthermore, one of Deliveroo’s engineering hubs in Bengaluru, India, will be closed, affecting around 100 employees.
DoorDash said that, as a result of the changes, Deliveroo can further invest in engineering roles in the UK.
The announcement comes as the business also announced it was pulling its other delivery platform Wolt from Japan and Uzbekistan as part of the overhaul.
Miki Kuusi, head of DoorDash International and the chief executive of Deliveroo, said: “We’ve made the difficult decision to wind down operations in Qatar, Singapore, Japan, and Uzbekistan.
“Our priority is supporting our teams and partners through an orderly transition as we focus on the geographies where we can offer the best products and build for long-term success.”
DoorDash acquired Deliveroo in October after agreeing to a takeover worth £2.9 billion.
At the time, it said it was kicking off a 12-month review of the merged group, with a potential reduction of around 1% to 3% of the combined workforce.
DoorDash operates in countries including the US, Canada, Australia and New Zealand and delivers over 2.5 billion orders a year, but believes its acquisition of Deliveroo will help expand its footprint into new locations.
Power2X, an industry leader in clean molecule projects and industrial decarbonization, today announced the acquisition of HyCC, the Netherlands-based large-scale green hydrogen project developer. The acquisition strengthens Power2X’s position as a clean molecules leader, focused on clean fuels and feedstocks for industries in the Netherlands and Germany.
The deal creates more scale, efficiencies and reflects the consolidation of the clean molecules sector, as projects move from early development into large-scale delivery.
HyCC has developed a strong portfolio of hydrogen and clean molecules projects in the Netherlands and Germany in locations such as Amsterdam, Delfzijl and Rotterdam. In the combined company, these projects will benefit from scale, broader capabilities and a strong capital base. The expertise and industrial experience from the HyCC team will support further development and delivery of projects in the Power2X portfolio.
TDK achieved the “Most Honored Company” in the electronics components sector of Extel’s 2026 Japan Executive Team for the second consecutive year.
TDK received a first place ranking in all six categories: “Best CEO”, “Best CFO”, ” Best Company Board”, ” Best ESG Program”, ” Best IR Program”, and “Best IR Team”.
TDK Corporation (TSE:6762) has been named the “Most Honored Company” in the electronics components sector of Extel’s (formerly Institutional Investor) 2026 Japan Executive Team. This marks the second consecutive year that TDK has been selected. TDK achieved a first-place rankings in all six categories – “Best CEO”, “Best CFO”,” Best Company Board”,” Best ESG Program”,” Best IR Program”, and “Best IR Team”.
This survey, conducted by Extel since 2013, selects outstanding publicly listed companies in Japan for their excellent IR activities based on votes from global institutional investors and securities analysts. In this survey, 571 investors, portfolio managers, and analysts from 237 companies participated, with a total of 533 companies nominated across 28 sectors.
TDK remains committed to enhancing corporate value through constructive dialogue and collaborative activities with all stakeholders.
About TDK Corporation
TDK Corporation (TSE:6762) is a global technology company and innovation leader in the electronics industry, based in Tokyo, Japan. With the tagline “In Everything, Better” TDK aims to realize a better future across all aspects of life, industry, and society. For over 90 years, TDK has shaped the world from within; from the pioneering ferrite cores to cassette tapes that defined an era, to powering the digital age with advanced components, sensors, and batteries, leading the way towards a more sustainable future. United by TDK Venture Spirit, a start-up mentality built on visions, courage and mutual trust, TDK’s passionate team members around the globe pursue better—for ourselves, customers, partners, and the world. Today, the state-of-the-art technologies of TDK are in everything, from industrial applications, energy systems, electric vehicles, to smartphones and gaming, at the core of modern life. TDK’s comprehensive, innovative-driven portfolio includes cutting-edge passive components, sensors and sensor systems, power supplies, lithium-ion and solid-state batteries, magnetic heads, AI and enterprise software solutions, and more—featuring numerous market-leading products. These are marketed under the product brands TDK, EPCOS, InvenSense, Micronas, Tronics, TDK-Lambda, TDK SensEI, and ATL. Positioning the AI ecosystem as a key strategic area, TDK leverages its global network across the automotive, information and communication technology, and industrial equipment sectors to expand its business in a wide range of fields. In fiscal 2025, TDK posted total sales of USD 14.4 billion and employed about 105,000 people worldwide.
Mitsui & Co., Ltd. (“Mitsui,” head office: Tokyo, President and CEO: Kenichi Hori) has decided today to dissolve and liquidate its wholly owned subsidiary MBWA Investment LLC (“MBWA”).
1. Overview of the consolidated subsidiary MBWA to be transferred
(1) Name
MBWA Investment LLC
(2) Location
Delaware, US
(3) Title and name of representative
Masayuki Takekoshi (President and CEO)
(4) Description of business
Procurement of ethylene dichloride (EDC) and caustic soda, investment in Blue Water Alliance JV LLP (“BWA”) (a subsidiary of Olin Corporation: 51%, MBWA: 49%)
(5) Contributed capital
77.8 million US dollars
(6) Date of establishment
November 1, 2022
(7) Large shareholders and ownership ratios
Mitsui (100%)
(8) Relationship between Mitsui and the said company
Capital relationship
100% of the investment made by Mitsui
Personnel relationship
Mitsui appoints officers to MBWA
Business relationship
There are no material business relationships
(9) Consolidated operating results and consolidated financial position of said company for the last three fiscal years (figures in millions of yen, converted at a rate of USD/JPY 155)
Fiscal year ended
March 2023
March 2024
March 2025
Total assets
7,835
11,893
11,797
Net assets
7,227
11,139
11,051
Profit
-275
-646
-87
2. Reasons for dissolution and liquidation
In light of changes in the business environment, Mitsui and Olin reviewed the management strategy and jointly decided to dissolve and liquidate BWA. Accordingly, Mitsui decided to dissolve and liquidate MBWA.
3. Outlook
Dissolution and liquidation of MBWA and BWA is planned to take place pending procedures such as obtaining the necessary approvals from relevant authorities. Any loss or impact on the consolidated financial results for the fiscal year ending March 2026 resulting from this are expected to be minor.