While G201 business leaders remain concerned about the potential impact of economic downturn and inflation in the near-term, the risks associated with insufficient public services and social protections, lack of economic opportunity and misinformation and disinformation are now also seen as significant threats. This is according to the Executive Opinion Survey 2025, conducted by the World Economic Forum and released today by its strategic partners – Marsh McLennan (NYSE: MMC), the world’s leading professional services firm in the areas of risk, strategy and people and Zurich Insurance Group (Zurich), a leading global multi-line insurer and provider of resilience services.
Andrew George, President, Marsh Specialty, said: “With the rise of AI, the proliferation of misinformation and disinformation is enabling bad actors to operate more broadly. As such, the challenges posed by the rapid adoption of AI and associated cyber threats now top boardroom agendas. Also, while economic and geopolitical factors have deflected some of the focus on change commitments in the short-term, businesses must remain focused on their environmental objectives to mitigate the risks associated with the changing climate in the longer-term.”
Alison Martin, CEO, EMEA & Bank Distribution, Zurich, said: “This year’s survey makes it clear: critical areas like pensions and public health are no longer just government issues – they’re boardroom priorities. It is concerning to see that in Europe today, there are fewer than three working-age adults for every pensioner, and over a third of EU citizens aren’t saving enough for retirement. These gaps threaten both workforce wellbeing and broader social stability. The time to act is now, by joining forces across sectors, we can help empower people to build financial resilience and secure a brighter future for all.”
The annual survey reveals the top five near-term risks identified by more than 11,000 business leaders from 116 countries. Fears relating to an economic downturn continue to dominate concerns cited by G20 business leaders – leading the list overall for the third consecutive year – and claiming the top spot in the UK and US.
For the first time, technological threats associated with misinformation and disinformation entered the top five risks for G20 business leaders, in fifth place. This reflects fears that advances in AI are fuelling information warfare amid rising geopolitical tensions, influencing elections and global markets, and threatening critical infrastructure and cybersecurity.
Social risks associated with insufficient public services and social protections, and a lack of economic opportunity or unemployment were ranked in second and third place, reflecting growing concerns about social fragmentation. Inflation, which was cited as the third-most pressing risk in 2024, was ranked fourth this year.
Extreme weather events, which were ranked as the fifth biggest risk by G20 leaders in 2024, did not feature in this year’s top five risks.
The Executive Opinion Survey is conducted by the World Economic Forum’s Centre for the New Economy and Society. Zurich Insurance Group and Marsh McLennan are strategic partners of the World Economic Forum.
Airbus has confirmed an unspecified number of its aircraft will undergo inspections after a “supplier quality issue” with metal panels used on some A320 planes was identified.
The problem, which the firm said impacts a “limited number” of planes, comes days after thousands of the same model were grounded for an urgent software update.
On Tuesday, the European manufacturer said it was taking a “conservative approach” by checking all planes that could be affected, even though not all are expected to need repairs.
As many as 600 A320s – a model widely used by airlines – will need to be checked, though not all are expected to have faulty panels, Airbus’ spokesperson told the BBC.
“The source of the issue has been identified, contained and all newly produced panels conform to all requirements,” he said.
The “supplier quality issue” is located at the front of the aircraft, where in some cases, the panels were found to be overly thick or too thin, the spokesperson said.
“This quality issue does not affect the flight safety of the aircraft in question,” said the Airbus spokesperson.
A statement continued: “Only inspections will determine where an aircraft may have panels with quality issues and the appropriate action to be taken.”
The number of jets that needed inspections for quality problem include 168 planes that are already in service, Reuters reported on Wednesday.
It is not known how long repairs could take.
The BBC has contacted major airlines that use the A320, including British Airways, American Airlines and Lufthansa Airlines for comment.
Korean Air told BBC in a statement that it is awaiting more information from Airbus to determine if any of its aircraft are affected.
Delta said that its teams have completed the required work and that there has been no effect on operations.
“This applies to a small portion of our Airbus A320 family fleet. Specifically, less than 50 A321neo aircraft,” the airline said in a statement.
Earlier this week, thousands of Airbus planes were grounded for a software update after it was discovered that intense solar radiation could interfere with onboard flight control computers.
That issue was discovered after a plane travelling between the US and Mexico suddenly lost altitude as a result of the vulnerability, injuring 15.
More than 6,000 Airbus aircraft needed emergency computer updates in one of the largest ever aviation industry recalls.
It resulted in global disruption and flight cancellations over the final weekend of November, a busy time of the year for travel – particularly in the US, where it coincided with Thanksgiving.
Airbus shares have fallen by more than 6.5% in the past five days.
Apple’s latest iPhone models are shown on display at its Regent Street, London store on the launch day of the iPhone 17.
Arjun Kharpal | CNBC
Apple will hit a record level of iPhone shipments this year driven by its latest models and a resurgence in its key market of China, research firm IDC has forecast.
The company will ship 247.4 million iPhones in 2025, up just over 6% year-on-year, IDC forecast in a report on Tuesday. That’s more than the 236 million it sold in 2021, when the iPhone 13 was released.
Apple’s predicted surge is “thanks to the phenomenal success of its latest iPhone 17 series,” Nabila Popal, senior research director at IDC, said in a statement, adding that in China, “massive demand for iPhone 17 has significantly accelerated Apple’s performance.”
Shipments are a term used by analysts to refer to the number of devices sent by a vendor to its sales channels like e-commerce partners or stores. They do not directly equate to sales but indicate the demand expected by a company for their products.
When it launched in September, investors saw the iPhone 17 series as a key set of devices for Apple, which was facing increased competition in China and questions about its artificial intelligence strategy, as Android rivals were powering on.
Apple’s shipments are expected to jump 17% year-on-year in China in the fourth quarter, IDC said, leading the research firm to forecast 3% growth in the market this year versus a previous projection of a 1% decline.
In China, local players like Huawei have been taking away market share from Apple.
IDC’s report follows on from Counterpoint Research last week which forecast Apple to ship more smartphones than Samsung in 2025 for the first time in 14 years.
Bloomberg reported last month that Apple could delay the release of the base model of its next device, the iPhone 18, until 2027, which would break its regular cycle of releasing all of its phones in fall each year. IDC said this could mean Apple’s shipments may drop by 4.2% next year.
The relationship between functional safety (FuSa) and the safety of the intended functionality (SOTIF) can be understood as two sides of the same coin: The two together result in one valuable whole. Both sides play a decisive role in modern driver assistance systems, or ADAS (advanced driver assistance systems) for short, as well as in autonomous driving (AD). FuSa addresses the classic question: What happens if a software or hardware component fails?
The idea of functional safety ensures that the system does not cause an unacceptable risk if internal malfunctions arise, such as a sensor failure or a software error. This is based on a process of structured analysis in which all relevant software and hardware errors are examined and evaluated for their effects. Effects rated as safety-critical are mitigated by technical and procedural measures. The functional safety methods are applied consistently, this being both during the concept phase and in the series implementation phase. SOTIF, the safety of the intended functionality, addresses another, equally important question: What happens if the system operates without failures but fails to master a real operating situation? This concerns the acceptability of risks that arise from the limitations of the function itself, for example when a vehicle camera is blinded by the sun or an algorithm does not detect a cyclist in a complex driving scene.
SOTIF is an exploratory discovery process in which iterations are the central tool for gradual improvement of the function design and knowledge generation. In order to achieve the overall safety of the system, FuSa and SOTIF are systemically interconnected and complement each other.
“FuSa ensures that hardware and software work reliably. SOTIF ensures that the capabilities of these reliable components are sufficiently specified and proven to operate safely in the real world,” explains Marek Hudec, Senior Manager of System Safety at Porsche Engineering. “This is because a system can be safe from the traditional FuSa standpoint, but still not safe enough from a SOTIF standpoint due to performance limitations.”
Iterative approach for SOTIF
Despite the similarity, there are differences in the process steps between FuSa and SOTIF, because an iterative approach with exploratory analysis and test methods is generally preferred to achieve SOTIF (see box on page 38). “What that means is that the developers specify, test and revise the system design until an acceptable residual risk is reached,” reports Dennis Müller, Development Engineer at Porsche Engineering. Porsche Engineering offers its customers a comprehensive solution portfolio that includes both safety methods—SOTIF and FuSa—to manage the complex development and verify and validate of driver assistance systems and autonomous driving functions.
Dennis Müller, Development Engineer at Porsche Engineering
“Among other services, we support our customers in applying the relevant standards such as ISO 26262 (FuSa) and ISO 21448 (SOTIF). This includes their implementation in existing development processes, execution of the hazard and risk analyses, drawing up safety concepts, and supporting the entire safety lifecycle,” explains Müller. “At Porsche Engineering, we ensure safety-conformated development in accordance with FuSa and SOTIF through clearly defined, integrated processes with clearly dedicated responsibilities. This guarantees conformity to standards and provides traceability.“
Porsche Engineering has many years of expertise throughout the entire development chain: From drawing up requirements to simulating and testing real vehicles, Porsche Engineering uses state-of-the-art simulation and test methods, including ones for developing warning functions, parking systems, and (partially) autonomous driving functions. As an example, one out of many results of this expertise is the modular software component called “Guardian”. It is designed to facilitate the transition from advanced Level 2 systems to highly automated Level 3 driving. It offers a robust, safe, and standard-conforming solution for the implementation of safety components for autonomous driving systems. By analyzing real driving data, potentially critical situations and special cases—referred to as corner cases and edge cases— are identified exploratively and used for data-driven scenario generation. As the responsibility of the system increases, the challenges the system is facing also become bigger. As far as functional safety is concerned, these challenges primarily consist of the fact that degradation and warning concepts can no longer rely solely on the driver, who bears sole responsibility for all vehicle maneuvers during assisted driving (Level 1) and semi-automated driving (Level 2).
This will change from Level 3 on: In this case, the systems must be able to handle failures autonomously, as the driver will no longer have a constant duty of attention. Only if the systems reach their limits must it be possible to intervene after an appropriate warning period. In principle, therefore, safe operability must continue to be guaranteed when failures occur, at least for a certain period of time – this makes the leap from Level 2 to Level 3 challenging. As a side effect, the number of redundancies in vehicle electronics is increasing rapidly—and so are the associated development workload and costs. With regard to SOTIF, the challenge lies in the depth and breadth of the set of all possible operating scenarios that the function needs to be able to master.
Marek Hudec, Senior Manager of System Safety at Porsche Engineering
“These include the continuously changing vehicle environment, the behavior of road users, and unforeseeable events, which are referred to as unknown unsafe scenarios,” says Hudec. To deal with this complexity, systems are initially designed for a defined operational design domain (ODD). The scenarios to be safely mastered are thus restricted to a systematically derived space, which is divided into discrete individual scenarios by means of a scenario portfolio. The system must ensure that the approach to the boundary of this space is detected at an early stage so that either control can be handed over to the driver or the vehicle can be stopped safely within the boundaries of the ODD. “This approach is extremely important for driver assistance development: The more responsibility a system assumes for the actual driving, the more critical it becomes to consider the safety aspects of FuSa and SOTIF,” explains Müller.
Improved safety due to redundancy
One example from practice that illustrates the different but complementary approaches of FuSa and SOTIF is an SAE Level 3 situation for automated driving on the highway in which the driver completely relinquishes responsibility. When it comes to managing hardware or software failures, FuSa is required: Suppose that the radar sensor that measures the distance to the vehicle in front has a hardware defect and is no longer providing data. This example of a fault could lead to the function relying on outdated or invalid sensor data and possibly risking a rear-end collision. That is why the experts at Porsche Engineering use deductive and inductive safety analyses to identify such failures; the analyses must be verified by safety mechanisms. In this specific case, for example, redundancy would be useful to prevent this local individual failure from leading to “global unavailability” of the sensor data, at least until the point in time when the driver again takes responsibility for driving.
SOTIF comes into play when it is a matter of mastering performance limits for automated driving on the highway. For example, vehicle detection must be designed in such a way that all other vehicles around or approaching the vehicle, including all motorcycles, are detected. However, due to the general, technically inherent performance limits of the sensors used, the vehicle may not correctly detect certain narrow silhouettes and approach trajectories under unfavorable light or weather conditions. Although the hardware and software are working flawlessly, this could cause the function to initiate a lane change that could result in a collision risk with an overtaking motorcycle. In this case, the SOTIF processes stipulate that the design must be analyzed and validated across all operating scenarios and that the weaknesses identified are corrected with the next design iteration (specification update followed by implementation update). For example, additional cameras and lidar sensors could be installed in the rear section or the sensor fusion algorithms could be optimized.
“The biggest challenge is no longer just in the system itself, but in the almost infinite complexity of reality. It is not possible to test every conceivable scenario in advance, but it is necessary to achieve sufficient coverage of the range of operation. The development process is just as complex as one would expect. SOTIF provides the framework for understanding the limits of the system and designing them safely even when all system components are functioning perfectly,” Müller explains.
Providing qualitative and quantitative evidence that a system is safe requires large amounts of test data, a considerable amount of which is generated through simulations. The biggest challenge is dealing with unknown unsafe scenarios—dangerous situations that were not taken into account during development due to insufficient specifications or that could occur due to changes in operating conditions. To discover and minimize these is the core objective of SOTIF and represents a great challenge when developing the systems. “At Porsche Engineering, we offer our customers not only individual test services, but also close and long-term cooperation to meet the enormous demands placed on ADAS/AD development and to put safe, robust, and reliable functions on the road,” promises Hudec.
Methods such as AI-based recognition of corner cases or specially trained AI models will increasingly provide developers with support for this in the future. It is already clear today the use of AI in safety-critical systems will require even more complex verification procedures in the future. This topic is addressed by the new international standard draft ISO/PAS 880, which deals with the safety of AI when it is part of the end product. Another innovation is the international draft standard ISO/TS 5083, which focuses specifically on the topic of safety of autonomous driving functions of the vehicle and takes into account not only the vehicle on-board components, but considers also the off- board components and its effect on the overall safety. This is referred to as holistic safety. The safety-oriented V2X communication between vehicles and with the infrastructure not only brings with it new safety-enhancing possibilities, but also new potential sources of faults and new dependencies. These too must be safeguarded with the same consistency—a demanding process that the experts at Porsche Engineering devote themselves to on a daily basis.
Summary
The requirements placed on the functional safety of vehicles are significantly due to the widespread use of assistance systems. The performance of the correctly implemented system in corner cases is the main focus of SOTIF. Among other things, Porsche Engineering uses data-driven and AI-based methods to master complexity and thus bring reliable systems on the road.
Info
Text first published in Porsche Engineering Magazine, issue 1/2025.
Text: Ralf Bielefeldt
Copyright: All images, videos and audio files published in this article are subject to copyright. Reproduction in whole or in part is not permitted without the written consent of Dr. Ing. h.c. F. Porsche AG. Please contact magazin@porsche-engineering.de for further information.
The European Commission is preparing a legislative proposal on Clean Corporate Vehicles. This is a big opportunity to boost demand for Made-in-EU electric cars.
Our analysis shows that already today, 73% of electric cars registered by companies were produced in the EU. For the private segment this was 63%. Because the majority of new vehicle sales in the EU are company cars, this 73% translates into 403,000 Made-in-EU EVs while for the private market this was only 184,000.
With the upcoming Clean Corporate Vehicles proposal, the European Commission can further tap into this potential. Asking the corporate market to accelerate and lead Europe’s shift to electric is legitimate:
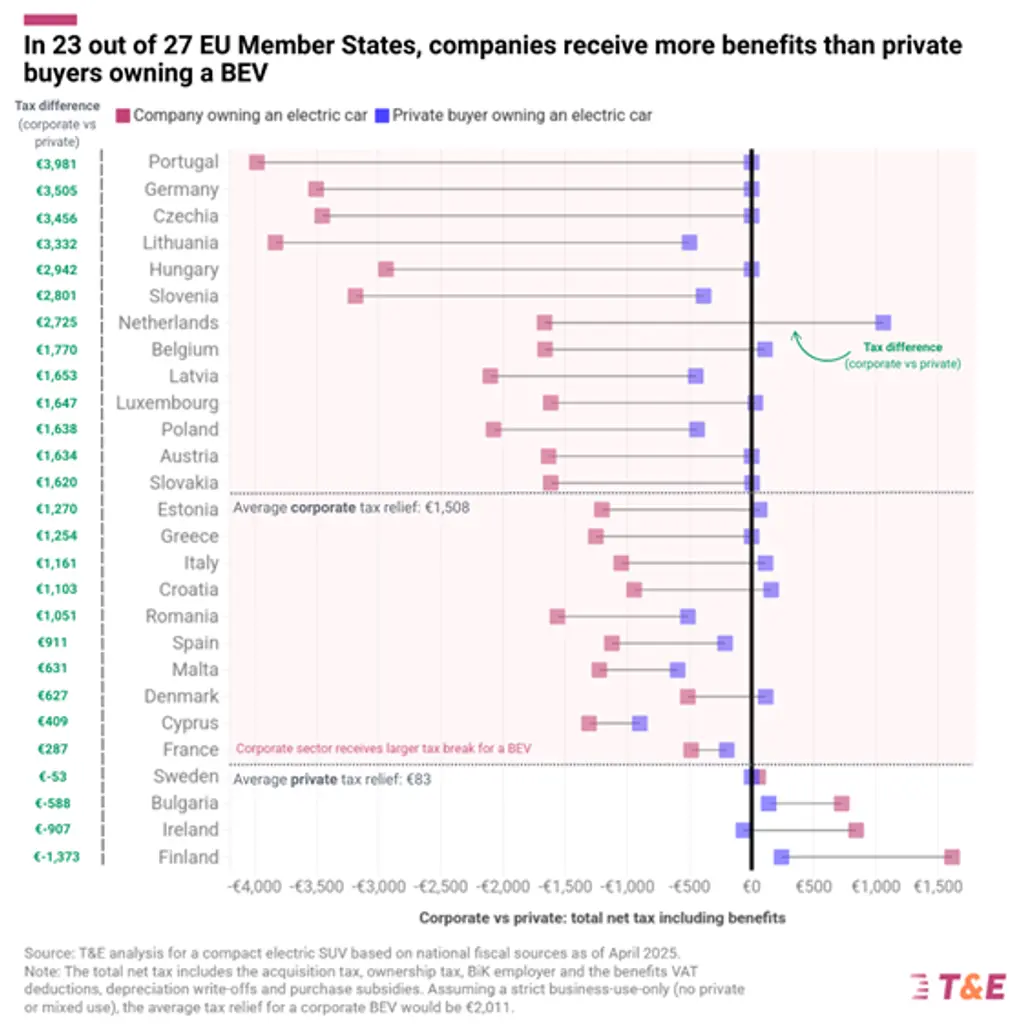
In 23 out of 27 Member States, companies receive more benefits than private buyers for owning an EV. In Germany this goes up to €14.000 per car.
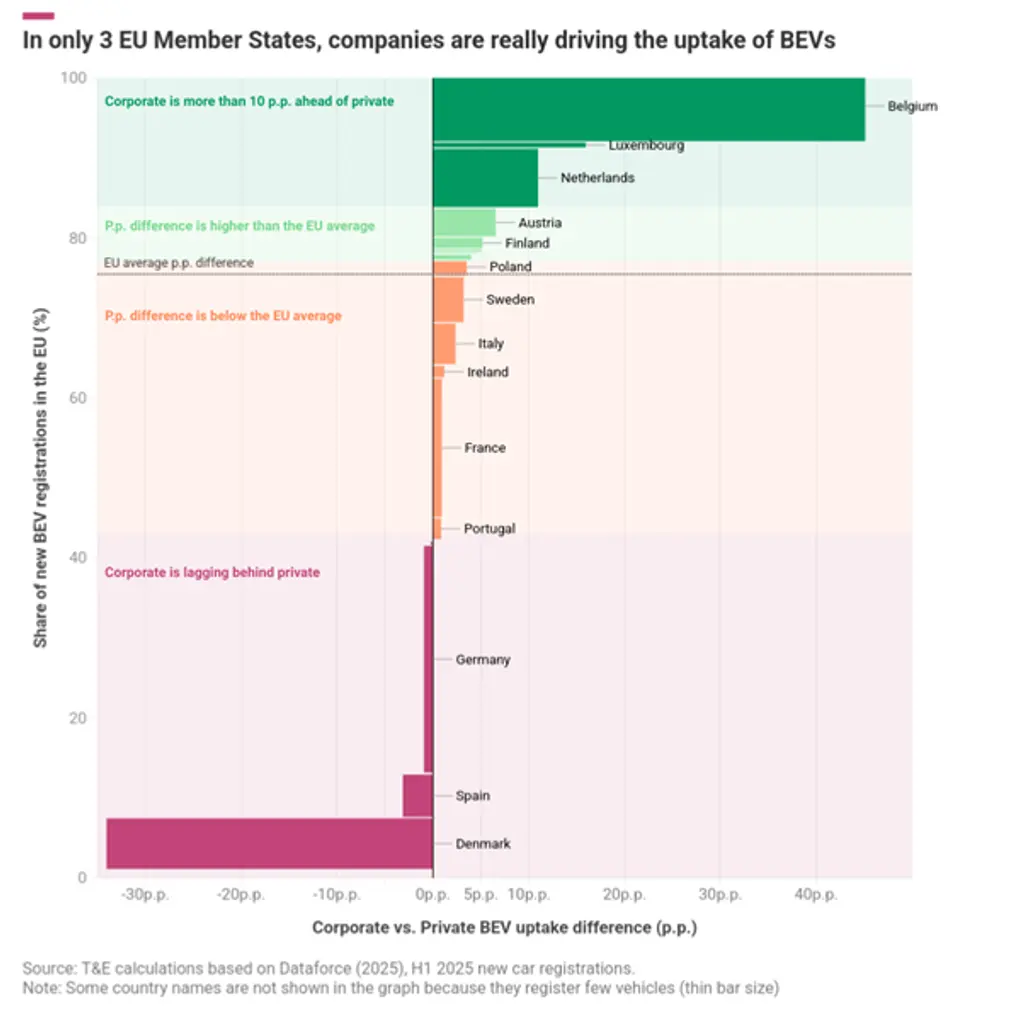
Despite such benefits, in only 3 Member States companies are really driving the uptake of electric cars.
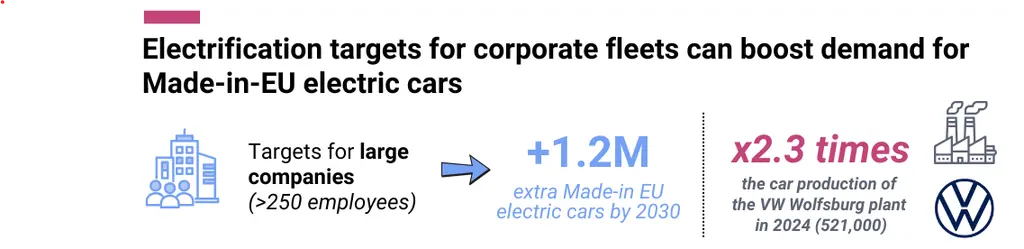
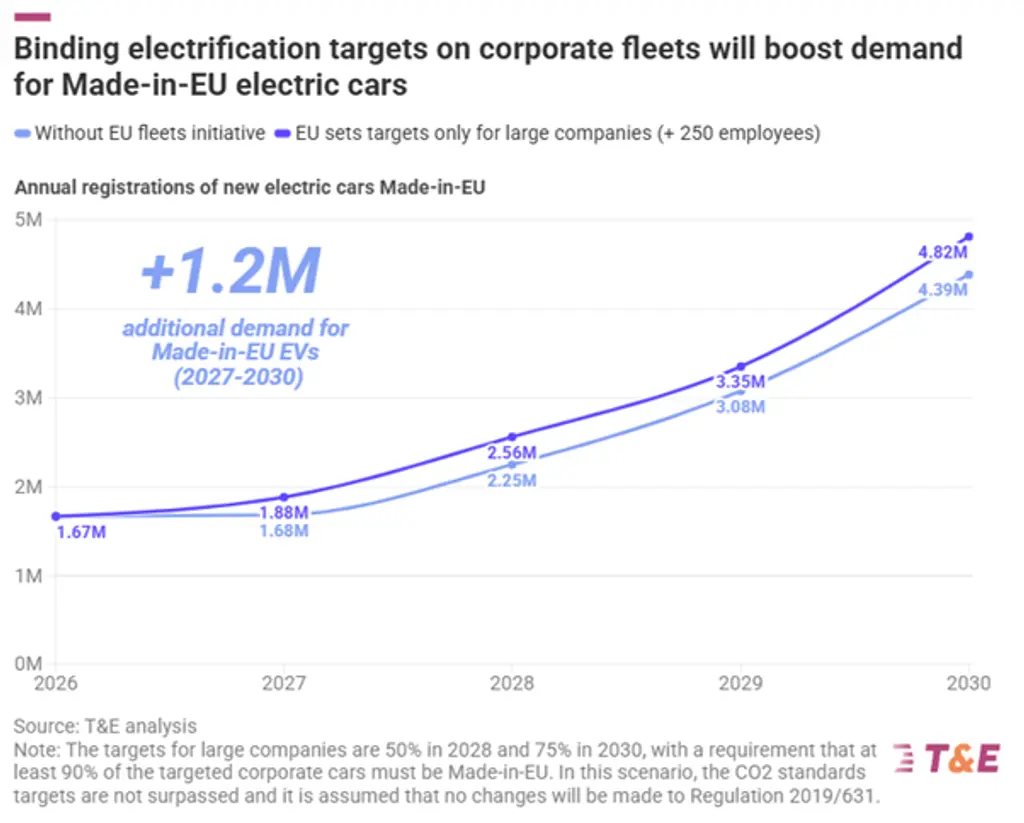
This means that the corporate market’s potential is far from exhausted: an EU-wide target (on Member States or companies) asking large corporations to electrify 75% of their new cars in 2030, with Made-in-EU requirements, could lead to an additional 1.2 million locally produced EVs by 2030.
1. Why the EC should ask companies to lead on electrification
The European Commission is preparing a legislative proposal on Clean Corporate Vehicles. This law is expected to set binding electrification targets on corporate cars – either on Member States or on large companies.
1.1.Companies benefit from tax breaks when owning an electric car
There are good reasons for the Commission to ask companies to lead Europe’s switch to electric: when companies buy or lease a car, they benefit from fiscal advantages that are not available to private buyers. Examples are VAT deductions, depreciation write-offs and Benefit-in-Kind.
In 23 out of 27 Member States, companies receive more benefits than private consumers when owning an electric car. T&E analysis shows that the average EU corporate tax relief for an EV buyer is €1,508 yearly. In Germany, where corporate EV tax benefits are among the highest, this goes up to €3,505 per year, or €14,020 over a typical ownership period of four years. Companies benefit from public money when owning an electric vehicle and should therefore drive the EU’s efforts in decarbonising road transport and boost demand for electric vehicles.
1.2.Only in three EU countries the corporate car market is clearly leading on electrification
Despite these fiscal benefits, companies are not clearly outpacing the private market in terms of electrification. This is partly due to the tax benefits that polluting company cars continue to receive. In only three EU countries the corporate market is significantly steering the adoption of BEVs (Belgium, Luxembourg, Netherlands). In large car markets such as Germany, France, Spain or Italy, their performance is underwhelming. Countries that have introduced structural fiscal reforms have a much higher corporate car electrification share. Since 2021, Belgium progressively phased out the fiscal deductibility for fossil fuel vehicles, creating a clear and growing incentive for BEV uptake. This has resulted in corporate BEV registrations of over 54% in the first half of 2025 (compared to 9% in the private market).
2. Electrifying corporate fleets brings more benefits for EU automotive industry
2.1. Companies buy more Made-in-EU EVs
Looking at the registration data of the first half year of 2025, companies tend to prefer purchasing more EVs that are made-in-EU than private households (73% against 63% for private buyers). Made-in-EU is defined as vehicles for which the final assembly line is located in the EU-27 (i.e. EVs of European brands that are produced in China and imported into the EU are not counted as Made-in-EU). Due to their high market share – 60% of new cars are corporate – and higher preference, there are 2.2 times more Made-in-EU electric cars registered by companies than private: 403,000 compared to 184,000 in just the first half of 2025.
2.2.What are the most popular EV models in the corporate and private market?
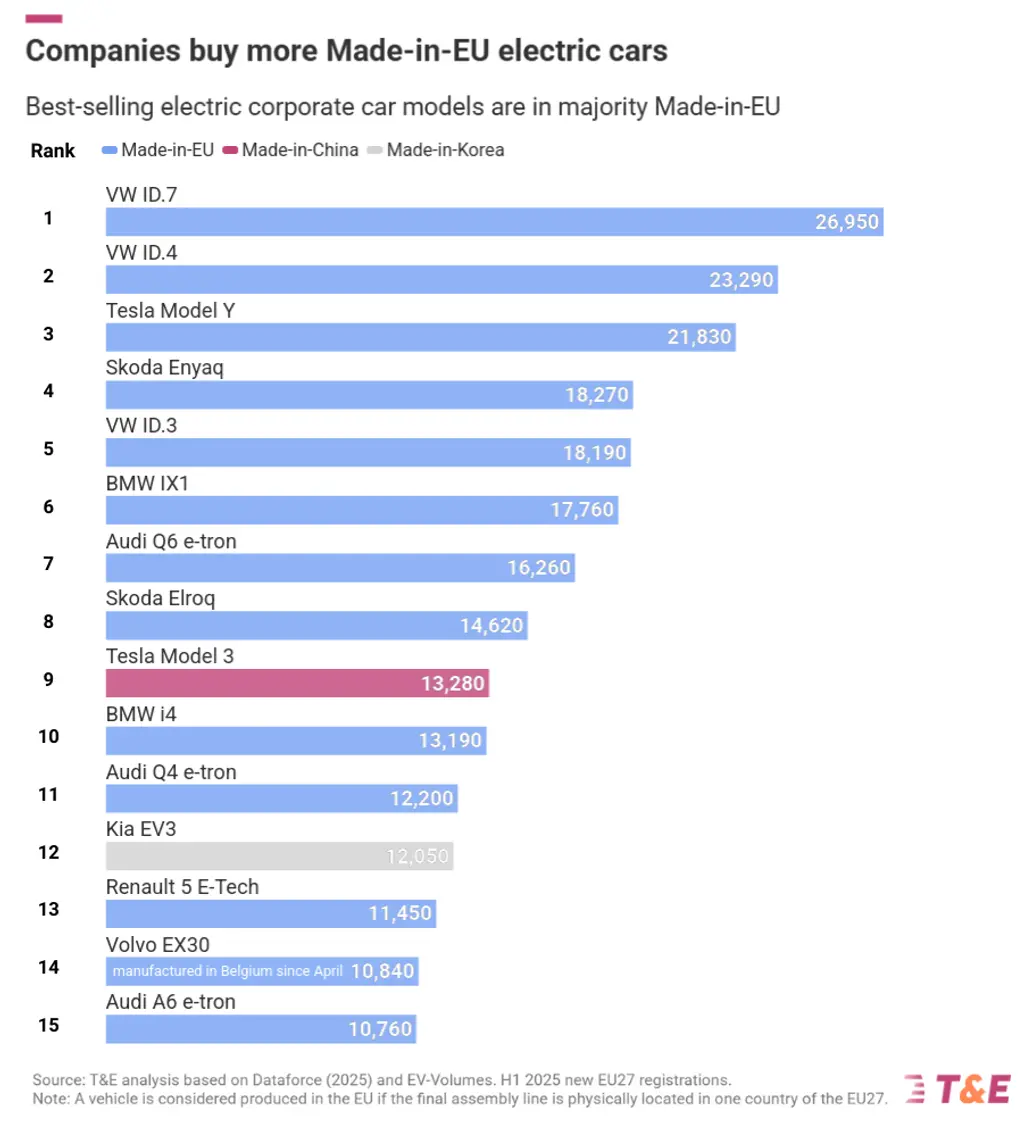
This trend is also reflected when zooming in on the most popular EV models for both the corporate and private segment: Made-in-EU EVs currently dominate the business segment, with 13 out of the 15 most popular models manufactured in the EU. For private buyers, these numbers are telling a different story: only 10 out of 15 top-selling models are EU made (see annex in full briefing attached on the left side of this page).
This gap becomes even more apparent when zooming in on the market share of the top 15 models that are not Made-in-EU (see figure below): for the corporate segment, the non Made-in-EU models (Tesla Model 3 and the Kia EV3), account for only 10% of the best-selling corporate EV sales in the first half of 2025. For the private segment, this is 32%.
3. How EU fleet targets can further boost demand for made-in-EU EVs
As T&E analysis confirms, companies currently have a higher preference for a Made-in-EU vehicle when purchasing an EV. Nevertheless, there is still a lot of untapped potential, as companies are currently not clearly leading on electrification (see Section 1). In order to assess the additional benefits of the forthcoming EU Clean Corporate Vehicles legislation on Made-in-EU EV production, we have analysed the impact of EU fleet targets on the demand for EVs produced in the EU under two scenarios.
Business as usual: without any obligations on corporate vehicles and under today’s market conditions and CO2 standards (Regulation 2019/631), we expect 13.1 million Made-in-EU electric vehicle sales between 2026 and 2030.
Binding electrification targets on Member States (only affecting large companies): in this scenario, the European Commission proposes binding ZEV-purchasing targets on large companies (+250 employees) as part of the Clean Corporate Vehicles legislation: 50% of new large company registrations by 2028, and 75% by 2030 have to be zero emission vehicles, with a requirement that at least 90% of the targeted corporate cars must be Made-in-EU. These targets would increase the demand for additional made-in-EU electric cars by 1.2 million, bringing total production to 14.3 million vehicles. For illustration: the total production of the VW Wolfsburg plant in 2024 (all powertrain types) reached 521,000 units.
Being Europe’s largest manufacturing country, the benefits for electric car production in Germany are particularly big. Results for Germany can be found in the annex.
This potential increase is crucial for Europe. It proves the CCV initiative is essential for growing the European manufacturing scale and keeping our domestic EV supply chain competitive. It achieves this industrial boost without needing to raise the ambition of current CO2 emission standards.
4. Policy recommendations
To fully unlock the potential of the corporate car market to drive both the clean transition and the competitiveness of European car manufacturers, the European Commission should:
1
Propose a Regulation on Clean Corporate Vehicles: corporate fleets make up 60% of new cars and therefore have a lot of potential for both decarbonisation and European car manufacturing. Today, however, the corporate segment is not really leading on electrification in most Member States, despite existing tax benefits and incentives.
2
Include ambitious, binding ZEV-targets: the Regulation must set ambitious, binding Zero-Emission Vehicle (ZEV) targets on Member States. When designing national policies, SMEs should be exempted from any requirements to obtain the targets. Instead, Member States should aim their measures at large companies (+250 employees) in order to tap into the industrial potential of corporate vehicles while limiting the impact on European businesses.
3
Introduce local content requirements: this legislation should also include Made-in-EU requirements to further boost domestic EV production. By doing so, the Commission should clearly define what Made-in-EU EVs and batteries are and set up a transparent methodology rewarding Made-in-EU EVs, batteries, key components and materials.
To mark UN International Day of Persons with Disabilities, five Ingka Group co-workers across its retail operations, from Portugal to the Netherlands and China shared their experiences, why inclusion matters and why accessibility is essential. Their reflections help Ingka Group listen, learn and continue improving on its journey to be disability inclusive.
“At Ingka Group, we believe every co-worker is a talent and we want every co-worker to feel they can be their full selves at work. These stories from our colleagues around the world, remind us that disability is part of the human experience, visible or invisible, temporary or permanent, and that inclusion is something we build together every day,” says Buks Akinseye, Global Equality, Diversity & Inclusion Manager, Ingka Group.
“We are on the way and continue to take steps to strengthen accessibility and disability inclusion. This includes developing and piloting global accessibility standards in our workplaces, offering workplace adjustments so people can work at their best, and working with organisations such as the Valuable 500 and the Business Disability Forum to further strengthen our approach. We are also improving customer experiences and embedding accessibility into our digital and product range across markets. Our journey continues, and we remain committed to creating a better everyday life that includes everyone,” he adds.
Monique in the Netherlands, rebuilding her life after a brain haemorrhage; Madalena in Portugal, challenging assumptions about blindness in the workplace; Liu in China, thriving with hearing loss thanks to redesigned workflows. Their stories reflect Ingka Group’s belief that every co-worker is a talent and the company’s ambition to create a place where everyone feels a sense of belonging.
Monique, Sales Co-worker, IKEA Netherlands
After a brain haemorrhage paralysed my right side, I spent two years in rehabilitation before returning to IKEA. My old role had physical demands I could no longer meet, and I became more sensitive to noise and stimuli. My colleagues, with the best intentions, tried to protect me by taking over my tasks. They were afraid I wouldn’t be able to handle them.
I appreciated their support, but I also wanted the chance to discover my own limits and strengths again. Once we started having those conversations, everything changed. My team learned when to step in and when to not, and their support is everything. Some days are tough, but my willpower is tougher.
Liu, Fulfilment Operations Co-worker, IKEA China
Living with hearing loss, communication used to be a barrier in other workplaces. Losing my hearing gradually from childhood meant adapting constantly, and it shaped how I understood myself and what I thought I could do. Joining IKEA in 2024 was a turning point, because my team welcomed me warmly and made sure I never faced tasks or communication alone. Having a buddy to guide me, a manager who checked in, and colleagues who cared gave me confidence I hadn’t felt in other workplaces.
At IKEA, my team redesigned walkways, created a digital handover tool and made sure I always felt included. The redesigned walkways and the digital handover tool weren’t just practical solutions; they showed me that accessibility was taken seriously. Over time, I grew more independent, took on new responsibilities, earned my forklift licence, and even began helping customers at the pickup counter. I worried people thought I couldn’t handle the job, but with the right support and tools, I’m as capable as everybody else.
Sherry, Resolutions Generalist, IKEA China
After facing discrimination in past jobs due to scoliosis and chronic pain, joining IKEA changed everything, from accessible facilities to a caring team that believed in me. I grew up in the countryside, and after a serious fall as a child, the long-term pain and visible impact on my posture affected how people treated me in previous workplaces. One manager even stopped me from meeting customers because of how I looked, and that broke my spirit.
But at IKEA, from my very first interview, I felt respect and fairness, no assumptions, just care. On day one, I noticed barrier-free restrooms, adjustable desks, and a team that truly supported me. My buddy checked in, my manager cared, and I began to thrive. Today, my productivity matches my colleagues’, customers praise my work and speaking on stage at our annual kick-off for the new financial year, filled me with pride. To anyone facing struggles: don’t give up. Keep a positive mindset, and you’ll find your path.
Florence, Product Specialist, IKEA France
I’m passionate about disability inclusion. In 2012–2013, I was diagnosed with Crohn’s disease, arthritis, and later, autism. It was a difficult period, and I took nearly a year of sick leave to focus on my health. When I was ready to return, IKEA supported my transition into a role that better suited my needs. Today, I work mostly remotely, thanks to flexible arrangements and a caring team.
Living with invisible conditions can be challenging. People don’t always understand what they can’t see, and assumptions can quickly take hold. That is why I advocate for more awareness around neurodivergence and accessibility. I’ve heard comments suggesting that people with disabilities are less productive or receive unfair advantages and we need to challenge that thinking. Try to let go of the idea that people with disabilities are less productive or need help with everything. Let’s all uphold values of compassion, whether with colleagues or customers.
Related links:
Better lives | Ingka Group – People are at the heart of everything we do. From gender equal pay to inclusive workplaces. We want to take a leading role in creating a fairer and more equal society and to improve the lives of the millions of people that interact with, or are impacted by, our company.
*World Health Organization – World Health Organization
About Ingka Group
With IKEA retail operations in 31 markets, Ingka Group is the largest IKEA retailer and represents 87% of IKEA retail sales. It is a strategic partner to develop and innovate the IKEA business and help define common IKEA strategies. Ingka Group owns and operates IKEA sales channels under franchise agreements with Inter IKEA Systems B.V. It has three business areas: IKEA Retail, Ingka Investments and Ingka Centres. Read more on Ingka.com.
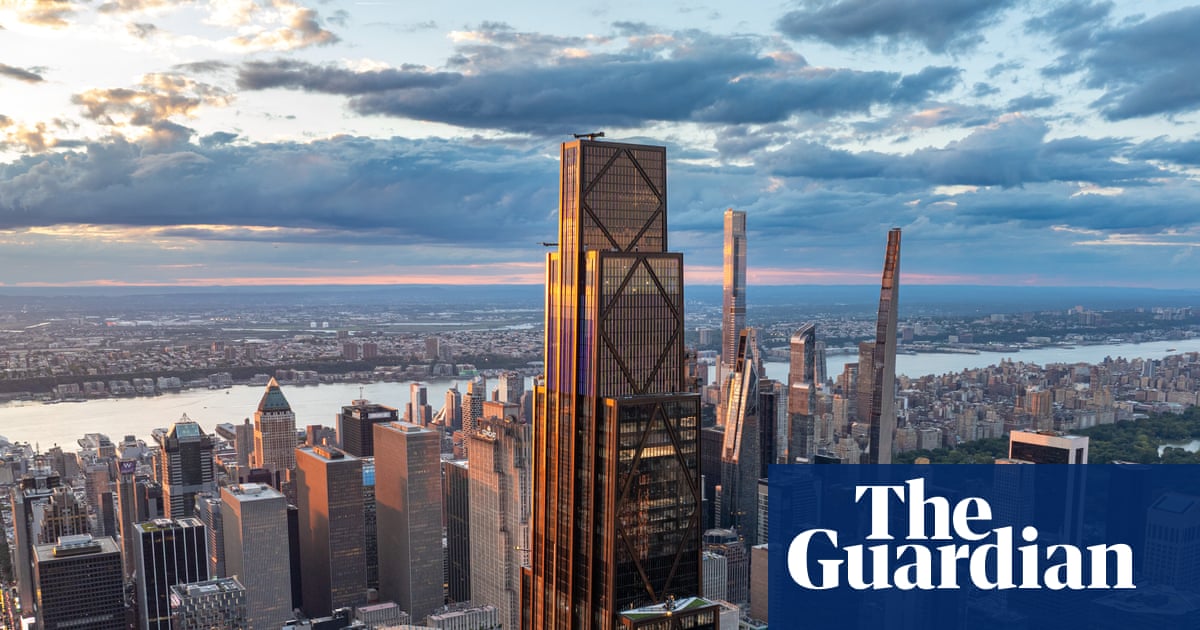
Among the slender needles and elegant spires of the Manhattan skyline, a mountainous lump has reared into view. It galumphs its way up above the others, climbing in bulky steps with the look of several towers strapped together, forming a dark, looming mass. From some angles it forms the silhouette of a hulking bar chart. From others, it glowers like a coffin, ready to swallow the dainty Chrysler building that trembles in its shadow. It is New York’s final boss, a brawny, bronzed behemoth that now lords it over the city with a brutish swagger.
Fittingly, this is the new global headquarters of JP Morgan, the world’s biggest bank. The firm enjoys a market capitalisation of $855bn (£645bn), more than Bank of America, Wells Fargo and Citigroup’s combined, and it looks as if it might have swallowed all three inside its tinted glass envelope. Last year, for the first time, it made more than $1bn a week in profits. Chairman and chief executive Jamie Dimon likes to boast of its “fortress balance sheet”, and he now has an actual fortress to go with it – built at a cost, he revealed at the opening, of around $4bn. He has certainly made his mark. It would be hard to design a more menacing building if you tried.
The Brobdingnagian pile is the work of Foster+Partners, led by the 90-year-old Norman Foster, who is no stranger to penning extravagant bank headquarters. His HSBC tower in Hong Kong was the world’s most expensive building when it opened in 1986, standing as a costly essay in structural redundancy, with a stack of steel suspension bridges bolted to its facade. It was described by one former partner as “a sledgehammer to crack a nut”. In comparison, the JP Morgan tower is like using a bronze-plated bulldozer to puree a pea.
Exploding … steel columns at street level. Photograph: Nigel Young/Nigel Young, courtesy of Foster + Partners.
The sheer amount of structural steel – 95,000 tonnes in total – is obscene for a building that contains just 60 storeys in its 423-metre height, half the number of floors you might expect in such a colossus. It uses 60% more steel than the Empire State Building, which is taller and has more square footage. One leading engineer calculated that if the steel was flattened into a belt (30mm wide by 5mm thick), it would wrap the world twice – an apt symbol of the bank’s throttling global domination.
If the building is a bullying affront to the skyline, it is just as domineering at street level. It erupts from the sidewalk with gargantuan bunches of steel columns that fan out at each corner, clutching the base of the tower like Nosferatu fingers. Positioned to dodge train tracks below, the columns splay out to hold the building’s swollen mass ominously above new strips of privately owned “public space”, where shallow steps and planters look designed to deter lingering. To the west, on Madison Avenue, the building greets the street with an incongruous cliff face of carved granite boulders. This, it turns out, is an artwork by Maya Lin, who has achieved the impressive feat of making real stone look like fibreglass scenery from Disney’s Frontierland, complete with morsels of mossy garnish clinging to the cracks.
On the other side of the block, along Park Avenue, the security guards will let you peer through the windows to admire a US flag hanging from a 12-metre high bronze flagpole at the top of a staircase in the lobby, which, in another surreal twist, flutters in an artificial indoor breeze. It is a rare artwork by Lord Foster himself, who intended the flag’s movement to reflect the wind conditions outside. On the calm, still day of my visit, it was billowing at a stiff clip. In this “city within a city”, JP Morgan gets to dictate the weather it wants.
Inside, everything is colossal. Great walls of fluted travertine, sourced from a single quarry in Italy, rise up through the 24-metre-high lobby, flanking a grand travertine staircase framed by a pair of huge Gerhard Richter paintings. Banks of elevators shuttle the 10,000 workers up into a vertical office-wellness universe, complete with a 19-restaurant food court (with kitchen-to-desk delivery), a hair salon, meditation rooms, fitness centre, medical clinic and a pub. The column-free office floors are fitted with circadian rhythm lighting, creating a carefully calibrated environment, detached from the outside world in the manner of a Las Vegas casino, in the hope that employees might never leave their desks. Dimon is serious about getting everyone back to the office full-time, despite the pleas of his staff. This is his machine to crush the hybrid-working movement once and for all.
Surreal twist … the lobby flag that blows in an artificial breeze. Photograph: Nigel Young/Nigel Young, courtesy of Foster + Partners.
The ceiling heights may be lofty (adding many more cubic metres of air to heat and cool), but when an image of the new trading floors was posted on social media, condemnation was swift. Comparisons were made to factory-farmed chickens, Chinese sweatshops, and the very 1950s cellular office space that open-plan layouts are intended to avoid. A conspicuous steel truss zigzagging through the space somewhat undermines the “column-free” claims, and raises questions over the building’s structural logic. One engineer who has studied the plans notes that adding a few more columns and reducing the spans by a couple of metres could have reduced the building’s carbon footprint by 20-30%. But then Foster and Dimon wouldn’t have got the heroic, protein-fuelled steelwork they so desired, slicing its way through the building in monumental Vs.
Beyond the structural braggadocio, they were also keen to dial up the theatrics by night. Every evening, for miles around, New Yorkers can now gaze in wonder and horror as the tower’s summit transforms into a glittering crown, bubbling with twinkling lights that rise up the facade like a supersized flute of champagne. It is the work of Leo Villareal, who recently illuminated the Thames bridges. Sometimes, the throbbing diamond shape adds an inescapable Eye of Sauron vibe. At other moments, it appears to shift into a pulsating yonic void.
Vajazzled steeple aside, what makes the tower’s pumped-up extravagance so galling is that it saw a perfectly good office building needlessly bulldozed. The 52-storey Union Carbide headquarters, built in 1960 as the celebrated work of Natalie de Bois at SOM, stood as a sleek, Miesian monolith. It had even undergone a full refurbishment and environmental upgrade in 2012 – trumpeted by JP Morgan at the time as “the largest green renovation of a headquarters building in the world”. Just seven years later, at the hands of the same ruthless bank, it became the tallest building ever to be intentionally demolished. To be replaced by something almost twice the height, but with just eight extra floors.
A touch of Vegas casino … a carefully calibrated enviroment detaches employees from the outside world. Photograph: Nigel Young/Nigel Young, courtesy of Foster + Partners.
The reason this happened, beyond ego and greed, can be traced to a 2017 zoning change. There had been a growing fear among landlords in East Midtown that the area was losing its lustre as the world’s pre-eminent business address. Office tenants were flocking west, to the glistening new shafts of Hudson Yards, in what is known, in real estate lingo, as the “flight to quality”. The city’s solution, in a shortsighted act of self-sabotage, was to allow Midtown to shape itself after the soulless corporate wasteland of Hudson Yards. Incentives were introduced to encourage demolition, including allowing the sale of unused “air rights” from landmarked buildings within the 78-block area. This means that historical structures that didn’t fill the maximum bulk allowed on their plots could sell their unused potential to others. JP Morgan acquired 65,000 square metres of air rights from Grand Central station, and 5,000 square metres from St Bartholomew’s church nearby, allowing it to inflate its size far beyond the usual limits.
What few might have predicted is the cumulative effect that unleashing this scale of development might have. The JP Morgan tower is not a one-off, but merely the first of a whole new breed of steroidal supertalls. An even bigger 487-metre high, 62-storey tower was recently granted permission at 350 Park Avenue nearby, also designed by Foster+Partners as another bunch of towers strapped together, with the look of a discount bulk-buy. SOM won permission for a similarly sized monster at 175 Park Avenue, set to pierce the ground with more fans of columns converging to a point. This part of Midtown will soon resemble a huddle of bloated bankers squeezed into stilettos, casting ever longer shadows down the canyons of Manhattan and obliterating views of the city’s cherished peaks, while crushing a generation of handsome, usable buildings beneath them.
From a distance, across the pond, you might care little about the fate of New York. It is a place long shaped by the forces of unbridled capital, where form follows finance and landowners get to build “as of right”, citizens be damned. But Foster’s bronze goliath is a prelude of what might soon come to London, on an even bigger scale. Last week, JP Morgan announced that it will begin work on a 280,000 square metre European headquarters in Canary Wharf – by far the biggest office building in the capital, containing more space than the Shard, Gherkin and Walkie-Talkie combined. The design, also by Foster+Partners, has only been teased with a glimpse of a ground-level corner, showing some curved bronze fins wrapping a bulging glass drum. Brace yourselves for what’s out of shot.
The opening of the Regional Cyber Center not only strengthens Leonardo’s positioning as a leader in global security, but also consolidates Malaysia’s role as a strategic hub for the Southeast Asia
The Global CyberSec Center based in Kuala Lumpur joins Leonardo’s global network, which already includes the federated centers in Chieti, Bristol, Brussels and Riyadh
The opening of the new Regional Cyber Center strengthens Leonardo’s positioning as a leader in technologies for global security. The inauguration, which took place today in the presence of the Malaysian Minister of Communications, Yang Berhormat Datuk Fahami Fadzil, underlines the company’s commitment to ensuring global security, responding proactively to today’s increasingly complex and rapidly evolving cyber threats.
The strategic choice of Malaysia reflects the country’s leading role in cybersecurity. Malaysia stands out in the region for its advanced legislation on the subject and its protection of critical national infrastructure. Leveraging the integration of Leonardo’s proprietary technologies in the field of cyber security, physical security and mission-critical communications and its experience in strategic sectors in Italy and abroad, the new Center will make a substantial contribution to global protection against new hybrid threats, strengthening the digital autonomy and supporting the sustainable development of Malaysia and the entire region.
The new center in Kuala Lumpur is part of the Global CyberSec Center (GCC), Leonardo’s trusted and mission-critical cybersecurity service provider headquartered in Chieti (Italy), and joins the already operational federated Regional Cyber Centers in Brussels (European Union), Bristol (United Kingdom) and Riyadh (Saudi Arabia). The GCC’s global network is designed to ensure cyber mission assurance for strategic customers – including defence organisations and critical national infrastructures – by pooling processes, information on threats, and cutting-edge technologies. This federated model ensures both the ability to operate on a global scale in preventing, countering and responding to new threats, and the control of strategic data, fully respecting individual national sovereignty.
“This initiative is a long-term investment reflecting Leonardo’s major commitment to building a strong industrial and technological partnership with Malaysia while contributing to the development of high specialised local human capital. In a world where cyber self-reliance has become the new currency of stability, we enable National Strategic Organizations to assure security and continuity of their operations leveraging our Global CyberSec Platform. Through this investment in Malaysia, our objective is to support the transformation of critical infrastructures, such as National Cloud and National Security Operation Centers, into autonomous strategic assets”. States Andrea Campora, Leonardo’s Managing Director Cyber & Security Solutions Division.
The inauguration of the new regional Cyber Center in Malaysia represents a key milestone in Leonardo’s long-term strategy of expanding its international presence in the country and throughout the region. The initiative, combined with recent acquisitions in Zero Trust architecture, further strengthens Leonardo’s leading role in ensuring global security, and consolidates Malaysia as a crucial and strategic hub for the Southeast Asia and, in perspective, for the Far East.
Leonardo has had an established presence in Malaysia for over forty years, making a significant contribution to its defence and aerospace sectors. Over the decades, the company has supported the country with a comprehensive portfolio of advanced solutions, including helicopters for military and commercial operations, military aircraft, integrated defence systems – such as radar and both naval and electronic warfare capabilities – and security solutions for critical infrastructure and mission-critical communications.
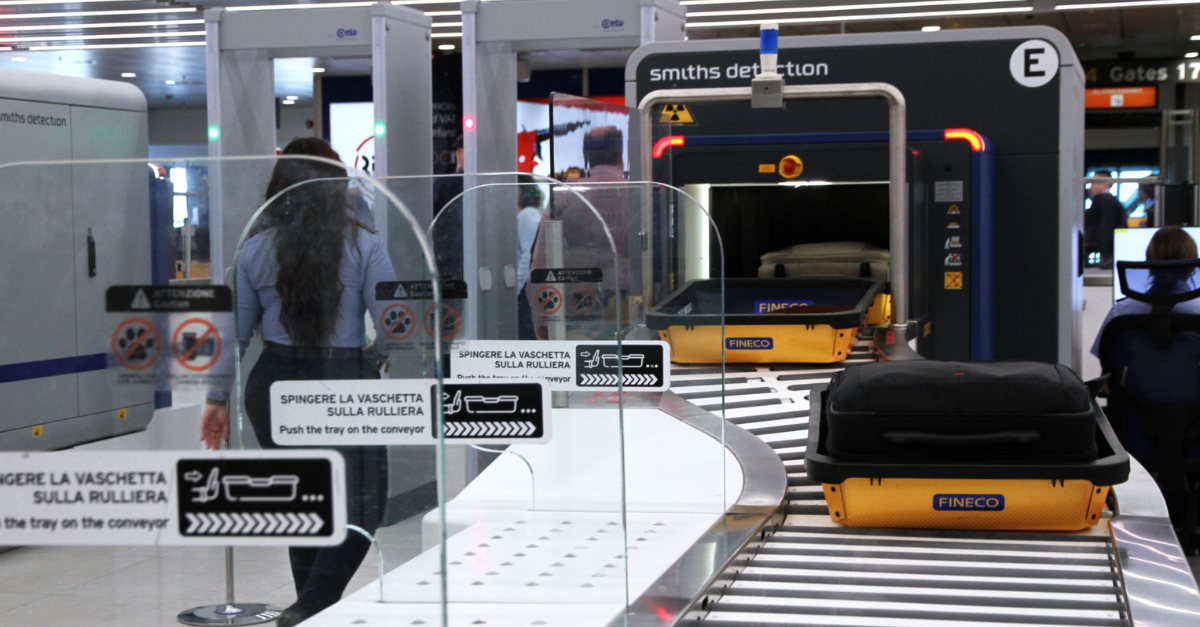
CVC, one of the world’s leading private markets investment firms, today announced that it has entered into an agreement to acquire Smiths Detection, a global leader in threat-detection and security-screening technologies for airports and critical infrastructure, from Smiths Group plc. Leveraging CVC’s extensive experience in executing corporate carve-outs and history of scaling newly independent companies, Smiths Detection is well placed to build on its strong market positions and unlock substantial long-term value.
Headquartered in the UK, Smiths Detection employs 3,400 people, including over 1,100 field service engineers and over 500 R&D professionals and operates from facilities across Europe, the US and Asia. The business has a global #1 position in aviation security – i.e. screening technology for carry-on bags, hold luggage, and air cargo at airports – where it serves 47 of the world’s top 50 airports, with both industry-leading hardware and sector-leading digital capabilities, including automated detection algorithms. Smiths Detection also serves other critical infrastructure end markets such as urban security (screening systems for government and commercial buildings, public venues and spaces ) and ports and borders (cargo and vehicle inspection) and the business has a leading niche chemical threat identification capability for defense end markets.
Dominic Murphy, a Managing Partner and Co-Head of the UK private equity team at CVC and Conor Keogh, Managing Director at CVC, said: “Smiths Detection’s industry-leading threat detection and security screening technologies play a crucial role in helping protect people and critical infrastructure worldwide. We look forward to supporting the business during the next phase of its growth and development through continued investment in technology innovation, high-quality engineering and best-in-class aftermarket service.”
James Mahoney, Partner and Head of CVC’s private equity activities in the Aviation, Defence & Space sectors added: “We are excited to partner with Jérôme de Chassey and his team. Smiths Detection’s strong market positions, anchored by its global leadership in aviation, create a compelling platform for long-term value creation.”
The transaction is subject to customary regulatory approvals and is expected to close in the second half of 2026. Barclays acted as financial advisor and Latham & Watkins acted as legal counsel to CVC.
The investment will be made through CVC Capital Partners IX.
BANGKOK — Asian shares were mixed Wednesday after stocks on Wall Street held steadier as both bond yields and bitcoin stabilized.
U.S. futures rose and oil prices edged higher.
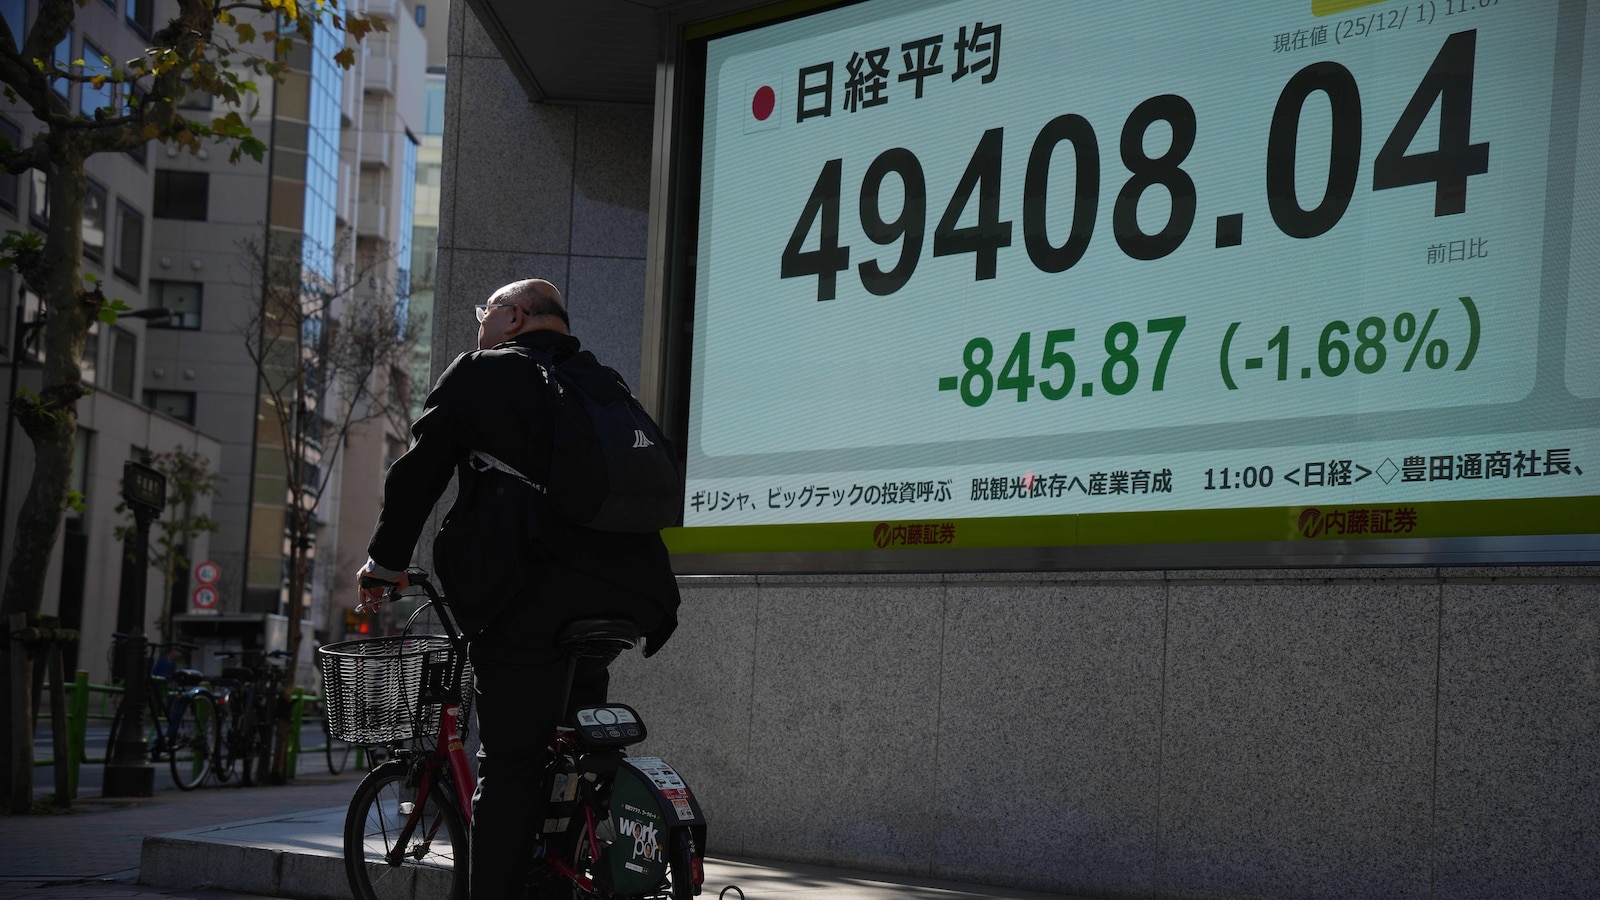
Tokyo’s Nikkei 225 jumped 1.6% to 50,063.65 on big gains for technology shares like Tokyo Electron, which jumped 5.6%. Adventest, a maker of computer chip testing equipment, surged 6.9%.
Technology and telecoms giant SoftBank Group Corp. surged more than 8% following reports that its founder, Masayoshi Son, regretted having to sell shares in computer chip maker Nvidia to help pay for other investments. The company’s share price sank after it announced last month that it had sold the shares for $5.8 billion.
South Korea’s Kospi also got a lift from tech shares, gaining 1.2% to 4,042.40. Shares in Samsung Electronics, the country’s biggest company, rose 1.8%.
But Chinese markets declined following the release of data showing weaker factory activity.
Hong Kong’s Hang Seng fell 1.1% to 25,797.24, while the Shanghai Composite index shed 0.3% to 3,885.36.
Australia’s S&P/ASX 200 edged 0.2% higher, to 8,595.20.
On Tuesday, the S&P 500 rose 0.2% to 6,829.37. The Dow Jones Industrial Average added 0.4% to 47,474.46, and the Nasdaq composite gained 0.6% to 23,413.67.
Boeing soared 10.1% and was one of the strongest forces lifting the S&P 500. Chief Financial Officer Jay Malave said the plane maker expects growth next year in an underlying measure of how much cash it produces.
Database company MongoDB also helped lead the market, jumping 22.2% after it delivered stronger results for the latest quarter than analysts expected.
They helped offset a 6.8% drop for Signet Jewelers, which gave a forecast for revenue in the holiday shopping season that fell short of analysts’ expectations. The jeweler said it’s expecting “a measured consumer environment.”
Another potential warning about U.S. shoppers’ strength came from the chief financial officer of Procter & Gamble, the giant behind Tide detergent and Ivory soap, whose shares slipped 1.1%.
The U.S. economy has been holding up overall, but that’s masking sharp divisions beneath the surface. Lower-income households are struggling with higher prices while richer households are benefiting from a stock market that’s within 1% of its all-time high set in late October.
In the bond market, Treasury yields calmed following their jumps the day before. The 10-year yield edged down to 4.08% from 4.09% late Monday, while the two-year yield eased to 3.51% from 3.54%.
Higher yields can drag prices lower for all kinds of investments, and those seen as the most expensive can take the biggest hit.
Monday’s climb in Treasury yields came after the governor of the Bank of Japan hinted that it may raise interest rates there soon. But hopes are still high that the Federal Reserve will cut its main interest rate when it meets in Washington next week.
The Japanese central bank is likely to raise its benchmark rate at its Dec. 19 meeting, Tan Boon Heng of Mizuho Bank in Singapore, because failing to do so could lead investors to sell off Japanese yen.
“Yet, delivering a ‘done deal’ hike may perversely deny any appreciable JPY (Japanese yen) gains, whilst boosting long-end yields,” he said in a report.
The Fed has already cut its overnight interest rate twice this year in hopes of shoring up a slowing job market. But lower rates can fan inflation, which has stubbornly remained above its 2% target.
Complicating things is the U.S. government’s earlier shutdown, which delayed reports on the job market and other areas of the economy.
In other dealings early Wednesday, bitcoin, which tumbled below $85,000 on Monday as bond yields worldwide marched higher, rose to $94,000.
U.S. benchmark crude oil edged 3 cents higher to $58.67 per barrel. Brent crude, the international standard, gained 4 cents to $62.49 per barrel.
The U.S. dollar slipped to 155.68 Japanese yen from 155.87 yen. The euro rose to $1.1645 from $1.1626.
___
AP Business Writers Matt Ott and Stan Choe contributed.