In the Cape York community of Wujal Wujal, local service providers used to hold their breath every time a big storm rolled in. Cloud cover could knock out their satellite internet just when they needed it most.
Since installing Starlink’s low Earth orbit (LEO) satellite service, however, everything from video calls to uploading files has become far more reliable – even in heavy rain. People report there is now no lag, whereas with the previous service, Sky Muster, even cloud cover could cause the internet to stop working.
Reliable connectivity is crucial in an emergency. When nearly half the buildings in Wujal Wujal were destroyed by the December 2023 flood following Cyclone Jasper, and the fibre-optic cable was broken, Starlink provided the only reliable communications in the aftermath.
Examples like this help explain why Starlink has grown so quickly in remote Australia. With high speeds, low latency and data that works in wet weather, it has become the preferred option for agencies and businesses frustrated with older technologies. There are now more than 200,000 Starlink subscriptions in Australia, compared with about 80,000 NBN Sky Muster services.
But our research as part of the Mapping the Digital Gap project shows Starlink is creating a new kind of digital divide in remote First Nations communities – not just between cities and the bush, but within communities themselves. A small minority now enjoy fast, reliable Starlink, while First Nations households predominantly use prepaid mobile services, where mobile is available, with high-priced but limited data.
Twice the rate of digital exclusion – and worse in remote communities
The new Mapping the Digital Gap 2025 outcomes report finds First Nations Australians are twice as likely as other Australians to be digitally excluded.
Nationally, using the Australian Digital Inclusion Index measure out of 100, First Nations score on average 63.4, where non–First Nations Australians average 73.9 – a “digital gap” of 10.5 points. In the very remote communities we visited, this gap more than doubles to 24.2, with three in four people digitally excluded.
Access to reliable and affordable connectivity and devices is the biggest driver. Access scores in very remote First Nations communities sit 42.4 points below those of non-First Nations Australians – far larger than gaps for affordability or digital ability.
There is some good news. Digital ability has improved by nearly nine points in two years, and daily internet use has risen from 44% to 62%. But this still lags far behind other Australians, 95% of whom go online daily.
In short, people are trying harder than ever to get online – but face barriers of infrastructure, pricing and limited digital support.
Starlink for agencies, prepaid mobiles for everyone else
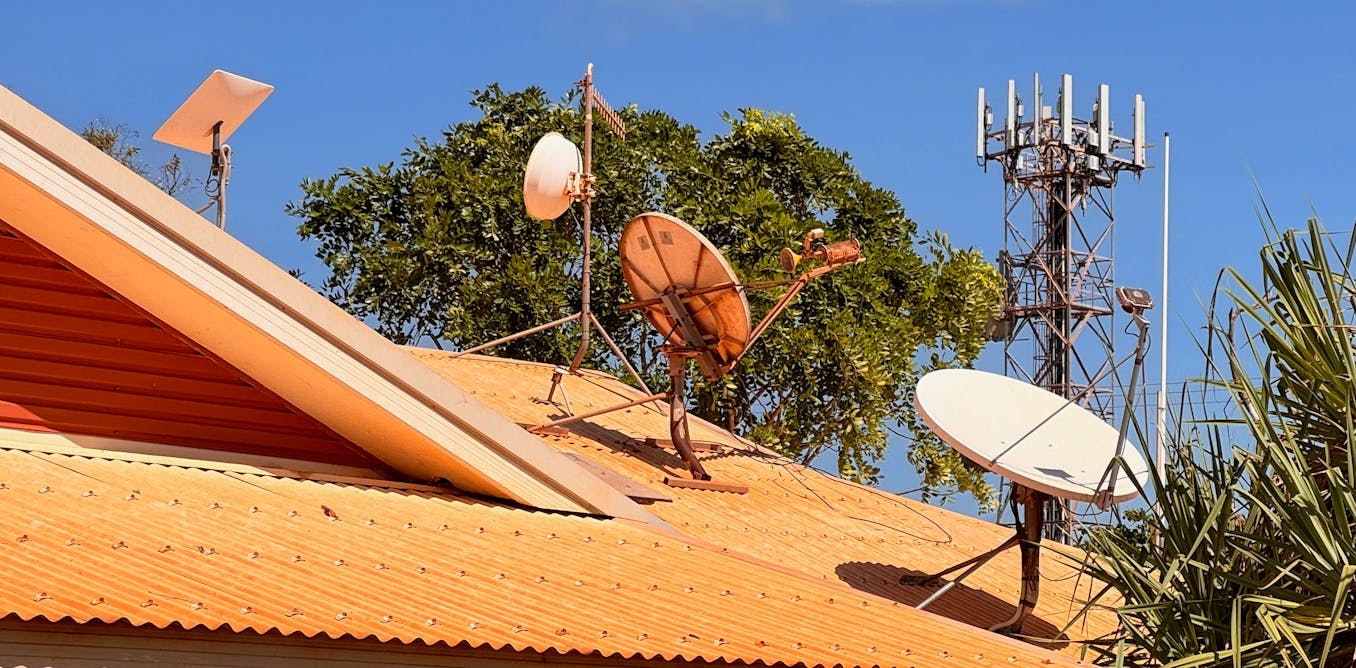
Starlink arrived in northern Australia in late 2022 and spread quickly across our research sites. Schools, councils, health services and police adopted it to get around mobile congestion and weather-related dropouts.
As one coordinator in Wadeye said, “We used to just stop working at three … 1764719613 we’ve all been Elon Musked.”
The rapid uptake shows remote communities are often early adopters. In Wilcannia, café owner Shona Cook says they “went straight to Starlink because we know that it works out in regional areas […] everything you need” now runs on it.
But Starlink remains out of reach for most First Nations households. Across sites such as Wilcannia and Wujal Wujal, only 1–2% had adopted it by 2024. Upfront equipment costs of A$500 to A$600 and monthly fees of A$139 are simply unaffordable.
Instead, nearly everyone relies on mobile phones. In 2024, 99% of First Nations mobile users in remote communities were on prepaid plans.
Many households reported spending more than A$280 a month on data, with large households often exceeding A$400 – for slow speeds, data limits and patchy coverage. Those spending the most, relative to income, often get the worst internet.
A new ‘elite’ infrastructure
This pattern is creating a localised divide. Agencies, contractors and a few higher-income residents enjoy fast Starlink. At the same time, most others are left with congested 4G, legacy satellite services and costly, limited prepaid data.
One Wilcannia resident can now send “massive files within two minutes” and stream reliably, but said: “If there was a cheaper way […] we’d definitely look at that.”
Without intervention, Starlink risks becoming “elite” infrastructure: a premium service for those who can pay, while others juggle multiple prepaid services, share phones, and sacrifice speed and reliability just to stay connected.
How to make Starlink part of the solution
Other low Earth orbit satellite internet businesses are entering the market, too. From 2026, the NBN will be using Amazon’s satellites, and Telstra is providing Starlink services and small-cell mobile services via OneWeb. These may improve reliability, but risk widening the divide if plans aren’t affordable.
The best way to avoid this is policies that treat connectivity as an essential service and design solutions around the realities of remote First Nations households. That could include:
-
targeted subsidies or concessional plans for low-income households
-
prepaid-style broadband products
-
community-based access models, such as mesh Wi-Fi or shared infrastructure
-
ongoing digital skills support within community organisations.
The new First Nations Digital Inclusion Dashboard gives communities and policymakers a powerful tool to track progress and push for change.
Closing the Gap Target 17 aims for equal digital inclusion by 2026. Starlink and other low Earth orbit services could play a transformative role – but only if the benefits are shared equitably, not reserved for the few who can pay.