Crystal Lake, Illinois, December 1, 2025 – AptarGroup, Inc. (NYSE: ATR), a global leader in drug and consumer product dosing, dispensing and protection technologies, today announced that it has acquired Sommaplast, a specialized provider of oral dosing pharma packaging solutions, such as closures, droppers, dispensers and dosing cups, based in Brazil.
“Aptar has manufactured in Brazil for 25 years and this acquisition is expected to further reinforce our footprint in the region. It also helps position us to capitalize on Brazil’s fast-growing oral dosing, over-the-counter and nutraceutical markets. This growth is driven by an expanding population, rising middle class and aging demographic,” explained Gael Touya, President, Aptar Pharma.
Sommaplast was founded over 20 years ago and operates from a facility in Sao Paulo, Brazil with a team of over 400 employees. Today, Sommaplast is recognized for its strong team, deep customer relationships and high level of dosing know-how. With this acquisition, Aptar is building on its over 80-year history innovation and excellence. Aptar currently has manufacturing facilities in Cajamar, Jundiaí, Maringá and Camaçari, Brazil and this transaction expands the company’s presence in Latin America and brings together shared manufacturing strengths.
Further building on the acquisition rationale, Touya said, “We plan to further extend Sommaplast’s offerings in the oral dosing pharma markets through its strong commercial capabilities and expanded product offering. Together, our operational synergies and precision injection molding expertise will greatly benefit customers. We intend to maintain the DNA of Sommaplast’s family-owned company, while leveraging our global network of solutions, services and product experts.”
Read the full press release here.
About Aptar
Aptar is a global leader in drug and consumer product dosing, dispensing and protection technologies. Aptar serves a number of attractive end markets including pharmaceutical, beauty, food, beverage, personal care and home care. Using market expertise, proprietary design, engineering and science to create innovative solutions for many of the world’s leading brands, Aptar in turn makes a meaningful difference in the lives, looks, health and homes of millions of patients and consumers around the world. Aptar is headquartered in Crystal Lake, Illinois and has over 13,000 dedicated employees in 20 countries. For more information, visit www.aptar.com.
Uniform rental provider Vestis Corporation (NYSE:VSTS) announced better-than-expected revenue in Q3 CY2025, with sales up 4.1% year on year to $712 million. Its GAAP loss of $0.10 per share was significantly below analysts’ consensus estimates.
Is now the time to buy Vestis? Find out in our full research report.
Revenue: $712 million vs analyst estimates of $685.5 million (4.1% year-on-year growth, 3.9% beat)
EPS (GAAP): -$0.10 vs analyst estimates of -$0.02 (significant miss)
Adjusted EBITDA: $64.66 million vs analyst estimates of $67.4 million (9.1% margin, 4.1% miss)
Operating Margin: 2.5%, down from 4.4% in the same quarter last year
Free Cash Flow Margin: 2.2%, down from 5.8% in the same quarter last year
Market Capitalization: $854.3 million
“We ended fiscal 2025 in a good position to advance our strategic priorities as we enter fiscal 2026,” said Jim Barber, President and CEO.
Operating a network of more than 350 facilities with 3,300 delivery routes serving customers weekly, Vestis (NYSE:VSTS) provides uniform rentals, workplace supplies, and facility services to over 300,000 business locations across the United States and Canada.
A company’s long-term sales performance can indicate its overall quality. Even a bad business can shine for one or two quarters, but a top-tier one grows for years.
With $2.73 billion in revenue over the past 12 months, Vestis is a mid-sized business services company, which sometimes brings disadvantages compared to larger competitors benefiting from better economies of scale.
As you can see below, Vestis’s 2.7% annualized revenue growth over the last four years was sluggish. This shows it failed to generate demand in any major way and is a rough starting point for our analysis.
Vestis Quarterly Revenue
Long-term growth is the most important, but within business services, a stretched historical view may miss new innovations or demand cycles. Vestis’s performance shows it grew in the past but relinquished its gains over the last two years, as its revenue fell by 1.6% annually.
Vestis Year-On-Year Revenue Growth
This quarter, Vestis reported modest year-on-year revenue growth of 4.1% but beat Wall Street’s estimates by 3.9%.
Looking ahead, sell-side analysts expect revenue to decline by 1.4% over the next 12 months, similar to its two-year rate. This projection is underwhelming and implies its newer products and services will not lead to better top-line performance yet.
While Wall Street chases Nvidia at all-time highs, an under-the-radar semiconductor supplier is dominating a critical AI component these giants can’t build without. Click here to access our free report one of our favorites growth stories.
Operating margin is one of the best measures of profitability because it tells us how much money a company takes home after subtracting all core expenses, like marketing and R&D.
Vestis was profitable over the last five years but held back by its large cost base. Its average operating margin of 5.6% was weak for a business services business.
Analyzing the trend in its profitability, Vestis’s operating margin decreased by 2.6 percentage points over the last five years. This raises questions about the company’s expense base because its revenue growth should have given it leverage on its fixed costs, resulting in better economies of scale and profitability. Vestis’s performance was poor no matter how you look at it – it shows that costs were rising and it couldn’t pass them onto its customers.
Vestis Trailing 12-Month Operating Margin (GAAP)
This quarter, Vestis generated an operating margin profit margin of 2.5%, down 1.9 percentage points year on year. This reduction is quite minuscule and indicates the company’s overall cost structure has been relatively stable.
Revenue trends explain a company’s historical growth, but the change in earnings per share (EPS) points to the profitability of that growth – for example, a company could inflate its sales through excessive spending on advertising and promotions.
Vestis Trailing 12-Month EPS (GAAP)
Sadly for Vestis, its EPS declined by more than its revenue over the last two years, dropping 48%. This tells us the company struggled because its fixed cost base made it difficult to adjust to shrinking demand.
We can take a deeper look into Vestis’s earnings to better understand the drivers of its performance. Vestis’s operating margin has declined over the last two years. This was the most relevant factor (aside from the revenue impact) behind its lower earnings; interest expenses and taxes can also affect EPS but don’t tell us as much about a company’s fundamentals.
In Q3, Vestis reported EPS of negative $0.10, down from negative $0.02 in the same quarter last year. This print missed analysts’ estimates. Over the next 12 months, Wall Street is optimistic. Analysts forecast Vestis’s full-year EPS of negative $0.31 will flip to positive $0.09.
We enjoyed seeing Vestis beat analysts’ revenue expectations this quarter. On the other hand, its EPS missed. Overall, this was a softer quarter. The stock traded down 5.2% to $6.37 immediately after reporting.
Vestis’s latest earnings report disappointed. One quarter doesn’t define a company’s quality, so let’s explore whether the stock is a buy at the current price. The latest quarter does matter, but not nearly as much as longer-term fundamentals and valuation, when deciding if the stock is a buy. We cover that in our actionable full research report which you can read here, it’s free for active Edge members.
Beta Technologies Inc. signage during the company’s initial public offering on the floor at the New York Stock Exchange in New York on Nov. 4.
(Bloomberg) — Wall Street is bullish on Beta Technologies Inc. (BETA), calling the electric-powered plane maker an early leader in the regional aircraft industry.
Most Read from Bloomberg
Most of the eight analysts who have initiated coverage on the South Burlington, Vermont-based company as of Dec. 1 have a buy-equivalent rating on shares, according to data compiled by Bloomberg. The wave of approval comes a month after Beta’s public-market debut in which it raised $1.02 billion.
Beta is “akin to a young Tesla, but with a more attractive end market of aerospace, which has higher barriers to entry than autos,” said Morgan Stanley analysts in a note.
The company, which develops both electric conventional takeoff and landing (eCTOL) aircraft and electric vertical takeoff and landing (eVTOL) models, is ahead of its peers as it gains traction across cargo, medical transport, passenger mobility and defense markets, according to analysts.
Investors, however, remain skeptical. Despite having an average 12-month price target of $37.88, which implies a 43% upside from Friday’s close, shares are down 22% from their initial public offering price, data compiled by Bloomberg show.
To Jefferies’ Sheila Kahyaoglu, who has the only hold rating on Beta, the weakness in its stock price can be attributed to broader declines in small caps and aerospace shares.
“We continue to see an upside and think that Beta will be a winner in the space,” Kahyaoglu said.
Beta’s positive reception on Wall Street underscores growing investor conviction that electric aviation could be one of the most significant developments in short-haul transportation.
Needham, which estimates a $1 trillion total addressable market for electric regional mobility, argues Beta is positioned to capture early market share as the industry shifts toward low-emission short-haul aviation.
Beta’s approach to first certify an eCTOL, “and to commercialize via cargo and medical as its primary use cases (before expanding to passenger flights) provides a faster and better-defined route to” Federal Aviation Administration certification, according to Cantor Fitzgerald’s Andres Sheppard, who predicts the firm will get certification between the end of 2026 and 2027, “creating a significant first-mover advantage.”
“Furthermore, Beta is already generating revenue (unlike most peers in the space),” Sheppard wrote in a note.
Beta is streamlining its manufacturing practice by consolidating motors, batteries, software, charging hardware and high-voltage distribution into a single design process, according to Citigroup Inc. analysts led by John Godyn. While more capital-intensive in early years, Citi expects this approach to “improve Beta’s return on R&D dollars” and “reduce reliance on suppliers.”
PITTSBURGH, December 1, 2025 — Wabtec Corporation (NYSE: WAB) announced today that it has finalized the acquisition of Frauscher Sensor Technology Group GmbH (“Frauscher”), a global market leader in train detection, wayside object control solutions, and axle counting systems. The addition further strengthens Wabtec’s Digital Intelligence business by adding highly attractive and complementary railway signaling technologies, which will facilitate accelerated and profitable growth.
“This strategic acquisition is another step in executing Wabtec’s long-term growth strategy, which will provide enhanced value for our customers, shareholders, and employees,” said Wabtec President and CEO Rafael Santana. “The rare combination of our Digital Intelligence portfolio and Frauscher’s industry leading suite of products opens opportunities in a high-potential market for sustained growth, and strong and resilient profitability.”
The Austrian-based company was founded in 1987 and has grown to more than 700 employees located in 15 countries. Frauscher specializes in train detection and wayside object control solutions that provide the information rail operators need to maximize the safety, efficiency, and capacity of their networks. The company has installations in more than 100 countries under a wide range of technical, mechanical, and environmental conditions. Frauscher also has a significant presence in Europe and India, which enables Wabtec to advance its international growth strategy in these key markets.
“As the world’s rail network looks to meet the ever-growing transportation demands, the combination of our digital portfolio with Frauscher’s technology will provide operators innovative solutions to optimize their operations,” said Nalin Jain, President of Wabtec’s Digital Intelligence Group. “By combining our businesses, we will further strengthen Wabtec as an innovator in the rail industry’s digital transformation driving improved efficiency, reliability, and safety.”
This strategic acquisition strengthens Wabtec’s Digital Intelligence portfolio and further advances its penetration into the high growth railway signaling market. It also aligns with the Company’s long-term vision of driving innovation, productivity, safety and reliability for its customers, while ensuring the integrity of mission critical assets, infrastructure, and supply chains on a global scale.
TRANSACTION DETAILS
Wabtec acquired Frauscher for an enterprise value of €675 million in cash. The acquisition is anticipated to provide immediate shareholder value with an accretive growth profile, accretive Adjusted EBIT margins, slightly accretive Adjusted EPS in the first year of ownership, and accretive return on invested capital (ROIC) over time. The purchase price reflects an estimated multiple of 12.4x projected 2025 EBITDA adjusted for projected run-rate cost synergies which Wabtec expects to be realized over a three-year period. Frauscher is expected to generate approximately €145 million of revenue in 2025.
About Wabtec Wabtec Corporation is revolutionizing the way the world moves for future generations. The Company is a leading global provider of equipment, systems, digital solutions and value-added services for the freight and transit rail industries, as well as the mining, marine and industrial markets. Wabtec has been a leader in the rail industry for 155 years and has a vision to achieve a sustainable rail system in the U.S. and worldwide. Visit Wabtec’s website at www.wabteccorp.com.
About Frauscher Frauscher Sensor Technology Group offers innovative solutions for the individual requirements of customers worldwide in the field of axle counting and wheel detection. In doing so, Frauscher strives to provide the best possible support to system integrators and railway operators throughout the life cycle of products and beyond, giving them access to the information they need. With a worldwide network of locations and partners, Frauscher also guarantees a strong supply chain and optimum customer support around the globe.
Forward Looking Statement This press release contains forward-looking statements within the meaning of the U.S. securities laws, including statements regarding the expected benefits of the Frauscher Sensor Technology Group, the anticipated synergies of the transaction, the expected impact on Wabtec’s operational and financial performance (including business growth opportunities and expectations and Frauscher Sensor Technology Group’s anticipated contribution to shareholder value), and certain projected financial results of Frauscher Sensor Technology Group and their contribution to Wabtec’s anticipated performance. These statements and all statements other than historical facts constitute forward-looking statements concerning future circumstances and results and are sometimes identified by the words “anticipate,” “estimate,” “expect,” “outlook,” “position,” “project,” “recur,” “strategy,” and “will” or other similar words or expressions. Forward-looking statements are based upon current plans, assumptions, estimates and expectations and are subject to risks and uncertainties that could cause actual results to differ materially from those expressed or implied. For more information on these risks, please refer to Wabtec’s filings with the SEC. Important factors that could cause actual results to differ materially from such plans, estimates or expectations include, among others, (1) unexpected costs, charges or expenses resulting from the transaction; (2) uncertainty of the expected financial performance of Frauscher Sensor Technology Group and Wabtec following completion of the transaction; (3) risks associated with the integration of Frauscher Sensor Technology Group and the potential for failure to realize the anticipated benefits and synergies of the transaction; (4) challenges that may inhibit Wabtec’s ability following completion of the transaction to implement its business strategy and capitalize on growth opportunities; (5) inability to retain key personnel; (6) changes in general economic and/or industry specific conditions; and (7) other risk factors as detailed from time to time in Wabtec’s reports filed with the Securities and Exchange Commission. The foregoing list of important factors is not exclusive.
This press release also contains certain non-GAAP measures. Non-GAAP measures should not be considered as a substitute for items calculated in accordance with GAAP, as they are subject to inherent material limitations.
LUXEMBOURG, December 1, 2025 /PRNewswire/ — Adecoagro S.A. (NYSE: AGRO) (“Adecoagro” or the “Company”), a leading sustainable production company in South America, announced the submission of a binding offer to acquire YPF’s 50% stake in Profertil S.A., the largest producer of granular urea in South America.
This binding offer was submitted under substantially the same terms and conditions to those previously agreed between Adecoagro and Nutrien, including a purchase price of approximately US$600 million. In relation to the acquisition of Nutrien’s 50 % interest in Profertil S.A., the main precedent conditions are fulfilled.
Adecoagro’s offer acceptance by YPF is subject of approval by YPF’s Board of Directors to be held in December 2025.
Upon consummation of this acquisition Adecoagro will become the controlling shareholder of Profertil owning 90% of the total share capital. The remaining 10% will be held by Asociación de Cooperativas Argentinas.
The Company will finance the transaction through a combination of existing cash balances, a new long term credit facility which has already been committed, and proceeds from the sale of equity.
Profertil is a low-cost producer of urea and ammonia globally. With an annual capacity of approximately 1.3 million metric tons of urea and 790 thousand metric tons of ammonia, the company supplies approximately 60% of Argentina’s urea consumption. Its state-of-the-art industrial complex located in the city of Bahía Blanca—Argentina’s most important petrochemical hub—enjoys access to competitively priced natural gas and electricity. Profertil has a fully dollarized revenue business given the export nature of the product. The company generated an average annual EBITDA of approximately US$390 million over the 2020-2024 period.
Mariano Bosch, Co-Founder and Chief Executive Officer of Adecoagro, stated: “This transaction marks a significant milestone for Adecoagro, enhancing our scale, diversifying our portfolio, and strengthening the Company’s long-term performance. Supported by our principal shareholder, we are leveraging Argentina’s competitive advantages to drive sustainable growth and value creation for our stakeholders. The acquisition of Profertil positions Adecoagro as a key supplier to the regional agricultural sector, integrating a business with robust fundamentals and consistent cash generation. Profertil’s strategic location, with direct access to Argentina’s competitive natural gas resources, further reinforces our commitment to operational excellence and long-term resilience.”
Juan Sartori, Head of Special Projects of Tether and Chairman of Adecoagro’s Board of Directors, added: “As we have consistently stated, Adecoagro combines high-quality, low-cost production assets with a strong and experienced management team. This acquisition accelerates the Company’s growth trajectory and reinforces its ability to deploy capital in a disciplined and high-return manner. At Tether, we are excited to support Adecoagro in this strategy. Profertil is a best-in-class company, essential to Argentina and South America’s agricultural production chain, and we believe its integration will significantly enhance Adecoagro’s platform by increasing exposure to sustainable, real assets that create long-term value.”
The transaction is subject to customary closing conditions and is expected to be completed by December 31, 2025. Upon completion, Profertil will be fully consolidated into Adecoagro’s operations, strengthening the Company’s integrated model and enhancing its ability to secure key inputs that are essential to the region’s agricultural and food-production sectors.
This press release does not constitute an offer to sell or the solicitation of an offer to buy any securities. Any offers, solicitations of offers to buy, or any sales of securities will be made in accordance with the registration requirements of the Securities Act of 1933, as amended.
Adecoagro’s management will host a conference call on December 3, 2025 at 11am EST, to discuss the transaction.
About Profertil:
Profertil is a company devoted to the production of the fertilizers needed to optimize crop yields in a sustainable manner. Equally owned by YPF and Nutrien Ltd., Profertil has its production plant located in the port of Ingeniero White, Province of Buenos Aires. There, it produces 1,320,000 tons of granulated urea annually, the main nitrogen fertilizer for the soil in the production of different oilseeds and grains. In addition, it sells other fertilizers and prepares tailor-made mixtures to provide each territory and crop with the nutrition required. It has administrative offices in Buenos Aires and logistic terminals in Bahía Blanca, Necochea, San Nicolás (Buenos Aires) and Puerto General San Martín (Santa Fe).
About Adecoagro:
Adecoagro is a leading sustainable production company in South America. Adecoagro owns 210.4 thousand hectares of farmland and several industrial facilities spread across the most productive regions of Argentina, Brazil, and Uruguay, where it produces over 3.1 million tons of agricultural products and over 1 million MWh of renewable electricity.
Forward-Looking Statements
This press release contains forward-looking statements. Forward-looking statements can be identified by the fact that they do not relate strictly to historic or current facts and often use words such as “anticipate,” “estimate,” “expect,” “believe,” “will likely result,” “outlook,” “project” and other words and expressions of similar meaning. Investors are cautioned not to place undue reliance on forward-looking statements. Actual results may differ materially from those indicated by such forward-looking statements as a result of various important factors, including, but not limited to, those set forth in the “Risk Factors” section of the Company’s Form 20-F for the fiscal year ended December 31, 2024 and subsequent filings with the SEC. The Company may not succeed in addressing these and other risks. Consequently, all forward-looking statements in this release are qualified by the factors, risks and uncertainties contained therein. No assurance can be given that the transactions described in this press release will be consummated or as to the ultimate terms of any such transactions.
For questions, please contact:
Adecoagro Victoria Cabello – IR Officer Email: [email protected]
THE WOODLANDS, Texas, Dec. 1, 2025 /PRNewswire/ — Huntsman Corporation (NYSE: HUN) is currently experiencing an unplanned outage at its Polyurethanes facility located in Rotterdam, Netherlands which will likely have a negative impact on fourth quarter 2025 adjusted EBITDA of approximately $10 million. The larger of the two MDI lines at the facility is impacted and is expected to resume production by mid-December. As a result of the outage, Management currently expects the fourth quarter 2025 adjusted EBITDA to be at the low end of the $25 million to $50 million range communicated on November 6, 2025. Excluding the outage the quarter is trending as previously expected.
About Huntsman: Huntsman Corporation is a publicly traded global manufacturer and marketer of differentiated and specialty chemicals with 2024 revenues of approximately $6 billion. Our chemical products number in the thousands and are sold worldwide to manufacturers serving a broad and diverse range of consumer and industrial end markets. We operate more than 60 manufacturing, R&D and operations facilities in approximately 25 countries and employ approximately 6,300 associates within our continuing operations. For more information about Huntsman, please visit the company’s website at www.huntsman.com.
Social Media: X: www.x.com/Huntsman_Corp Facebook: www.facebook.com/huntsmancorp LinkedIn: www.linkedin.com/company/huntsman
Forward-Looking Statements: Certain information in this release constitutes forward-looking statements within the meaning of Section 27A of the Securities Act of 1933 and Section 21E of the Securities Exchange Act of 1934. These statements are based on management’s current beliefs and expectations. The forward-looking statements in this release are subject to uncertainty and changes in circumstances and involve risks and uncertainties that may affect the company’s operations, markets, products, services, prices and other factors as discussed under the caption “Risk Factors” in the Huntsman companies’ filings with the U.S. Securities and Exchange Commission. Significant risks and uncertainties may relate to, but are not limited to, volatile global economic conditions, cyclical and volatile product markets, disruptions in production at manufacturing facilities, reorganization or restructuring of Huntsman’s operations, including any delay of, or other negative developments affecting the ability to implement cost reductions, timing of proposed transactions, and manufacturing optimization improvements in Huntsman businesses and realize anticipated cost savings, and other financial, economic, competitive, environmental, political, legal, regulatory and technological factors. The company assumes no obligation to provide revisions to any forward-looking statements should circumstances change, except as otherwise required by applicable laws.
View original content to download multimedia:https://www.prnewswire.com/news-releases/huntsman-updates-fourth-quarter-2025-outlook-302629501.html
Atlas Revenue up 30% year-over-year; 75% of Total Q3 Revenue
Third Quarter Fiscal 2026 Total Revenue of $628.3 million, up 19% year-over-year
Added 2,600 Customers, with Over 62,500 Total Customers as of October 31, 2025
NEW YORK, Dec. 1, 2025 /PRNewswire/ — MongoDB, Inc. (NASDAQ: MDB) today announced its financial results for the third quarter ended October 31, 2025.
“MongoDB delivered strong third quarter results that exceeded the high-end of our guidance driven by continued strength in Atlas, which saw growth accelerate to 30% year-over-year. We also delivered meaningful margin outperformance as we executed on our plan to drive profitable growth. Reflecting this strength, we are raising our guidance on the top and bottom line for the rest of the year,” said CJ Desai, President and Chief Executive Officer of MongoDB.
“Q3 was an exceptional quarter. Existing customers are expanding with us and net-new customer additions continue to show strength. Companies across industries and geographies are choosing MongoDB because we provide a unified data platform that powers mission-critical workloads today and also positions them to capitalize on the emerging AI platform shift.”
Third Quarter Fiscal 2026 Financial Highlights
Revenue: Total revenue was $628.3 million for the third quarter of fiscal 2026, an increase of 19% year-over-year. Subscription revenue was $609.1 million, an increase of 19% year-over-year, and services revenue was $19.2 million, an increase of 12% year-over-year.
Gross Profit: Gross profit was $449.1 million for the third quarter of fiscal 2026, representing a 71% gross margin compared to 74% in the year-ago period. Non-GAAP gross profit was $466.2 million, representing a 74% non-GAAP gross margin, compared to a non-GAAP gross margin of 77% in the year-ago period.
Loss from Operations: Loss from operations was $18.4 million for the third quarter of fiscal 2026, compared to a loss from operations of $27.9 million in the year-ago period. Non-GAAP income from operations was $123.1 million, compared to non-GAAP income from operations of $101.5 million in the year-ago period.
Net Loss: Net loss was $2.0 million, or $0.02 per share, based on 81.4 million weighted-average shares outstanding, for the third quarter of fiscal 2026. This compares to a net loss of $9.8 million, or $0.13 per share, in the year-ago period. Non-GAAP net income was $114.5 million, or $1.32 per share, based on 86.9 million fully diluted weighted-average shares outstanding. This compares to a non-GAAP net loss of $98.1 million, or $1.16, per share in the year-ago period.
Cash Flow: As of October 31, 2025, MongoDB had $2.3 billion in cash, cash equivalents, short-term investments and restricted cash. During the three months ended October 31, 2025, MongoDB generated $143.5 million of cash from operations, compared to $37.4 million of cash from operations in the year-ago period. MongoDB used $1.7 million of cash in capital expenditures and used $1.7 million of cash in principal payments of finance leases, leading to free cash flow of $140.1 million, compared to free cash flow of $34.6 million in the year-ago period.
A reconciliation of each non-GAAP measure to the most directly comparable GAAP measure has been provided in the financial statement tables included at the end of this press release. An explanation of these measures is also included below under the heading “Non-GAAP Financial Measures.”
Third Quarter Fiscal 2026 and Recent Business Highlights
MongoDB appointed Chirantan “CJ” Desai as President and Chief Executive Officer, succeeding Dev Ittycheria, who held the role for 11 years. CJ comes to MongoDB with an exceptional blend of product and engineering leadership, strong go-to-market execution, and firsthand experience scaling some of the world’s most transformative software companies.
MongoDB has been recognized as a Leader for the fourth consecutive year in the 2025 Gartner® Magic Quadrant™ for Cloud Database Management Systems (CDBMS). This recognition reflects the company’s execution strength, innovation velocity, and continued leadership in redefining what a modern database platform can do in the era of AI. Our placement underscores MongoDB’s position as the trusted foundation for enterprises seeking agility, scalability, and AI readiness across every application.
MongoDB announced the availability of its search and vector search capabilities within MongoDB Community Edition and MongoDB Enterprise Server. Previously exclusive to the fully managed MongoDB Atlas cloud platform, developers and organizations of all sizes can now access the preview of robust full-text search and vector search capabilities on MongoDB’s local, on-premises, and self-managed offerings—all with the world’s most popular modern database.
MongoDB was named the 2025 Microsoft United States Partner of the Year at the Microsoft Ignite conference in San Francisco. MongoDB also launched a number of AI development, security, and governance technology integrations with Microsoft that solidify MongoDB’s position as the best data foundation for AI on Microsoft Azure.
Fourth Quarter and Full Year Fiscal 2026 Guidance
Based on information available to management as of today, December 1, 2025, MongoDB is issuing the following financial guidance for the fourth quarter and full year fiscal 2026.
Fourth Quarter Fiscal 2026
Full Year Fiscal 2026
Revenue
$665.0 million to $670.0
million
$2.434 billion to $2.439 billion
Non-GAAP Income from Operations
$139.0 million to $143.0 million
$436.4 million to $440.4 million
Non-GAAP Net Income per Share
$1.44 to $1.48
$4.76 to $4.80
Reconciliations of non-GAAP income from operations and non-GAAP net income per share guidance to the most directly comparable GAAP measures are not available without unreasonable efforts on a forward-looking basis due to the high variability, complexity and low visibility with respect to the charges excluded from these non-GAAP measures; in particular, the measures and effects of stock-based compensation expense specific to equity compensation awards that are directly impacted by unpredictable fluctuations in MongoDB’s stock price. MongoDB expects the variability of the above charges to have a significant, and potentially unpredictable, impact on its future GAAP financial results.
Conference Call Information
MongoDB will host a conference call today, December 1, 2025, at 5:00 p.m. (Eastern Time) to discuss its financial results and business outlook. A live webcast of the call will be available on the “Investor Relations” page of MongoDB’s website at https://investors.mongodb.com. To access the call by phone, please go to this link (registration link), and you will be provided with dial in details. To avoid delays, we encourage participants to dial into the conference call fifteen minutes ahead of the scheduled start time. A replay of the webcast will also be available for a limited time at http://investors.mongodb.com.
Forward-Looking Statements
This press release includes certain “forward-looking statements” within the meaning of Section 27A of the Securities Act of 1933, as amended, or the Securities Act, and Section 21E of the Securities Exchange Act of 1934, as amended, including statements concerning MongoDB’s financial guidance for the fourth fiscal quarter and full year fiscal 2026. These forward-looking statements include, but are not limited to, plans, objectives, expectations and intentions and other statements contained in this press release that are not historical facts and statements identified by words such as “anticipate,” “believe,” “continue,” “could,” “estimate,” “expect,” “intend,” “may,” “plan,” “project,” “will,” “would” or the negative or plural of these words or similar expressions or variations. These forward-looking statements reflect our current views about our plans, intentions, expectations, strategies and prospects, which are based on the information currently available to us and on assumptions we have made. Although we believe that our plans, intentions, expectations, strategies and prospects as reflected in or suggested by those forward-looking statements are reasonable, we can give no assurance that the plans, intentions, expectations or strategies will be attained or achieved. Furthermore, actual results may differ materially from those described in the forward-looking statements and are subject to a variety of assumptions, uncertainties, risks and factors that are beyond our control including, without limitation: our customers renewing their subscriptions with us and expanding their usage of software and related services; global political changes; the effects of the ongoing military conflicts between Russia and Ukraine and Israel and Hamas on our business and future operating results; economic downturns and/or the effects of rising interest rates, inflation and volatility in the global economy and financial markets on our business and future operating results; our potential failure to meet publicly announced guidance or other expectations about our business and future operating results; reputational harm or other adverse consequences resulting from use of AI and ML in our product offerings and internal operations if they don’t produce the desired benefits; our limited operating history; our history of losses; our potential failure to repurchase shares of our common stock at favorable prices, if at all; failure of our platform to satisfy customer demands; the effects of increased competition; our investments in new products and our ability to introduce new features, services or enhancements; social, ethical and security issues relating to the use of new and evolving technologies, such as artificial intelligence, in our offerings or partnerships; our ability to effectively expand our sales and marketing organization; our ability to continue to build and maintain credibility with the developer community; our ability to add new customers or increase sales to our existing customers; our ability to maintain, protect, enforce and enhance our intellectual property; the effects of social, ethical and regulatory issues relating to the use of new and evolving technologies, such as AI and ML, in our offerings or partnerships; the growth and expansion of the market for database products and our ability to penetrate that market; our ability to maintain the security of our software and adequately address privacy concerns; our ability to manage our growth effectively and successfully recruit and retain additional highly-qualified personnel; and the price volatility of our common stock. These and other risks and uncertainties are more fully described in our filings with the Securities and Exchange Commission (“SEC”), including under the caption “Risk Factors” in our Quarterly Report on Form 10-Q for the quarter ended July 31, 2025, filed with the SEC on August 27, 2025. Additional information will be made available in our Quarterly Report on Form 10-Q for the quarter ended October 31, 2025, and other filings and reports that we may file from time to time with the SEC. Except as required by law, we undertake no duty or obligation to update any forward-looking statements contained in this release as a result of new information, future events, changes in expectations or otherwise.
Non-GAAP Financial Measures
This press release includes the following financial measures defined as non-GAAP financial measures by the SEC: non-GAAP gross profit, non-GAAP gross margin, non-GAAP operating expenses, non-GAAP income from operations, non-GAAP operating margin, non-GAAP net income, non-GAAP net income per share and free cash flow. Non-GAAP gross profit and non-GAAP gross margin exclude expenses associated with stock-based compensation. Non-GAAP operating expenses, non-GAAP income from operations, non-GAAP operating margin, non-GAAP net income and non-GAAP net income per share exclude:
expenses associated with stock-based compensation including employer payroll taxes upon the vesting and exercising of stock-based awards and expenses related to stock appreciation rights previously issued to our employees in China;
amortization of intangible assets for the acquired technology and acquired customer relationships associated with prior acquisitions;
certain acquisition-related costs and other, including due diligence costs, professional fees in connection with an acquisition and certain integration-related expenses. These expenses are unpredictable, and dependent on factors that may be outside of our control and unrelated to the continuing operations of the acquired business or our Company. In addition, the size and complexity of an acquisition, which often drives the magnitude of acquisition-related costs, may not be indicative of such future costs;
restructuring costs associated with a formal restructuring plan that are primarily related to workforce reductions. The Company excludes these expenses because they are not reflective of ordinary course ongoing business and operating results; and
in the case of non-GAAP net income and non-GAAP net income per share, amortization of the debt issuance costs associated with our convertible senior notes and gains or losses on our financial instruments;
additionally, non-GAAP net income and non-GAAP net income per share are adjusted for an assumed provision for income taxes based on an estimated long-term non-GAAP tax rate. The non-GAAP tax rate was calculated utilizing a three-year financial projection that excludes the direct impact of the GAAP to non-GAAP adjustments and considers other factors such as operating structure and existing tax positions in various jurisdictions. We intend to periodically reevaluate the projected long-term tax rate, as necessary, for significant events and our ongoing analysis of relevant tax law changes.
MongoDB uses these non-GAAP financial measures internally in analyzing its financial results and believes they are useful to investors, as a supplement to GAAP measures, in evaluating MongoDB’s ongoing operational performance. MongoDB believes that the use of these non-GAAP financial measures provides an additional tool for investors to use in evaluating ongoing operating results and trends and in comparing its financial results with other companies in MongoDB’s industry, many of which may present similar non-GAAP financial measures to investors.
Free cash flow represents net cash from/used in operating activities, less capital expenditures, principal payments of finance lease liabilities and capitalized software development costs, if any. MongoDB uses free cash flow to understand and evaluate its liquidity and to generate future operating plans. The exclusion of capital expenditures, principal payments of finance lease liabilities and amounts capitalized for software development facilitates comparisons of MongoDB’s liquidity on a period-to-period basis and excludes items that it does not consider to be indicative of its liquidity. MongoDB believes that free cash flow is a measure of liquidity that provides useful information to investors in understanding and evaluating the strength of its liquidity and future ability to generate cash that can be used for strategic opportunities or investing in its business in the same manner as MongoDB’s management and board of directors.
Non-GAAP financial measures have limitations as an analytical tool and should not be considered in isolation from, or as a substitute for, financial information prepared in accordance with GAAP. In particular, other companies may report non-GAAP gross profit, non-GAAP gross margin, non-GAAP operating expenses, non-GAAP income from operations, non-GAAP net income, non-GAAP net income per share, free cash flow or similarly titled measures but calculate them differently, which reduces their usefulness as comparative measures. Investors are encouraged to review the reconciliation of these non-GAAP financial measures to their most directly comparable GAAP financial measures, as presented below. This earnings press release and any future releases containing such non-GAAP reconciliations can also be found on the Investor Relations page of MongoDB’s website at https://investors.mongodb.com.
About MongoDB
Headquartered in New York, MongoDB’s mission is to empower innovators to create, transform, and disrupt industries with software and data. MongoDB’s unified, intelligent data platform was built to power the next generation of applications, and MongoDB is the most widely available, globally distributed database on the market. With integrated capabilities for operational data, search, real-time analytics, and AI-powered retrieval, MongoDB helps organizations everywhere move faster, innovate more efficiently, and simplify complex architectures. Millions of developers and more than 60,000 customers across almost every industry—including 70% of the Fortune 100—rely on MongoDB for their most important applications. To learn more, visit mongodb.com.
Investor Relations
Jess Lubert
[email protected]
Media Relations
MongoDB
[email protected]
MONGODB, INC.
CONDENSED CONSOLIDATED BALANCE SHEETS
(in thousands of U.S. dollars, except share and per share data)
(unaudited)
October 31, 2025
January 31, 2025
Assets
Current assets:
Cash and cash equivalents
$ 834,092
$ 490,133
Short-term investments
1,471,669
1,846,444
Accounts receivable, net of allowance for doubtful accounts of $12,305 and $8,888 as of October 31, 2025 and January 31, 2025, respectively
416,494
393,099
Deferred commissions
122,882
112,632
Prepaid expenses and other current assets
87,177
81,214
Total current assets
2,932,314
2,923,522
Property and equipment, net
40,704
46,377
Operating lease right-of-use assets
30,914
34,607
Goodwill
189,641
69,679
Intangible assets, net
38,308
24,597
Deferred tax assets
23,012
20,810
Other assets
311,756
310,701
Total assets
$ 3,566,649
$ 3,430,293
Liabilities and Stockholders’ Equity
Current liabilities:
Accounts payable
$ 14,811
$ 10,467
Accrued compensation and benefits
131,760
120,354
Operating lease liabilities
9,145
9,126
Other accrued liabilities
101,444
87,659
Deferred revenue
300,873
334,381
Total current liabilities
558,033
561,987
Deferred tax liability
560
262
Operating lease liabilities
25,480
27,374
Deferred revenue
66,173
25,404
Other liabilities
27,964
33,042
Total liabilities
678,210
648,069
Stockholders’ equity:
Common stock, par value of $0.001 per share; 1,000,000,000 shares authorized as of October 31, 2025 and January 31, 2025; 82,919,928 shares issued and 81,357,418 shares outstanding as of October 31, 2025; 80,558,847 shares issued and 80,467,811 shares outstanding as of January 31, 2025
81
78
Additional paid-in capital
5,152,122
4,625,093
Treasury stock, 1,562,510 shares (repurchased at an average of $221.86 per share) as of October 31, 2025 and 99,371 shares (repurchased at an average of $13.27 per share) as of January 31, 2025
(346,654)
(1,319)
Accumulated other comprehensive income (loss)
10,275
(924)
Accumulated deficit
(1,927,385)
(1,840,704)
Total stockholders’ equity
2,888,439
2,782,224
Total liabilities and stockholders’ equity
$ 3,566,649
$ 3,430,293
MONGODB, INC.
CONDENSED CONSOLIDATED STATEMENTS OF OPERATIONS
(in thousands of U.S. dollars, except share and per share data)
(unaudited)
Three Months Ended October 31,
Nine Months Ended October 31,
2025
2024
2025
2024
Revenue:
Subscription
$ 609,067
$ 512,205
$ 1,712,877
$ 1,412,906
Services
19,242
17,170
55,848
45,139
Total revenue
628,309
529,375
1,768,725
1,458,045
Cost of revenue:
Subscription(1)
146,921
111,150
416,455
318,728
Services(1)
32,256
24,181
92,191
67,553
Total cost of revenue
179,177
135,331
508,646
386,281
Gross profit
449,132
394,044
1,260,079
1,071,764
Operating expenses:
Sales and marketing(1)
230,864
217,954
695,852
658,937
Research and development(1)
176,610
151,410
527,178
446,437
General and administrative(1)
60,082
52,556
174,321
163,892
Total operating expenses
467,556
421,920
1,397,351
1,269,266
Loss from operations
(18,424)
(27,876)
(137,272)
(197,502)
Other income, net
19,774
20,767
62,178
61,749
Income (loss) before provision for income taxes
1,350
(7,109)
(75,094)
(135,753)
Provision for income taxes
3,357
2,667
11,587
9,145
Net loss
$ (2,007)
$ (9,776)
$ (86,681)
$ (144,898)
Net loss per share, basic and diluted
$ (0.02)
$ (0.13)
$ (1.07)
$ (1.97)
Weighted-average shares used to compute net loss per share, basic and diluted
81,401,853
74,020,593
81,245,331
73,472,900
(1) Includes stock‑based compensation expense as follows:
Three Months Ended October 31,
Nine Months Ended October 31,
2025
2024
2025
2024
Cost of revenue—subscription
$ 8,990
$ 7,884
$ 26,216
$ 21,566
Cost of revenue—services
4,572
3,495
12,739
10,151
Sales and marketing
36,965
40,540
112,332
121,193
Research and development
67,255
57,850
208,773
168,211
General and administrative
15,848
15,943
46,401
47,777
Total stock‑based compensation expense
$ 133,630
$ 125,712
$ 406,461
$ 368,898
MONGODB, INC.
CONDENSED CONSOLIDATED STATEMENTS OF CASH FLOWS
(in thousands of U.S. dollars)
(unaudited)
Three Months Ended October 31,
Nine Months Ended October 31,
2025
2024
2025
2024
Cash flows from operating activities
Net loss
$ (2,007)
$ (9,776)
$ (86,681)
$ (144,898)
Adjustments to reconcile net loss to net cash provided by operating activities:
Depreciation and amortization
5,668
2,405
16,654
9,580
Stock-based compensation
133,630
125,712
406,461
368,898
Amortization of debt discount and issuance costs
—
715
—
2,419
Amortization of finance right-of-use assets
995
994
2,981
2,981
Amortization of operating right-of-use assets
2,899
3,229
8,498
8,300
Deferred income taxes
447
(825)
(687)
(799)
Amortization of premium and accretion of discount on short-term investments, net
(2,210)
(5,656)
(8,749)
(19,117)
Realized and unrealized loss (gain) on financial instruments, net
291
(338)
563
(1,190)
Unrealized foreign exchange loss (gain)
(171)
788
1,040
1,992
Change in operating assets and liabilities:
Accounts receivable, net
(66,993)
(24,557)
(25,188)
(11,258)
Prepaid expenses and other current assets
2,773
(1,964)
(1,883)
(582)
Deferred commissions
(3,548)
(18,821)
10,952
(38,794)
Other long-term assets
(2,931)
(8,395)
(13,999)
(17,704)
Accounts payable
4,993
1,370
3,555
1,569
Accrued liabilities
13,525
(6,719)
10,923
22,494
Operating lease liabilities
(3,570)
(3,777)
(8,321)
(9,145)
Deferred revenue
58,989
(17,039)
9,459
(71,352)
Other liabilities, non-current
730
92
(34)
(3,741)
Net cash provided by operating activities
143,510
37,438
325,544
99,653
Cash flows from investing activities
Purchases of property, equipment and other assets
(1,678)
(1,981)
(3,826)
(3,571)
Business combination, net of cash acquired
—
—
(2,032)
—
Investments in non-marketable securities
—
(250)
(8,322)
(5,750)
Proceeds from the sales of marketable securities
127,660
—
127,660
—
Proceeds from maturities of marketable securities
105,000
135,000
595,970
570,000
Purchases of marketable securities
—
(786,170)
(337,292)
(971,803)
Net cash provided by (used in) investing activities
230,982
(653,401)
372,158
(411,124)
Cash flows from financing activities
Repurchases of common stock
(148,633)
—
(343,079)
—
Proceeds from settlement of capped calls
—
—
—
170,589
Proceeds from the issuance of common stock under the Employee Stock Purchase Plan
—
—
22,917
18,640
Proceeds from exercise of stock options
533
315
2,322
1,621
Taxes paid related to net share settlement of equity awards
(38,496)
—
(38,496)
—
Principal payments of finance leases
(1,715)
(895)
(5,800)
(4,534)
Net cash (used in) provided by financing activities
(188,311)
(580)
(362,136)
186,316
Effect of exchange rate changes on cash, cash equivalents and restricted cash
783
(274)
8,851
(2,825)
Net increase in cash, cash equivalents and restricted cash
186,964
(616,817)
344,417
(127,980)
Cash, cash equivalents and restricted cash, beginning of period
650,206
1,292,480
492,753
803,643
Cash, cash equivalents and restricted cash, end of period
$ 837,170
$ 675,663
$ 837,170
$ 675,663
MONGODB, INC.
RECONCILIATION OF GAAP MEASURES TO NON-GAAP MEASURES
(in thousands of U.S. dollars, except share and per share data)
(unaudited)
Three Months Ended October 31,
Nine Months Ended October 31,
2025
2024
2025
2024
Reconciliation of GAAP gross profit to non-GAAP gross profit:
Gross profit on a GAAP basis
$ 449,132
$ 394,044
$ 1,260,079
$ 1,071,764
Gross margin (Gross profit/Total revenue) on a GAAP basis
71 %
74 %
71 %
74 %
Add back:
Expenses associated with stock-based compensation: Cost of Revenue—Subscription
9,230
7,999
26,752
22,145
Expenses associated with stock-based compensation: Cost of Revenue—Services
Reconciliation of GAAP operating expenses to non-GAAP operating expenses:
Sales and marketing operating expense on a GAAP basis
$ 230,864
$ 217,954
$ 695,852
$ 658,937
Less:
Expenses associated with stock-based compensation
38,579
42,155
116,172
125,129
Restructuring
251
—
4,775
—
Amortization of intangible assets
—
—
—
85
Non-GAAP sales and marketing operating expense
$ 192,034
$ 175,799
$ 574,905
$ 533,723
Research and development operating expense on a GAAP basis
$ 176,610
$ 151,410
$ 527,178
$ 446,437
Less:
Expenses associated with stock-based compensation
69,100
59,017
213,567
173,166
Restructuring
—
—
159
—
Amortization of intangible assets
170
170
510
2,908
Certain acquisition-related costs and other
—
—
40
—
Non-GAAP research and development operating expense
$ 107,340
$ 92,223
$ 312,902
$ 270,363
General and administrative operating expense on a GAAP basis
$ 60,082
$ 52,556
$ 174,321
$ 163,892
Less:
Expenses associated with stock-based compensation
16,396
16,377
48,452
50,469
Certain acquisition-related costs and other
4
—
1,894
—
Non-GAAP general and administrative operating expense
$ 43,682
$ 36,179
$ 123,975
$ 113,423
Reconciliation of GAAP loss from operations to non-GAAP income from operations:
Loss from operations on a GAAP basis
$ (18,424)
$ (27,876)
$ (137,272)
$ (197,502)
GAAP operating margin (Loss from operations/Total revenue)
(3) %
(5) %
(8) %
(14) %
Add back:
Expenses associated with stock-based compensation
138,090
129,186
418,752
381,303
Restructuring
250
—
5,022
—
Amortization of intangible assets
3,195
170
8,927
2,993
Certain acquisition-related costs and other
4
—
1,934
—
Non-GAAP income from operations
$ 123,115
$ 101,480
$ 297,363
$ 186,794
Non-GAAP operating margin (Non-GAAP income from operations/Total revenue)
20 %
19 %
17 %
13 %
Reconciliation of GAAP net loss to non-GAAP net income:
Net loss on a GAAP basis
$ (2,007)
$ (9,776)
$ (86,681)
$ (144,898)
Add back:
Expenses associated with stock-based compensation
138,090
129,186
418,752
381,303
Restructuring
250
—
5,022
—
Amortization of intangible assets
3,195
170
8,927
2,993
Certain acquisition-related costs and other
4
—
1,934
—
Amortization of debt issuance costs related to convertible senior notes
—
716
—
2,419
Less:
Gains (loss) on financial instruments, net
(291)
338
(563)
1,190
Income tax effects and adjustments *
25,279
21,858
60,434
40,809
Non-GAAP net income
$ 114,544
$ 98,100
$ 288,083
$ 199,818
Reconciliation of GAAP net loss per share, diluted, to non-GAAP net income per share, fully diluted:
Net loss per share, diluted, on a GAAP basis
$ (0.02)
$ (0.13)
$ (1.07)
$ (1.97)
Add back:
Expenses associated with stock-based compensation
1.70
1.75
5.15
5.19
Restructuring
—
—
0.06
—
Amortization of intangible assets
0.04
—
0.11
0.04
Certain acquisition-related costs and other
—
—
0.02
—
Amortization of debt issuance costs related to convertible senior notes
—
0.01
—
0.03
Less:
Gains (loss) on financial instruments, net
—
—
(0.01)
0.02
Income tax effects and adjustments *
0.31
0.30
0.74
0.56
Non-GAAP net income per share, diluted
$ 1.41
$ 1.33
$ 3.54
$ 2.71
Adjustment for fully diluted earnings per share
(0.09)
(0.17)
(0.22)
(0.32)
Non-GAAP net income per share, fully diluted **
$ 1.32
$ 1.16
$ 3.32
$ 2.39
* Non-GAAP financial information is adjusted for an assumed provision for income taxes based on our long-term projected tax rate of 20%. Due to the differences in the tax treatment of items excluded from non-GAAP earnings, our estimated tax rate on non-GAAP income may differ from our GAAP tax rate and from our actual tax liabilities.
** Fully diluted non-GAAP net income per share is calculated based upon 86.9 million and 86.8 million of fully diluted weighted- average shares of outstanding common stock for the three and nine months ended October 31, 2025, respectively, and 84.2 million and 83.7 million of fully diluted weighted-average shares of outstanding common stock for the three and nine months ended October 31, 2024, respectively.
The following table presents a reconciliation of free cash flow to net cash provided by operating activities, the most directly comparable GAAP measure, for each of the periods indicated (unaudited, in thousands):
Three Months Ended October 31,
Nine Months Ended October 31,
2025
2024
2025
2024
Net cash provided by operating activities
$ 143,510
$ 37,438
$ 325,544
$ 99,653
Capital expenditures
(1,678)
(1,981)
(3,826)
(3,571)
Principal payments of finance leases
(1,715)
(895)
(5,800)
(4,534)
Free cash flow
$ 140,117
$ 34,562
$ 315,918
$ 91,548
MONGODB, INC.
CUSTOMER COUNT METRICS
The following table presents certain customer count information as of the periods indicated:
10/31/2023
1/31/2024
4/30/2024
7/31/2024
10/31/2024
1/31/2025
4/30/2025
7/31/2025
10/31/2025
Total Customers(a)
46,400+
47,800+
49,200+
50,700+
52,600+
54,500+
57,100+
59,900+
62,500+
Direct Sales Customers(b)
6,900+
7,000+
7,100+
7,300+
7,400+
7,500+
7,500+
7,300+
7,000+
MongoDB Atlas Customers
44,900+
46,300+
47,700+
49,200+
51,100+
53,100+
55,800+
58,300+
60,800+
Customers over $100K(c)
1,972
2,052
2,137
2,189
2,314
2,396
2,506
5,564
2,694
(a) Our definition of “customer” excludes users of our free offerings and all affiliated entities are counted as a single customer.
(b) Direct Sales Customers are customers that were sold through our direct sales force and channel partners.
(c) Represents the number of customers with $100,000 or greater in annualized recurring revenue (“ARR”) and annualized monthly recurring revenue (“MRR”). ARR includes the revenue we expect to receive from our customers over the following 12 months based on contractual commitments and, in the case of Direct Sales Customers of MongoDB Atlas, by annualizing the prior 90 days of their actual consumption of MongoDB Atlas, assuming no increases or reductions in their subscriptions or usage. For all other customers of our self- serve products, we calculate annualized MRR by annualizing the prior 30 days of their actual consumption of such products, assuming no increases or reductions in usage. ARR and annualized MRR exclude professional services.
MONGODB, INC.
SUPPLEMENTAL REVENUE INFORMATION
The following table presents certain supplemental revenue information as of the periods indicated:
10/31/2023
1/31/2024
4/30/2024
7/31/2024
10/31/2024
1/31/2025
4/30/2025
7/31/2025
10/31/2025
MongoDB Enterprise Advanced: % of Subscription Revenue
27 %
26 %
25 %
24 %
25 %
23 %
22 %
21 %
20 %
Direct Sales Customers(a)
Revenue: % of Subscription Revenue
88 %
88 %
87 %
87 %
88 %
88 %
87 %
87 %
87 %
(a) Direct Sales Customers are customers that were sold through our direct sales force and channel partners.
Shares of Nvidia (NASDAQ:NVDA) edged about 1.5% higher on Monday morning after the company announced an expansion of their AI partnership.
The two firms will open an AI factory lab in Grenoble, France, designed to let customers test and refine AI workloads using HPE servers, networking, and Nvidia accelerated computing in a controlled, sovereign environment.
HPE also plans a Private AI Lab in London with Carbon3.ai and is expanding its HPE Unleash AI partner program, which now includes CrowdStrike (CRWD), to accelerate enterprise AI adoption in the U.K.
Executives said the labs will allow clients to validate performance, compliance, and data sovereignty before full-scale deployments, helping companies navigate regulatory hurdles and speed AI implementation.
The labs are part of HPE’s broader effort to provide turnkey AI factory stacks that simplify deployment across hybrid cloud and on-premises environments.
Analysts say the move could give enterprises a faster, safer path to scale AI operations globally while showcasing HPE and Nvidia’s combined infrastructure capabilities.
If you’re confused about the economy right now, you’re in good company. Experts are also grappling with conflicting indicators, imperfect data and flashing caution signs.
By some indicators, things seem to be going well. The stock market is up and rising. Unemployment – though ticking up – remains very low.
Yet by others, it could look like we’re heading for a downturn. Consumer sentiment is relatively low, consumer debt is high and stubborn inflation hasn’t budged much.
The state of the economy right now is “highly uncertain,” said Mark Gertler, economics professor at New York University. “It’s growing at a kind of modest growth rate, but there’s lots of uncertainty to play out.”
Put another way, nearly every metric economists use to determine the strength of the economy “is somewhere between moderately concerning” and “virtually stagnant,” added Ben Harris, vice president and director of Economic Studies at the Brookings Institution.
Add to that uncertainty the fact that key economic reports have been delayed or skipped over due to the record-breaking government shutdown, which ended last month.
Why does it matter that the overall picture is hazy? Complex data points make it tough for policy-makers to know the best course of action to help boost the economy, Gertler said. This is an especially complicated time for President Donald Trump’s administration, which is becoming the face of a worsening economy to many Americans. Affordability was a top issue for voters who overwhelmingly sent Democrats to power in the off-year elections in November.
Here are four important economic indicators, and what experts say they suggest about this moment.
1. The ‘no hiring, no firing’ labor landscape
The unemployment rate is still low, at around 4.4%, but has been steadily ticking up. Historically, employers need to add between 120,000 and 150,000 jobs per month to maintain a steady unemployment rate, Gertler said.
On Nov. 20, the Bureau of Labor Statistics released hiring numbers for September, delayed seven weeks due to the government shutdown. Though hiring had been weak since May, employers did pick up the pace in September, adding about 119,000 jobs.
One month doesn’t form a trend, Gertler said. A good jobs report helps make up some ground for four months of very low hiring, but overall the report was “neutral,” he said.
Right now, the labor market is in a “no hiring, no firing” position, Harris said. It’s tough to find a job if you don’t have one, but if you’re employed, you’re likely to keep that job. While that sounds stable, it’s actually a very precarious situation, he added.
“If employers start laying off workers, then you’re going to expand the supply of workers who could plausibly be hired. Then employers will feel more comfortable laying off workers because they know they can hire them if they need to,” he said.
Though different economists might have varying views on whether the market will steady or deteriorate, Harris said he doesn’t know of “any labor market optimists right now.”
“Once the layoffs start,” he added, “they could come fast and furious.”
When it comes to interpreting the numbers, Trump’s immigration policy is a key variable. The unemployment rate is the number of people who are unemployed divided by the number of people in the labor force. But that denominator is shrinking with the Trump’s administration’s aggressive deportation policy, said Joanne Hsu, director of the Surveys of Consumers at the University of Michigan. And a smaller supply of workers could lead employers to hire less, Gertler said.
Other factors that could be affecting hiring include the rise of artificial intelligence, which could be displacing human jobs, or just a generally weak economy.
WATCH: 3 things to know about AI and mass corporate layoffs
It’s unclear if the weak job market is caused by low labor supply or low hiring demand, Gertler said.
“It’s not as dire a situation as during the great financial crisis [of 2008], but in some ways it’s more complex because it’s hard to know which direction to go,” Gertler said. “During the great financial crisis, you knew the policy should be: you have expansionary monetary policy and fiscal policy. Here, it’s really tough to say.”
2. The lower inflation trade-off
One metric that’s dominated headlines since 2021 is the consumer price index, which measures change in prices over time, also known as inflation.
Between Sept. 2024 and Sept. 2025, the core CPI, which tracks all consumer prices excluding food and energy, increased 3%. That’s down from a high of 6.6% in Sept. 2022, but still above the government’s target rate of around 2% – a number not seen since early 2021.
Any movement toward that 2% goal would be a sign in the right direction, Gertler said. But inflation below that could also indicate a weakening economy.
For almost five years now, the Federal Reserve has been trying to tame inflation, and has only just begun lowering interest rates. A weak economy will see softening inflation, which could also reflect a slowing job market, as we’ve been experiencing.
READ MORE: The Federal Reserve wrestles with how many interest rate cuts to make and how fast
That’s the kind of trade-off the Federal Reserve might have to make, Gertler said.
“It may be some slowing of the economy is required to get the inflation rate down, but this is why the Fed is going gradually, so that it won’t have to be too disruptive to the labor market,” he said.
Harris also said that massive shortages in the housing market have been a major contributor to inflation since 2023. Housing alone takes up about a third of the CPI, according to Brookings.
“If housing inflation is 5 or 6%, it’s really, really hard to get down to 2% inflation,” Harris said.
In that case, the Fed raising interest rates – their typical response to rising inflation – won’t really help, he said. It might discourage more people from taking out loans to buy housing, but it also means more people won’t be selling, which reduces supply, he said.
3. A ‘flashing yellow light’ of consumer debt
Consumer debt in the U.S. is at an all-time high, with Americans owing $18.59 trillion, according to the Federal Reserve Bank of New York’s latest report. That debt includes student loans, auto loans, mortgages, home equity lines of credit, credit card debt and other loans.
When considering consumer debt, it’s important to break down macro and micro interpretations, Harris said.
On the whole, “consumption is really strong in the United States, and has always driven our economy – and it’s no different today,” Harris said.
READ MORE: Despite economic uncertainty, Cyber Monday could break spending records
Current debt payments as a percentage of personal income are relatively low, historically speaking. Debt payments comprise about 11% of personal income across all U.S. households, far lower than the almost 16% high it hit during the Great Recession and slightly lower than before the pandemic.
It’s one example of an economic indicator that may look unconcerning on the surface. However, Hsu said, looking at aggregate data alone may obscure worse or better factors in specific parts of the economy.
“On aggregate, things can look fine, and that would be totally consistent with vulnerabilities showing up, because the aggregate numbers are not good at identifying specific vulnerabilities,” she said.
One way to look under the hood is to examine transitions into delinquency. Credit card and consumer loan delinquency both began steadily rising in 2021, though there are signs they’ve leveled off.
“We’re not yet seeing foreclosures tick up very much, and so this is not necessarily 2008 all over again. The worst type of transitions into delinquency are when people can’t make payments on their home. It’s one thing to not be able to make a payment on your credit card; it’s another thing to worry about getting evicted,” Harris said, adding that he sees this moment as more of a “flashing yellow light, not a flashing red light.”
4. A self-fulfilling consumer sentiment prophecy?
In November, the University of Michigan’s Index of Consumer Sentiment fell to 51, down from nearly 72 a year ago.
That decrease is driven by twin pressures, said Hsu, the survey’s director. At the same time that consumers are frustrated by high prices, they’re also worried about the stability of their incomes.
READ MORE: How to make the most of your holiday gift budget
The second worry in particular defines this period of low sentiment, she said, unlike in the inflationary period right after the pandemic.
“We still have people who are unhappy about high prices, cost of living, affordability. But unlike three years ago, now they’re also worried about their incomes,” Hsu said.
She added that when they asked people if they think unemployment will get worse in the year ahead, 69% said yes, more than double the number of people who felt that way last November.
Breaking down respondents into higher- and lower-income households can also help clarify how people view the economy right now.
“The lion’s share of consumer spending is being generated by higher-income and higher-wealth consumers,” Hsu said. Those people still “don’t feel great” about the economy right now either, but they’re backed by strong financial assets, stock values and incomes, so they report they feel supported to keep spending. Middle- and lower-income people are much less likely to report that they expect their income to increase next year compared to higher-income individuals.
Consumer sentiment can also align along partisan lines. Michigan’s data, which include respondents’ political parties, show that the overall national results track closely with how independent voters feel.
Though consumer sentiment might seem more reflective than predictive, there’s the possibility that it could become a self-fulfilling prophecy, Hsu said.
“It’s called ‘the paradox of thrift,’ where if you think dark times are ahead, it makes sense for each individual family to pull back, to save more, to save for the rainy day and protect themselves. But if enough people do that, people are going to stop spending on a large scale,” she said.
The result could be businesses losing money, laying off workers and ultimately generating a negative feedback loop.
A free press is a cornerstone of a healthy democracy.
Editors’ Highlights are summaries of recent papers by AGU’s journal editors.
Source: AGU Advances
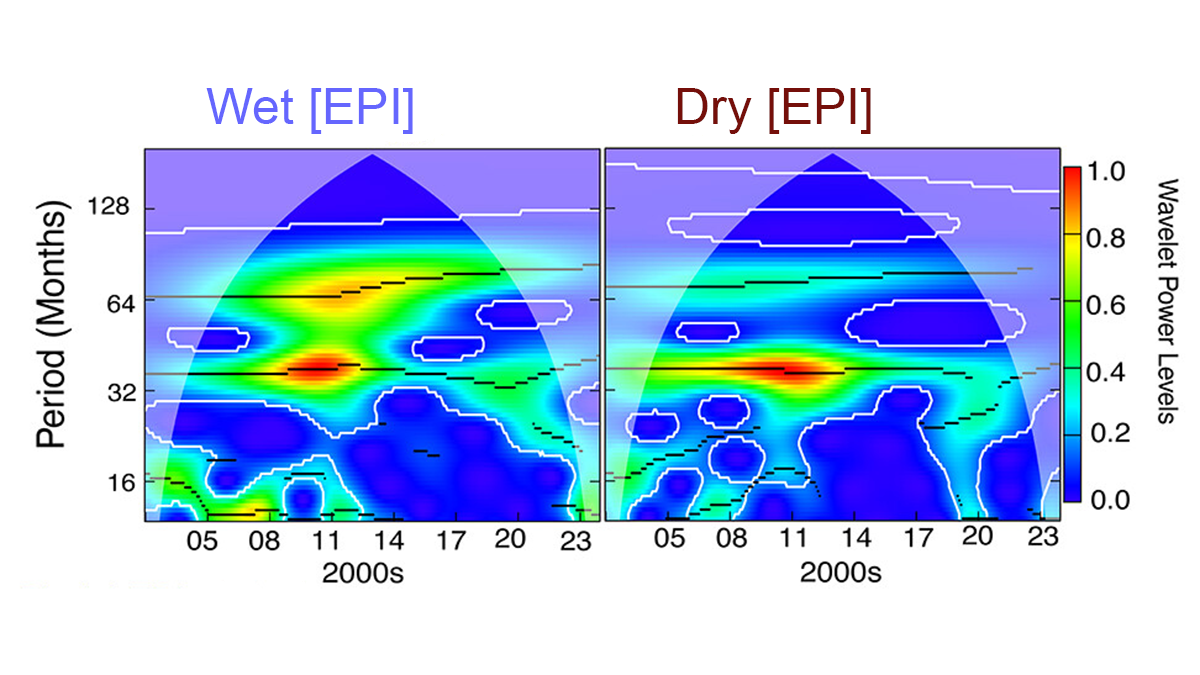
Using data from the GRACE and GRACE-FO satellite missions, Rateb et al. [2025] monitored global changes in terrestrial water storage to study how hydrological extremes—floods and droughts—have developed over the past two decades. Their analysis indicates that these extremes are mainly driven by climate variability in tropical oceans, with both interannual and multi-year patterns playing a significant role.
However, the approximately 22-year satellite record is still too short to fully identify long-term drivers, which limits the ability to determine whether global extremes are increasing or decreasing. To fill data gaps in certain months, the authors use non-parametric probabilistic methods to reconstruct storage anomalies. The reconstructed data closely matched independent datasets, confirming the reliability of their approach. Overall, the study highlights the need to extend satellite observations to capture multi-decadal climate variability and better distinguish natural fluctuations from human-induced changes.
Citation: Rateb, A., Scanlon, B. R., Pokhrel, Y., & Sun, A. (2025). Dynamics and couplings of terrestrial water storage extremes from GRACE and GRACE-FO missions during 2002–2024. AGU Advances, 6, e2025AV001684. https://doi.org/10.1029/2025AV001684