(Bloomberg) — As the US options market heads for a sixth straight year of record volume, some best-known names in the industry are growing nervous about its over-reliance on a small group of banks to guarantee trades for the biggest market makers.
Every listed US options trade goes through The Options Clearing Corp., a central counterparty that handles more than 70 million contracts a day during busy periods. The trades are submitted to the OCC by its members — who help trades get to the clearing house and act as guarantors in case their clients go bust.
Most Read from Bloomberg
There’s a small group of firms at the top. Out of dozens of members, the top five contributed almost half of the OCC’s default fund in the second quarter of 2025. Market participants cite Bank of America Corp., Goldman Sachs Group, Inc. and ABN Amro Bank NV as the three biggest, handling most positions from market makers, who take the other side of almost every options trade. The fact so much volume goes through such a small number of firms raises the risk of widespread losses if one of them should fail.
“I think there is significant concentration risk in clearing intermediation,” Craig Donohue, chief executive officer of Cboe Global Markets, Inc., said in an interview, without naming specific banks. “I do worry about that.”
The risk of a major bank failing is unlikely — but not unheard of. Donohue has his own battle scars from a clearing member default: in October 2011, when he was CEO of CME Group Inc., MF Global declared bankruptcy.
The more immediate risk is that these banks may run out of capacity to support the extraordinary growth of the listed derivatives market, with OCC average daily volume soaring 52% in October from a year earlier. That’s leading to a rise in “self-clearing” by market makers — meaning they become more direct members of the clearing house — which comes with its own risks, given that market makers are more thinly capitalized than banks.
Bank of America and Goldman Sachs declined to comment. ABN Amro did not immediately respond to a request for comment.
Related: SGX to List Perpetual Futures to Rival Crypto ‘Bucket Shops’
Only a handful of clearing brokers have the ability to cross-margin between futures and options, where opposite positions in related instruments can cancel each other out, reducing the amount of margin needed. For example, if a trader is long S&P 500 E-Mini Futures, but short S&P 500 Index Options, the net risk position would be reduced.
“There’s only a few members that can actually support some of the market makers and especially the cross margin program,” Andrej Bolkovic, OCC’s chief executive, said in an interview. “I think the market makers would like to see that change. That’s been a well known thing in the industry and something that we would also honestly support seeing change.”
The challenge for banks is that even if the clearing house involved agrees to give a customer a discount based on the level of net risk, the bank’s own capital framework may treat the two trades separately, requiring extra charges.
Patchwork Regulation
The patchwork US regulatory regime doesn’t help. Banks are regulated through the Federal Reserve System, broker dealers and the options market fall under the Securities and Exchange Commission, while futures, including equity futures, are the purview of the Commodity Futures Trading Commission. That means there are situations when a bank may give its customer the benefit of a cross-margin agreement, while still having to set aside funds itself to back the trade.
The rise of zero-day-to-expiry options and the explosion in retail trading volumes has brought new challenges for clearing members. Any move toward 24 hour, 7 day a week trading could put even more stress on the system and raise the bar higher for other firms to get involved.
The additional investment in upgrading capacity and technology to handle the greater volume and risk is likely to be passed on to clients. Bank of America has already raised the amount it charges clients per trade for options clearing, from between $0.02 – $0.03 to as much as $0.04, according to a person familiar with the matter.
Default Fund
OCC has proposed changing the way it calculates the proportion that each member pays into the roughly $20 billion default fund, to more fairly account for the market risks of each broker’s portfolio. That pot of money is designed to be big enough indemnify other members if the two largest clearing firms go bust at the same time.
Under the current system, 70% of the allocation is based on how a member copes with a roughly ~5% market move, according to Bolkovic. OCC has asked the SEC if it can change that metric to account for a more extreme scenario — a 1987-style market crash, when the Dow Jones Industrial Average plunged 22.6% in a day.
Clearing houses’ ongoing vigilance is itself a sign of strength, Donohue noted. “The regulatory and operational paradigm has adapted to better manage those kinds of risks.”
Donohue — who was OCC chairman from 2014 to 2025 — wants more institutions to step into the options clearing breach.
“If we could wave a magic wand and we could have more competition in that space, more clearing capacity, that was more distributed and dispersed and diverse, that would clearly be very beneficial for the market,” Donohue said.
With the promise of artificial intelligence not yet fully realized, investors are advised to spread their bets and not put all their eggs in one basket, according to Eric Diton of The Wealth Alliance. “Do not lose your diversification. Do not just make your portfolio one big bet on technology and AI, because nothing is a guarantee,” the firm’s president and managing director said in an interview with CNBC. “Regulation could change. There could be some unbelievable competitor out of China that blows everyone away. You don’t know.” The AI trade has been a sore spot for the market lately, as concern has mounted among investors about whether valuations are stretched too far. The tech-heavy Nasdaq Composite fell almost 2% in November, but at one point during the month was down nearly 8% from the October close, lagging behind small monthly gains in the Dow Jones Industrial Average and S & P 500 . AI stocks such as Broadcom and Palantir Technologies scored large gains in the past week, helping the market rebound from the prior week’s loss, but Diton is also bullish on the broader market beyond tech. “Companies are going to get a lot more profitable through AI, and that’s why we’re in the second inning on this thing,” he said. “It is going to change the world, and so you’ve got to be bullish on stocks. Earnings are going to be, for a lot of companies, better and better as they get way more efficient and productive.” Areas in focus Diton points to emerging markets as one way diversify, saying that “some of the greatest companies in the world happen to just not be based in the United States.” Helped by a weaker U.S. dollar, emerging market stocks have almost doubled the return in the S & P 500 this year. U.S. large caps are ahead more than 16% in 2025, while the iShares MSCI Emerging Markets ETF (EEM) – which tracks large- and mid-cap emerging market stocks – has soared nearly 30%. EEM .SPX YTD mountain EEM vs. S & P 500, year-to-date Health-care stocks are another area to lean into, the money manager said. The group has led all 11 S & P 500 sectors in the last few months, climbing 8% in one month and 16% in three months. Diton, a Columbia Business School MBA, also likes utilities, which he calls a “stealth AI play.” Utilities are more than 19% higher in 2025, the third best performing sector in the S & P 500. “Power needs are just growing exponentially, and that plays right into utilities,” Diton said. “They’ve been boring forever, but they’re not as boring now.”
A waste and recycling centre in Dewsbury is to be relocated from one side of its current site to the other so work can be carried out on a nearby railway track.
It comes after the council-run Weaving Lane site was acquired by Network Rail as part of its multibillion-pound Transpennine route upgrade.
The firm said the move was necessary so engineers could access the railway line to build a new retaining wall and create space for new tracks.
The centre was expected to be closed on Sunday 30 November while containers and facilities were moved to the other side of the current site, and it was due to reopen in its new location on Monday 1 December, according to Kirklees Council.
Access to the new location would still be through Thornhill Road and Weaving Lane, but visitors would need to turn left after the entrance gates instead of right, a council spokesperson said.
Tyler Hawkins, cabinet member for highways and waste, said: “This has been a fantastic opportunity to deliver real improvements to recycling facilities in Kirklees.
“The new layout will provide a more accessible facility over two levels with additional parking, making it much easier and safer for the public to access the containers and dispose of their household waste.”
Andrew Campbell, Transpennine route upgrade sponsor, said the work would enable the firm “to press ahead with plans to install more tracks throughout this section of railway and beyond so that faster, more frequent, services can run in the future.
“The Transpennine route upgrade will deliver improved rail journeys across the North, and our ongoing collaboration with Kirklees Council is vital.”
The Away Luggage Black Friday Sale is still going strong. During the brand’s largest sale of the year, you can save 25% sitewide through Dec. 1 on editor-approved suitcases and travel items. You’ll also get an extra 10% off when you spend $750 or more. If you’re looking for some recommendations, our favorites include The Bigger Carry-On and The Aluminum Carry-On, our pick for the best value aluminum luggage.
Away’s Black Friday Sale is live. Shop editor-approved luggage and bags for 25% off.
ILLUSTRATION: FORBES / PHOTOS: RETAILERS
Whether you’re traveling for the holidays or picking out a gift for a globetrotter, now’s a great time to take advantage of Away’s markdowns—we haven’t seen a deal this good since last Black Friday. With 27 suitcases, 48 bags (including totes, backpacks and duffles) and 32 accessories to choose from, there’s a lot to browse. Ahead, find 12 of the best editor-approved products from Away and everything else you need to know about the sale.
The Best Away Luggage Black Friday Deals At A Glance
Best Away Luggage Black Friday Deals
This classic carry-on is Away’s smallest suitcase: a lightweight and durable option that’s compatible with most airline regulations. “After using this suitcase, I was impressed by its navigating, 360 wheels, easy-to-use handle, thoughtfully placed interior pockets and sturdy, sleek design,” says senior reviews editor Anna Perling.
Want to save this story for later?
No need to bookmark—get it straight to your inbox.
We’ve sent this story to your inbox.
After researching and testing 15 carry-ons, our travel team named this design the best carry-on overall. Made of the same durable material as the smaller version listed above, this model isn’t expandable but makes up for it by offering more room, enough for a weeks worth of travel. “At almost 48 liters, it offers incredible capacity for being a carry-on suitcase—I’ve slid it into dozens of overhead bins on a variety of different airlines and never had a problem with its size,” says one tester.
The Medium is our favorite checked bag from the brand, due to it’s just-right size. Our editors found this suitcase has enough room to accommodate for up to two weeks of travel without feeling bulky or heavy.
True to its name, The Large is one of Away’s most spacious designs. It has a 104-liter capacity, offering plenty of space to store up to 18 outfits or over two weeks’ worth of travel essentials. Like other models, this one comes with the brand’s classic features, including 360-degree wheels and a TSA-approved lock.
While more of an investment, aluminum luggage can hold up to the inevitable wear and tear of extensive travel. Right now, take $156 off our pick for the best value aluminum luggage. The compact model features leather detailing, a dual TSA-approved combination lock, spinner wheels and an interior compression system with a hidden laundry bag.
Globetrotters on the Forbes Vetted team love The Carry-On Flex for international travel. “The expandability makes it spacious enough for five to six days of travel, and it has an excellent compression system,” says one of our testers who traveled to Stockholm twice with it. And despite the expansive size, it’s still compatible with most airlines’ overhead bins.
We named this water-resistant bag the best weekender bag for short trips because of its spacious interior (it’s the largest bag from the brand) and its clamshell-style opening. Another perk is its trolley sleeve that lets you secure it to your suitcase as you’re rolling through the airport. When you want to streamline, you can carry it using its detachable padded shoulder strap and top handles.
When testing the best Away luggage, our team appreciated The Trunk model for its durability, ease of rolling and spacious interior. Away’s largest design—and one of the largest on the market—the model features a deep main compartment that’s spacious enough to hold up to three weeks’ worth of clothes. Despite the larger size, its elongated shape also creates a more streamlined silhouette that takes up less space in your car.
Whether you’re commuting or planning a long weekend trip, this compact suitcase is the model for you. Made of Away’s softside material (a durable, weather-resistant nylon), this model features a front pocket, a laptop compartment, the brand’s interior compression pad and enough space for around three days’ worth of clothes.
This lightweight, water-repellent bag is a must-have. You can store and organize your essentials thanks to its spacious interior and various interior compartments. Its also has hidden exterior pockets, so you can easily access headphones, passports and other essentials. If you’re looking for a bag with more room or a laptop sleeve, consider shopping the Large Featherweight Crossbody.
Away: Built for modern travel
Featuring water-resistant nylon and leather trim, this tote bag has everything you need to stay organized on your trip, including enough room for a 16-inch laptop and plenty of secure zippered compartments for valuables.
Away: Built for modern travel
For those who bring a bevy of cosmetics with them, this hanging toiletry case is a game changer. Crafted from water-repellent nylon, it contains three mesh compartments to keep toiletries organized, plus a convenient hook to hang easily over a door when you arrive at your destination.
Frequently Asked Questions About Away Luggage
Will Away Do A Black Friday Sale?
Yes, Away is currently hosting its Black Friday Sale. From now through Dec. 1, you can save 25% sitewide on editor-approved luggage, bags and travel accessories. Throughout the event, we’ll continue updating this article with the best deals available from the sale.
Do Away Suitcases Ever Go On Sale?
Yes, Away suitcases do occasionally go on sale. The top-rated suitcases have been 20% off this past year—and up to 30% off individual models through its Amazon storefront—but its current promotion is the best offer we’ve seen directly from the brand since last Black Friday.
After testing numerous suitcases from various brands, the Forbes Vetted travel team consistently praises Away luggage, citing durability as one of the brand’s best features. Away’s suitcases come in three materials (softside, hardside and aluminum). While each of its materials can withstand regular use, the aluminum luggage is considered the sturdiest option that can hold up to the wear and tear of traveling.
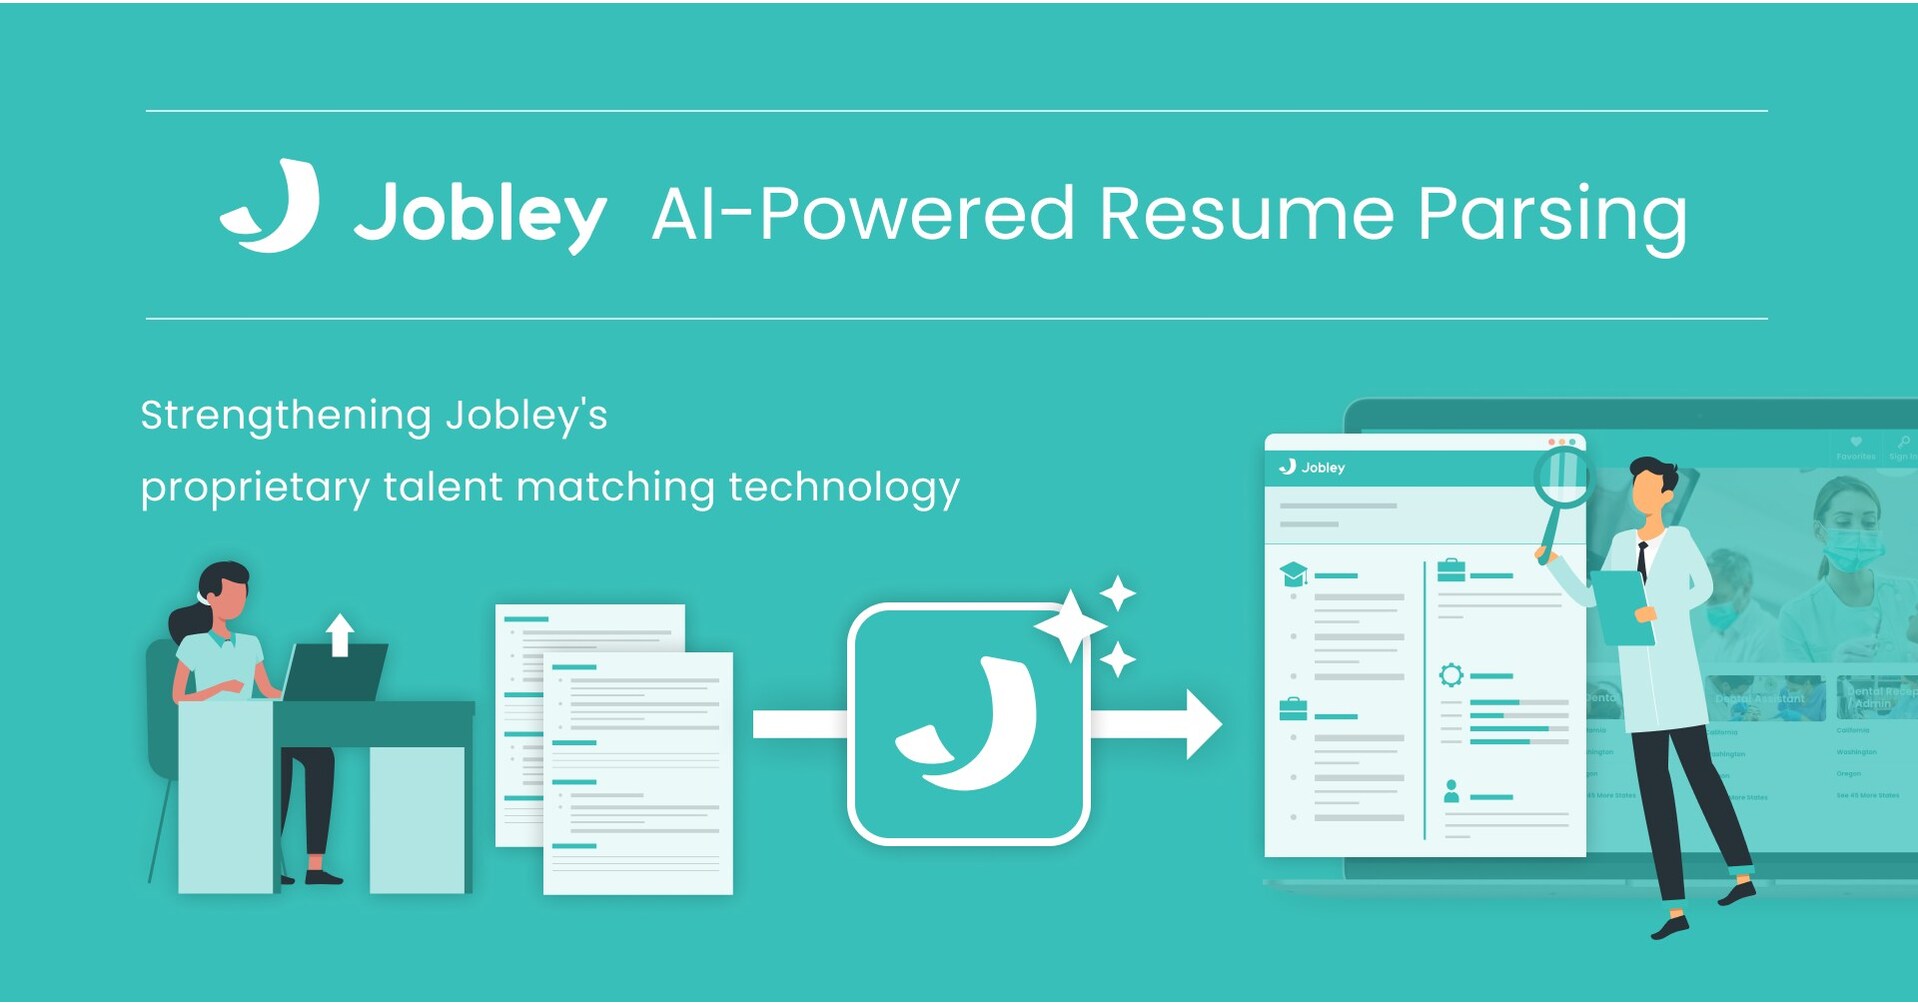
The new AI feature strengthens the accuracy and efficiency of Jobley’s proprietary talent matching technology, helping employers successfully identify qualified professionals
BELLEVUE, Wash., Nov. 30, 2025 /PRNewswire/ — Jobley, a hiring platform for U.S. dental and healthcare professionals operated by Medley (TSE: 4480), a Japan-based health technology group, today announced the launch of a new AI-powered resume parsing feature, designed to strengthen its proprietary talent matching technology. The new feature leverages AI to automatically analyze resumes and generate optimized candidate profiles based on experience, skills, licenses, certifications, and other relevant factors. This enhancement enables more precise talent matching, allowing employers to more easily identify candidates who meet their hiring needs—even before they apply. It also boosts the effectiveness of both direct outreach by employers and Jobley’s expert hiring support.
Jobley’s AI-Powered Resume Parsing
Dental Hiring Challenges Persist
The dental industry faces persistent difficulties in recruiting qualified professionals, with many practices investing significant time and resources to find candidates who meet their specific needs.
Employers are increasingly seeking more proactive and efficient ways to connect with potential candidates, rather than relying solely on inbound applications. However, the accuracy of early-stage matching—which is critical to the success of subsequent steps in the hiring process—depends heavily on the completeness and quality of information provided by job seekers. When such data is insufficient, overall hiring efficiency and effectiveness often becomes limited.
AI-Driven Matching for a Smarter Hiring Experience
Jobley’s newly introduced feature uses AI to automatically parse resumes submitted by job seekers, transforming them into structured, searchable profiles that reflect experience, licenses, certifications, and key skills aligned with employers’ hiring needs.
This feature’s expected benefits include:
Automatically generated and optimized candidate profiles from uploaded resumes, regardless of format or file type
Significant improvement in the accuracy, volume, and quality of pre-application candidate data, enabling more efficient early-stage talent matching
Easier proactive outreach to potential candidates by employers, even before they apply
Enhanced matching outcomes through Jobley’s expert hiring support
Currently, only a limited portion of Jobley users have complete profiles that enable effective system-based matching. With the new AI-powered capability, Jobley expects a substantial increase in the availability of searchable, high-quality candidate data once resumes are uploaded—driving significant improvements in overall talent matching, further enhanced by personalized expert support.
“By integrating advanced AI capabilities, we’re making it easier than ever for dental employers to find qualified professionals quickly and precisely,” said Sunny Tsang, Head of Product for Jobley. “Across the Medley group, we are accelerating the adoption of AI to enhance solutions that empower healthcare providers, professionals, and patients alike. For Jobley, this new feature blends the latest technology with our dedicated support team’s expertise to elevate the hiring experience for dental providers and professionals.”
Looking Ahead: Advancing with Technology and Human Expertise
Jobley will continue to advance the usability of its platform and services—leveraging technologies such as the expanded use of AI, combined with expert hiring support—to help address hiring challenges faced by dental practices nationwide. The company remains dedicated to creating a more seamless and performance-driven hiring experience for dental employers and professionals across the United States.
To find out more, visit Jobley’s website.
About Jobley
Jobley is a hiring platform for U.S. dental and healthcare professionals, operating in 44 states and D.C. With a diverse team of specialists passionate about solving hiring challenges in the healthcare field, Jobley streamlines the recruitment process and effectively connects practices with the talent they need.
Jobley was launched by Medley (MEDLEY, INC. | TSE: 4480), a Japan-based health technology company. Since 2009, Medley has been committed to creating the future of healthcare through innovative products and services, including one of Japan’s largest healthcare hiring platforms, now used by 38% of healthcare providers nationwide (as of September 2025).
Supported by a multidisciplinary team of engineers, physicians, and other healthcare professionals, Medley is also applying AI to address critical challenges in healthcare under the new brand “MEDLEY AI CLOUD,” a next-generation platform that connects providers across all sectors of healthcare with patients and the public. It improves operational efficiency for healthcare providers through reliable technology and enhances patient experiences. Medley continues to develop and deliver solutions that benefit patients, healthcare professionals, providers, and society as a whole.
Nov 30 (Reuters) – Stock markets in the Gulf ended mixed on Sunday following an easing in crude prices on Friday while anticipation of a U.S. Federal Reserve rate cut next month underpinned sentiment.
Crude futures fell marginally on Friday as investors considered oil’s geopolitical risk premium amid drawn-out Russia-Ukraine peace talks.
Sign up here.
OPEC+ will likely leave oil output levels unchanged at its meetings on Sunday, four OPEC+ sources said as the producer group slows down its push to regain market share amid fears of a .
Saudi Arabia’s benchmark share index (.TASI), opens new tab slipped 0.5%, with Saudi Arabian Mining Company (1211.SE), opens new tab losing 2.2% and oil giant Saudi Aramco (2222.SE), opens new tab down 0.4%.
Saudi Arabia, the world’s biggest oil exporter, is expected to lower
In Qatar, the main share index (.QSI), opens new tab eased 0.3%, with Qatar National Bank (QNBK.QA), opens new tab, the Gulf’s biggest lender by assets, down 1.1%.
Outside the Gulf, Egypt’s blue-chip index (.EGX30), opens new tab advanced 1.7%, with Talaat Moustafa Group Holding (TMGH.CA), opens new tab jumping 6.2%.
Reporting by Ateeq Shariff in Bengaluru; Editing by Emelia Sithole-Matarise
Our Standards: The Thomson Reuters Trust Principles., opens new tab
Canada don announce new immigration levels plans wey go increase di number of economic immigrants wey intend to come di kontri, and cut down di number of temporary residents, mostly through student visas.
For one update wey di Canada Immigration release on dia website dem unveil di plans for 2026-2028, wey include di plan to take in 380,000 permanent residents and reduce di number of pipo wey wan come di kontri for work and study.
Di statement explain say di reason na say Canada don enta phase of stabilization and no get plan to bring in more pipo, but to balance dia population wit di housing, healthcare and infrastructure capacity of di kontri.
For 2026, di IRCC dey expect to give out like 408,000 study permits.
Dis one go include di 155,000 permits wey dem go give international students wey just dey land and di 253,000 extensions wey dem dey give current and returning students.
Dis amount dey seven percent less dan 2025 wen dem bin target 437,000 and 16% less than di target wey dem bin get for 2024, to issue 485,000 permits.
All dis one na sake of di kontri overall work to reduce di temporary population for di kontri.
Dem also wan bring sustainablity to di immigration system. Di plan na to drop di total amount of temporary migrants for Canada to under five percent of di total population for 2027.
Oda changes wey dem dey put for inside di di immigration waka be say, from 1 January, 2026, as student wey do masters or doctorate for public designated learning institution (DLI) , dem no go need to submit provincial or territorial attestation letter (PAL/TAL) again wen dem dey submit dia study permit application.
Dem announce say dis na di groups wey no go need di PAL/TAL requirement for 2026.
Masters and Doctoral degree students wey dey enrolled for public DLIs New
Primary and secondary (kindergarten to grade 12) students
certain Goment of Canada priority groups and vulnerable cohorts
existing study permit holders wey dey apply for extension for di same DLI and for di same level of study.
Di number of study permits wey dey expected to go out for 2026 dey broken by student cohorts. E be like dis
49,000 Masters and doctoral students wey dey go public DLIs (PAL/TAL-exempt)
115,000 Primary and secondary school (kindergarten to grade 12) students (PAL/TAL-exempt)
64,000 oda applicants wey want PAL/TAL-exempt study permit
180,000 PAL/TAL-required applicants
For 2026, di 180,000 study permits for di applicants wey still need PAL/TAL go dey shared according to di provinces and territories dia popultion.
Alberta – 21,582
British Columbia – 24,786
Manitoba – 6,534
New Brunswick – 3,726
Newfoundland and Labrador – 2,358
Northwest Territories – 198
Nova Scotia – 4,680
Nunavut – 180
Ontario – 70,074
Prince Edward Island – 774
Quebec – 39,474
Saskatchewan – 5,436
Yukon – 198
Di overall number of study permit applications wey IRCC go accept for processing for PAL/TAL-required students for 2026 na 309,670.
Di number dey based on di application wry dey believed say each jurristiction go need to complete dia issuance targets based on di approval rate of stidy permit applications from 2024 to 2025.
Many Corteva, Inc. (NYSE:CTVA) insiders ditched their stock over the past year, which may be of interest to the company’s shareholders. When analyzing insider transactions, it is usually more valuable to know whether insiders are buying versus knowing if they are selling, as the latter sends an ambiguous message. However, shareholders should take a deeper look if several insiders are selling stock over a specific time period.
While insider transactions are not the most important thing when it comes to long-term investing, logic dictates you should pay some attention to whether insiders are buying or selling shares.
AI is about to change healthcare. These 20 stocks are working on everything from early diagnostics to drug discovery. The best part – they are all under $10bn in marketcap – there is still time to get in early.
In the last twelve months, the biggest single sale by an insider was when the CEO & Director, Charles Magro, sold US$3.0m worth of shares at a price of US$63.82 per share. So it’s clear an insider wanted to take some cash off the table, even below the current price of US$67.47. As a general rule we consider it to be discouraging when insiders are selling below the current price, because it suggests they were happy with a lower valuation. Please do note, however, that sellers may have a variety of reasons for selling, so we don’t know for sure what they think of the stock price. This single sale was just 26% of Charles Magro’s stake.
In the last year Corteva insiders didn’t buy any company stock. You can see the insider transactions (by companies and individuals) over the last year depicted in the chart below. If you click on the chart, you can see all the individual transactions, including the share price, individual, and the date!
Check out our latest analysis for Corteva
NYSE:CTVA Insider Trading Volume November 30th 2025
For those who like to find hidden gems this free list of small cap companies with recent insider purchasing, could be just the ticket.
Another way to test the alignment between the leaders of a company and other shareholders is to look at how many shares they own. Usually, the higher the insider ownership, the more likely it is that insiders will be incentivised to build the company for the long term. Insiders own 0.1% of Corteva shares, worth about US$58m. While this is a strong but not outstanding level of insider ownership, it’s enough to indicate some alignment between management and smaller shareholders.
It doesn’t really mean much that no insider has traded Corteva shares in the last quarter. Still, the insider transactions at Corteva in the last 12 months are not very heartening. The modest level of insider ownership is, at least, some comfort. Of course, the future is what matters most. So if you are interested in Corteva, you should check out this free report on analyst forecasts for the company.
But note: Corteva may not be the best stock to buy. So take a peek at this free list of interesting companies with high ROE and low debt.
For the purposes of this article, insiders are those individuals who report their transactions to the relevant regulatory body. We currently account for open market transactions and private dispositions of direct interests only, but not derivative transactions or indirect interests.
Have feedback on this article? Concerned about the content?Get in touch with us directly. Alternatively, email editorial-team (at) simplywallst.com.
This article by Simply Wall St is general in nature. We provide commentary based on historical data and analyst forecasts only using an unbiased methodology and our articles are not intended to be financial advice. It does not constitute a recommendation to buy or sell any stock, and does not take account of your objectives, or your financial situation. We aim to bring you long-term focused analysis driven by fundamental data. Note that our analysis may not factor in the latest price-sensitive company announcements or qualitative material. Simply Wall St has no position in any stocks mentioned.
This story is available exclusively to Business Insider
subscribers. Become an Insider
and start reading now. Have an account? .
Jay Graber studied how technology interacts with society at the University of Pennsylvania.
Bluesky’s open protocol offers a decentralized alternative to X and Meta platforms.
Here is a look at Graber’s career and her unconventional path to Silicon Valley.
Jay Graber is the engineer behind one of the most ambitious experiments in reimagining social media.
The Tulsa-born CEO is best known for steering Bluesky, the decentralized platform she describes as a “billionaire-proof” alternative to X and Meta-owned platforms.
Graber’s emergence as a Silicon Valley power playerwas unconventional. In 2021, former Twitter CEO Jack Dorsey tapped her to lead the Bluesky project, which was spun off as an independent public benefit company, just before Elon Musk’s takeover of Twitter.
Since then, Bluesky’s user base has grown to over 40 million as of November 2025,powered by its open protocol, customizable moderation system, and promise of a more democratic digital ecosystem.
Here’s a look at Graber’s career timeline, from her early work in cryptocurrency to her rise as the architect of a new, user-owned social media platform:
Early life
Jay Graber was born Lantian Graber in Tulsa, Oklahoma. Kimberly White/Getty Images for WIRED
Jay Graber was born Lantian Graber in Tulsa, Oklahoma, to a mother who is an immigrant from China during the Cultural Revolution and a father of Swiss descent. Her mother, who is an acupuncturist, named Graber “Lantian”, which means “blue sky” in Chinese, as a wish that she would have “boundless freedom.” She was aptly named for the job she would eventually be given.
Her father is a mathematics teacher, and in a 2024 profile of Graber in Cosmico, he is cited as a source of intellectual and academic influence for Graber.
Education
Jay Graber studied Science, Technology & Society at the University of Pennsylvania. Erica Denhoff/Icon Sportswire via Getty Images
At the University of Pennsylvania, Graber studied Science, Technology & Society, which isan interdisciplinary program that examines how technological innovation intersects with culture, politics, and ethics.
Rather than focusing solely on coding or engineering, the program allowed Graber to explore the broader systems that shape how technology is developed and utilized, an approach that later influenced her views onsocial networks and digital governance.
Some of her key guiding views include a decentralized internet and open source social media protocols. “We believe that the protocol is the fundamental guarantee on freedom of speech,” Graber said once during an interview with Fast Company.
Before Bluesky
Jay Graber is well known in crypto circles for her work on Zcash. Peter Dazeley/Getty Images
Graber’s early career unfolded during the first wave of blockchain innovation in the mid-2010s. After graduating from the University of Pennsylvania, she began her career as a software engineer at SkuChain, a startup focused on utilizing blockchain for supply-chain management. Around the same time, she also built andsoldered bitcoin-mining rigs, deepening her technical grasp of decentralized systems beyond software.
Between 2016 and 2018, Graber joined the privacy-focused cryptocurrency project Zcash as a junior developer, contributing to one of the most advanced implementations of zero-knowledge proofs. Later, in 2019, she founded Happening, Inc., an events app that aimed to help communities organize and connect through shared experiences.
Happening, Inc. never really took off, but these early roles grounded Graber in both the engineering and ideological foundations of decentralized technology, which later shaped the vision for Bluesky as an open, user-controlled social network.
Joining Bluesky
Jay Graber negotiated a formal spin-out of Bluesky from Twitter as a Public Benefit Company. Illustration by Omar Marques/SOPA Images/LightRocket via Getty Images
When Jack Dorsey, then CEO of Twitter, first announced Bluesky in late 2019, it was a small, Twitter-funded initiative tasked with researching an open and decentralized standard for social media.
By August 2021, Dorsey decided to onboard Graber, who was then known in crypto circles for her work on Zcash and decentralized community tools, to lead and accelerate the effort.However, according to an April 2025 profile of Graber in the New Yorker, she quickly realized that for Bluesky to fulfill its mission, it needs to create a social protocol separate from any single corporation and maintain independence from Twitter.
With Dorsey’s backing, Graber negotiated a formal spin-out by October 2021 and incorporated Bluesky as a public benefit corporation, a legal structure that allowed it to prioritize user benefits and open standards over shareholder profit.
Twitter provided an initial $13 million in funding to give the new entity “freedom and independence to get started,” as Dorsey publicly described at the time.
Bluesky’s rise
Jay Graber separated Bluesky from Twitter just before Elon Musk’s takeover. Illustration by Thomas Fuller/SOPA Images/LightRocket via Getty Images
Graber’s early move to separate Bluesky from Twitter may have saved it.
When Elon Musk acquired Twitter in 2022 and renamed the platform X, Bluesky’s independence allowed it to thrive and emerge as a competitor to X as droves of users left the platform.
In September 2023, Bluesky only had around 1 million registered users, but this figure climbed to more than 20 million by the end of November 2024. The meteoric rise came after a user surge in Brazil after X was temporarily restricted there, as well as 1.25 million user gains the week after Donald Trump won the 2024 presidential election.
As of November 2025, Bluesky has around 40 million registered users. That is no match for X’s roughly 560 million users, but it provided an alternative for those dissatisfied with X’s ownership and content moderation.
Calling out Big Tech
Jay Graber wore a black T-shirt that reads “Mundus sine caesaribus,” meaning “a world without Caesars.” Samantha Burkardt/SXSW Conference & Festivals via Getty Images
Graber has taken a subtle dig at Mark Zuckerberg, the CEO of Meta, which owns Facebook, Instagram, and Threads.
During SXSW in Austin in March 2025, Graber wore a black T-shirt that reads “Mundus sine caesaribus,” meaning “a world without Caesars.” The design and font are widely interpreted as a response to Zuckerberg’s own Latin slogan shirt, which reads “Aut Zuck aut nihil,” meaning “either Zuck or nothing.”
The shirt drew public curiosity, and Bluesky began selling the same shirt. A spokesperson for the company told Business Insider at the time that the shirts sold out in 30 minutes, representing the company’s “democratic approach, where no single CEO or company controls your experience online.”
A modest net worth
Compared to most tech CEOs, Jay Graber has a modest net worth. DON MACKINNON/AFP via Getty Images
Compared to other Silicon Valley CEOs who run major social media platforms, all of whom are billionaires, Graber has a very modest net worth.
Estimates of Graber’s net worth fall between $2.95 million and $5 million, mostly depending on her equity in Bluesky. Since Bluesky is not a publicly traded company, Graber’s stake in the company and her annual compensation are not publicly disclosed.
As of early 2025, Bluesky’s valuation is estimated to be around $700 million.
A ‘billionaire-proof’ platform
Jay Graber positions Bluesky as a “billionaire-proof” platform. Sam Barnes/Web Summit via Sportsfile via Getty Images
Graber positions Bluesky as a new kind of social network.
Bluesky is built on an open-source Authenticated Transfer Protocol, which decentralizes social networking and hands more control to users rather than a single company or executive.
“The billionaire proof is in the way everything is designed, and so if someone bought or if the Bluesky company went down, everything is open source,” Graber told CNBC in an interview in November 2024.
“What happened to Twitter couldn’t happen to us in the same ways, because you would always have the option to immediately move without having to start over,”Graber added, referring to Musk’s purchase of the platform that is now named X.
Unlike traditional social platforms like X or Facebook, Bluesky is built on an open-source ecosystem called the ATmosphere, powered by the Authenticated Transfer Protocol. The system gives users the ability to design and customize their own ranking algorithms, carry their posts and followers with them across different apps, and avoid being subject to any platform’s arbitrary or politically driven moderation decisions.
Activism on Bluesky
Protesters from the Tesla Takedown movement gather outside a Tesla pop-up store Thomas Krych/Anadolu via Getty Images
Bluesky became a platform widely used by progressive activists and community organizers.
The Tesla Takedown movement, a pushback against Tesla CEO Elon Musk’s involvement with Donald Trump and the White House’s DOGE office, famously spread via Bluesky when actor Alex Winter contacted a sociologist in Boston to build a website where people could organize local protests.
But the progressiveness of Bluesky also seems to have spooked some politicians. Semafor’s media reporter Max Tani wrote in May 2025 that some congressional staffers told him that they gave up on using Bluesky as an alternative to X, because “their bosses kept getting yelled at by Democratic users angry at their impotence.”
Changing the ecosystem
Jay Graber is not worried about Bluesky’s slower growth in terms of registered and active users Eugene Gologursky/Getty Images for Fast Company
Graber is unfazed by Bluesky’s slower growth in terms of registered and active users.
In an interview in May with Fast Company, Graber said that reports of Bluesky’s death are “greatly exaggerated” and that growth “comes in waves,” with new communities being established at each stage.
“We’re still seeing a lot of community formation, and one of the most exciting things is how structurally different this is,” said Graber. “It’s not just another social site that has to be a singular winner-take-all in an ecosystem with existing incumbents.”
In 2025, Bluesky still added around 10 million newly registered users.
A warning against AI over-reliance
Jay Graber warns you shouldn’t “fully outsource your thinking” to AI. Eugene Gologursky/Getty Images for Fast Company
Graber has tips on how to thrive in an era of AI, and reliance is not the answer.
“AI can handle many reasoning tasks, but if we fully outsource our thinking, it’s not good enough,” Graber told Business Insider.
She added that for students, that might mean writing essays by hand to “build the muscle for critical thinking.”
At Bluesky, Graber said AI is used for moderation and curation but never runs on its own, because while AI delivers packaged expertise, human value lies in judgment and adaptability.
For job seekers, Graber encourages workers to adopt a generalist mindset and master core skills such as writing and coding.
“If you don’t know what good code looks like,” she said, “you won’t be able to evaluate AI’s output.”