Kitchen boot camp
Think your kitchen works hard? Ours train harder. Before any IKEA kitchen door model makes it to your home, our friends in the IKEA Test Lab have opened and closed it 200,000 times with a 2 kg weight added in the middle, simulating years of daily use. Drawers don’t have it any easier: they’re still expected to glide softly and self‑close after opening and closing a couple of hundred thousand times, plus “lean‑on” tests with a 25 kg weight on the corner of the front. Meanwhile, our fronts face steam, soaking and 85°C heat tests, and our shelves are loaded for a week to check for sagging. As you can see, only the toughest graduates make it out of the lab and into the showroom.

Twins, but not identical
Planning to move to or from North America anytime soon? If so, you can leave your IKEA kitchen at home. While METOD is our go-to kitchen system in Europe, Australia and much of Asia, the slightly larger SEKTION is the US and Canada version. They may look pretty identical, but they speak different languages: metric measurements for METOD, imperial for SEKTION. That means cabinets, doors, and even drill holes don’t match up – and you can’t attach a METOD door to a SEKTION frame, no matter how tempting it looks. The good news? Each system is tailored to local appliances and standards, meaning your kitchen works just as it should for your region and your way of life.

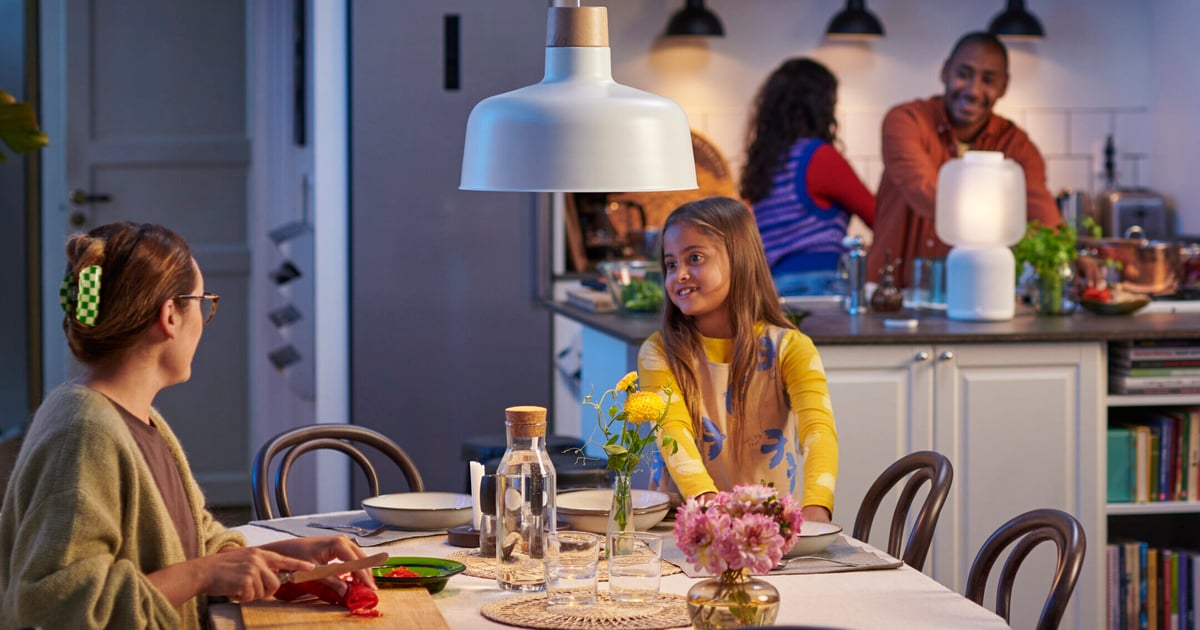
The kitchen paradox
Isn’t it curious that the kitchen, often called the heart of the home, is where many of us feel least satisfied? We spend about 14 hours a week cooking there – and even more time cleaning, chatting, and helping with homework. At the same time, the latest IKEA Life at Home Report reveals that nearly 1 in 3 people in Switzerland find joy in cooking, which also happens to be the third most popular hobby globally. Those who enjoy cooking slow or experimental meals, and those who involve kids in cooking, are also found to be happier at home. Centres’ Life in Communities Report adds that 31% of us cook with others outside the home, making it a top-five shared activity. Turns out, the secret ingredient for a happy kitchen might just be how we choose to use it.

The world’s most travelled cabinets
Since their launch over a decade ago, we’ve delivered 150 million METOD and SEKTION cabinets, transforming 13.5 million kitchens across the globe in the process. Stack them all end to end, and you’d have a column of cabinets reaching halfway to the moon – an impressive 130,000 km of clever storage. Or why not line them up? That would cover almost two and a half laps of the planet – a global journey in more ways than one, making everyday life better for millions, one kitchen at a time. From Stockholm to Sydney, our kitchen cabinets are proof that affordable, well-designed furniture isn’t just practical – it can really take you places.

Your kitchen can have impact (and that’s a fact)
A better, more sustainable everyday life begins right where we chop, stir and share meals: the kitchen. This year’s People and Planet Consumer Insights and Trends research tells us that storing food properly and recycling aren’t just two of the most effective actions to address climate change, they’re also two of the most popular (82% and 77% of people doing them respectively). The same can be said for leftovers, with more than half of us keeping and using them at home. The twist comes with plant-rich diets: they’re one of the most impactful actions, but only 15% of people regularly choose veggie or vegan meals. So, what will you make for dinner tonight?
Anything else you’d like to know?
At IKEA, we have so many stories to tell. But many of them stay right here, within IKEA. That’s where our “Who knew?” series comes in. Is there anything you’ve always wondered about IKEA but never had the chance to ask? Contact us at [email protected] and we’ll get digging.
About Ingka Group
With IKEA retail operations in 31 markets, Ingka Group is the largest IKEA retailer and represents 87% of IKEA retail sales. It is a strategic partner to develop and innovate the IKEA business and help define common IKEA strategies. Ingka Group owns and operates IKEA sales channels under franchise agreements with Inter IKEA Systems B.V. It has three business areas: IKEA Retail, Ingka Investments and Ingka Centres. Read more on Ingka.com.