Google just threw another twist in the fast-changing AI race. And its biggest competitors are taking notice.
“We’re delighted by Google’s success — they’ve made great advances in AI and we continue to supply to Google,” Nvidia wrote in a November 25 post on X, before adding that “NVIDIA offers greater performance, versatility, and fungibility than ASICs,” (the application-specific integrated circuits) like those made by Google.
“Congrats to Google on Gemini 3! Looks like a great model,” OpenAI CEO Sam Altman also wrote on X.
The posts came just days after mounting buzz about Google’s Gemini 3 model — and the Google-made chips that help to power it. Salesforce CEO Marc Benioff wrote on X that he’s not going back to ChatGPT after trying Google’s new model. “The leap is insane — reasoning, speed, images, video… everything is sharper and faster. It feels like the world just changed, again,” he wrote.
Now Meta is said to be in talks with Google about buying its Tensor chips, according to The Information, coming after Anthropic said in October that it plans to significantly expand its own use of Google’s technology.
Shares of Google were up nearly 8% last week, while Nvidia’s were down a little over 2%.
At stake is more than just bragging rights or a few sales contracts. As the tech industry claims AI will reshape the world — including investment portfolios belonging to everyone from billionaires to 401k-holding retirees — what company and what vision comes out on top could affect nearly every American.
At face value, Nvidia’s post says the company isn’t worried about Google encroaching on its territory. And for good reason — Google’s chips are fundamentally different from Nvidia’s offerings, meaning they aren’t a match-for-match alternative.
But that OpenAI and Nvidia felt the need to acknowledge Google at all is telling.
“They’re in the lead for now, let’s call it, until somebody else comes up with the next model,” Angelo Zino, senior vice president and technology lead at CFRA, told CNN.
Google and Meta did not immediately respond to a request for comment. Nvidia declined to comment.
Google is hardly an AI underdog. Along with ChatGPT, Gemini is one of the world’s most popular AI chatbots, and Google is one of the few cloud providers large enough to be known as a “hyperscaler,” a term for the handful of tech giants that rent out cloud-based computing resources to other companies on a large scale. Google services like Search and Translate have used AI as far back as the early 2000s.
Even so, Google was largely caught flat-footed by OpenAI’s ChatGPT when it arrived in 2022. Google management reportedly issued a “code red” in December 2022 following ChatGPT’s seemingly overnight success, according to The New York Times. ChatGPT now has at least 800 million weekly active users, according to its maker, OpenAI, while Google’s Gemini app has 650 million monthly active users.
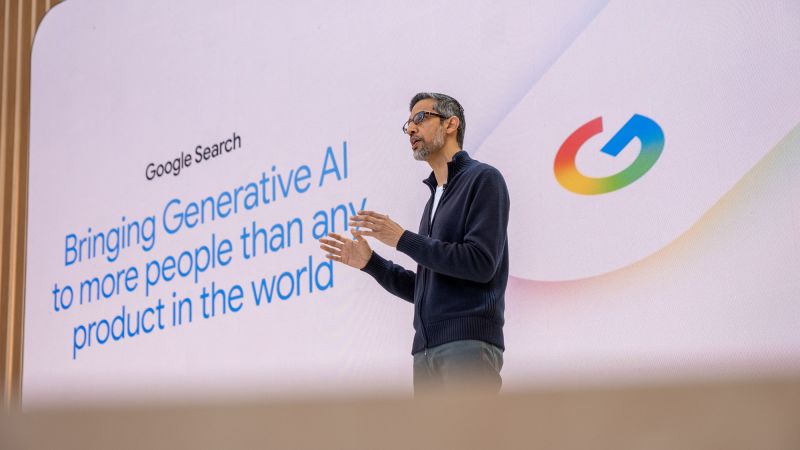
But Gemini 3, which debuted on November 18, now sits at the top of benchmark leaderboards for tasks like text generation, image editing, image processing and turning text into images, putting it ahead of rivals like ChatGPT, xAI’s Grok and Anthropic’s Claude in those categories.
Google said over one million users tried Gemini 3 in its first 24 hours through both the company’s AI coding program and the tools that allow digital services to connect to other apps.
But people tend to use different AI models for different purposes, says Ben Barringer, the global head of technology research at investment firm Quilter Cheviot. For example, models from xAI and Perplexity are ranked higher than Gemini 3 search performance in benchmark tests.
“It doesn’t necessarily mean (Google parent) Alphabet is going to be … the end-all when it comes to AI,” said Zino. “They’re just kind of another piece to this AI ecosystem that continues to get bigger.”
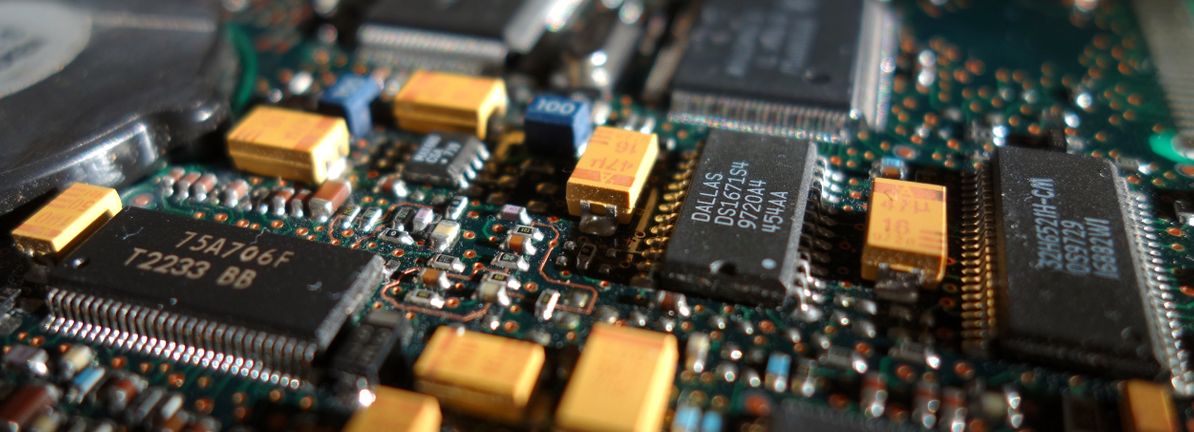
Google began making its Tensor chips long before the recent AI boom. But Nvidia still dominates in AI chips with the company reporting 62% year-over-year sales growth in the October quarter and profits up 65% compared to a year ago.
That’s largely because Nvidia’s chips are powerful and can be used more broadly. Nvidia and its chief rival, AMD, specialize in chips known as graphics processing units, or GPUs, which can perform vast amounts of complex calculations quickly.
Google’s Tensor chips are ASICs, or chips that are custom-made for specific purposes.
While GPUs and Google’s chips can both be used for training and running AI models, ASICs are usually designed for “narrower workloads” than GPUs are designed for, Jacob Feldgoise, senior data research analyst at Georgetown’s Center for Security and Emerging Technology, told CNN in an email.
Beyond the differences in the types of chips themselves, Nvidia provides full technology packages to be used in data centers that include not just GPUs, but other critical components like networking chips.
It also offers a software platform that allows developers to tailor their code so that their apps can make better use of Nvidia’s chips, a key selling point for hooking in long-term customers. Even Google is an Nvidia client.
“If you look at the magnitude of Nvidia’s offerings, nobody really can touch them,” said Ted Mortonson, technology desk sector strategist at Baird.
Chips like Google’s won’t replace Nvidia anytime soon. But increased adoption of ASICs, combined with more competition from AMD, could suggest companies are looking to reduce their reliance on Nvidia.
And Google won’t be the only AI chip competitor, said Barringer of Quilter Cheviot, and it’s doubtful it will achieve Nvidia’s dominance.
“I think it’s a part of a balance,” he said.