(Bloomberg) — US stocks advanced in thin trading after a technical outage at the Chicago Mercantile Exchange disrupted premarket activity. Bonds edged lower.
The S&P 500 rose 0.5% in a post-holiday shortened session and was back within spitting distance of all-time highs. Volume was more than 25% below the 30-day average as Friday trading closed at 1:00 p.m. Earlier, a data-center fault had affected multiple markets, with the issue lasting longer than a similar outage in 2019. The Nasdaq 100 rose 0.8% with Intel Corp. among its biggest gainers. Amazon.com Inc. shares gained 1.8% and Walmart Inc. hit a record on what’s traditionally one of the biggest US shopping days of the year.
Subscribe to the Stock Movers Podcast on Apple, Spotify and other Podcast Platforms.
Foreign-exchange markets, which had continued to traded throughout the day, saw no major volatility after the EBS platform reopened at 7:00 a.m.
“The spillover from the Thanksgiving holiday and the fact there is no US data may on the face of it lessen the impact,” said Daniel Noorian, head of execution and quantitative services at Liquidnet.
The CME halt was caused by a cooling system malfunction at a data center in the Chicago area, according to facility operator CyrusOne.
“Some market participants will take advantage of possible differences in prices,” said Guillermo Hernandez Sampere, head of trading at asset manager MPPM. “The majority will pause trading for risk reasons until the issues are resolved, otherwise losses are possible.”
For US stocks, expectations that the Federal Reserve will cut interest rates faster than initially anticipated fueled a late-month rebound.
The biggest weekly advance in five months capped off a choppy November after swollen technology stock valuations stirred up unease on Wall Street. The gain buoyed the broader barometer of US stocks as it notched a seven-month winning streak. But investors rotating away from artificial intelligence winners and into defensive sectors like health care led the tech-heavy Nasdaq 100 to log its first monthly loss since March.
The broader US stocks gauge had been down as much as 4.7% in November barely more than a week ago, as worries over stretched technology valuations rattled traders. Money markets were assigning roughly an 80% chance of a Fed cut in December before the CME disruption hit.
“For now, the data supports the soft landing, and that contributed to the continued equity rally ahead of Thanksgiving,” wrote Tom Essaye of the Sevens Report. “However, there remain a lot of economic unknowns right now and there are simmering risks that the economy is not as strong as investors believe given the lack of government data in recent months.”
Essaye said there could be risk-off money flows in December if upcoming data disappoint. Next week, statistics-starved investors will be watching for Challenger, Gray & Christmas job cuts and ADP’s private-payrolls reports as well as a reading of the Fed’s favored inflation gauge on Friday.
Moves across global equities were muted amid thin volumes. Europe’s Stoxx 600 edged up 0.2%, while an Asian gauge trimmed gains after a four-day rally. Yield on the 10-year Treasury rose to 4.02% while the dollar held steady.
In commodities, oil was on track for a fourth monthly decline as traders looked ahead to this weekend’s OPEC+ meeting and assessed how a possible Ukraine peace agreement might influence an already oversupplied market.
Gold traders faced a volatile session as the CME outage rippled through trading. The disruption affected activity across contracts including gold futures and Comex options, often used to hedge exposure to London prices. Spot bullion resumed a climb as trading was restored, advancing more than 1%.
What Bloomberg Strategists Say…
Gold’s main drivers — central-bank buying, Fed rate cuts, a weaker dollar, concerns about the US central bank’s independence, and a loyal crew of ETF holders — all remain in place. There’s also concern in the background about swelling debt burdens in several developed economies and, by extension, the standing of fiat currencies.
— Jake Lloyd-Smith Energy and Commodities Editor, Singapore
Some of the main moves in markets:
Stocks
The S&P 500 rose 0.5% as of 1 p.m. New York time The Nasdaq 100 rose 0.8% The Dow Jones Industrial Average rose 0.6% The MSCI World Index rose 0.5% Currencies
The Bloomberg Dollar Spot Index fell 0.1% The euro was little changed at $1.1602 The British pound was little changed at $1.3235 The Japanese yen was little changed at 156.23 per dollar Cryptocurrencies
Bitcoin fell 0.8% to $90,683.7 Ether rose 0.1% to $3,037.02 Bonds
The yield on 10-year Treasuries advanced three basis points to 4.02% Germany’s 10-year yield was little changed at 2.69% Britain’s 10-year yield declined one basis point to 4.44% Commodities
West Texas Intermediate crude rose 1.4% to $59.47 a barrel Spot gold rose 1.4% to $4,217.17 an ounce This story was produced with the assistance of Bloomberg Automation.on.
–With assistance from Subrat Patnaik, James Hirai, Sujata Rao, Macarena Muñoz and Christian Dass.
CME blamed the outage, which halted trading for more than 11 hours, on a cooling failure at a data centre in Chicago.
Global futures markets were thrown into chaos for several hours after CME Group, the world’s largest exchange operator, suffered one of its longest outages in years, halting trading across stocks, bonds, commodities and currencies.
By 13:35 GMT on Friday, trading in foreign exchange, stock and bond futures as well as other products had resumed, after having been knocked out for more than 11 hours because of an outage at an important data centre, according to LSEG data.
Recommended Stories
list of 4 itemsend of list
CME blamed the outage on a cooling failure at data centres run by CyrusOne, which said its Chicago-area facility had affected services for customers, including CME.
The disruption stopped trading in major currency pairs on CME’s EBS platform, as well as benchmark futures for West Texas Intermediate crude, Nasdaq 100, Nikkei, palm oil and gold, according to LSEG data.
‘A black eye’
Trading volumes have been thinned out this week by the United States Thanksgiving holiday, and with dealers looking to close positions for the end of the month, there was a risk of volatility picking up sharply later on, market participants said.
“It’s a black eye to the CME and probably an overdue reminder of the importance of market structure and how interconnected all these are,” Ben Laidler, head of equity strategy at Bradesco BBI, said.
“We complacently take for granted that much of the timing is frankly not great. It’s month-end, a lot of things get rebalanced.”
“Having said that, it could have been a lot worse; it’ll be a very low-volume day. If you’re going to have it, there would have been worse days to have a breakdown like this,” he said.
Futures are a mainstay of financial markets and are used by dealers, speculators and businesses wishing to hedge or hold positions in a wide range of underlying assets. Without these and other instruments, brokers were left flying blind, and many were reluctant to trade contracts with no live prices for hours on end.
“Beyond the immediate risk of traders being unable to close positions – and the potential costs that follow – the incident raises broader concerns about reliability,” said Axel Rudolph, senior technical analyst at trading platform IG.
A few European brokerages said earlier in the day they had been unable to offer trading in some products on certain futures contracts.
Regulators are tracking the situation, with both the Commodity Futures Trading Commission and Securities and Exchange Commission confirming they are aware of the issue and conducting ongoing surveillance.
Biggest exchange operator
CME is the biggest exchange operator by market value and says it offers the widest range of benchmark products, spanning rates, equities, metals, energy, cryptocurrencies and agriculture.
Average daily derivatives volume was 26.3 million contracts in October, CME said earlier this month.
The CME outage on Friday comes more than a decade after the operator had to shut electronic trading for some agricultural contracts in April 2014 due to technical problems, which at the time sent traders back onto the floor.
More recently, in 2024, outages at LSEG and Switzerland’s exchange operator briefly interrupted markets.
CME’s own shares were up 0.4 percent in premarket trading.
Simply sign up to the Investments myFT Digest — delivered directly to your inbox.
Shares in Sainsbury’s have been on a tear since mid April, but they gathered further momentum in November when management revealed interim underlying retail operating profit of £504mn, well ahead of its own expectations.
Three insiders at the grocer — Patrick Dunne, Rhian Bartlett, and Bláthnaid Bergin — recently derived material benefit from the run-up in the share price, having collectively offloaded £2.8mn worth of shares between November 14 and 18. Bergin, Sainsbury’s finance chief, continues to hold an interest in 466,134 shares after selling (via a closely associated person) roughly one-third of her holding at around 320p apiece.
The group, along with its high street counterparts, can expect a degree of support from investors who are nervous over current markets valuations and prospects over discretionary budgets in the wake of the autumn Budget. The degree to which the market will gravitate towards defensive stocks is difficult to gauge, especially given that we could witness slower growth rates compared with recent years.
Increased price sensitivity among consumers is already constraining discretionary household budgets, but short of another quarter point cut in interest rates, it’s conceivable that the market backdrop will become increasingly favourable for the more value-conscious German grocers.
Nonetheless, sentiment towards Sainsbury’s (at least among traders) was boosted by a positive technical signal midway through June, coupled with news that the grocer had achieved its highest market share in almost a decade. In addition, the forward rating of 3.4 times on an enterprise/cash profit basis compares favourably with both Marks and Spencer and Tesco. And the stock also comes with an implied forward dividend yield (ex-special) in advance of 6 per cent.
Roula Khalaf, Editor of the FT, selects her favourite stories in this weekly newsletter.
The writer is a former global head of equity capital markets at Bank of America and is now a managing director at Seda Experts.
It’s that time of year again: investment banks are announcing their latest slate of managing directors.
The ritual is as fraught as it is familiar. I still remember when my boss called me into his office 24 years ago to say I’d been promoted. It felt like a huge career breakthrough, but soon after the list of new MDs was published, a colleague warned me the bank would pay me less that year, knowing the title alone would keep me happy. I thought he was joking but it turned out that he was right.
Investment banks devote enormous resources each year to the MD promotion cycle. For anyone unfamiliar with investment banks, managing directors sit at the top of the hierarchy, above analysts, associates, vice-presidents, and directors. Outside the C-suite, it is the highest title at most firms, although a few banks have an additional tier of partners or senior MDs. So gaining the MD rank can be the defining moment in a banking career.
Yet it remains unclear whether the elaborate selection process — replete with committees, revenue trackers, 360-degree performance reviews, and senior leadership sign-off — leads to better decisions or simply creates the appearance of fairness.
At one level, the promotion process has impeccable rigour. A committee of senior MDs is convened, each assessing two or three candidates each. Candidates submit about 10 internal references, though committee members conduct their own checks. The committee factors in revenue scorecards, peer feedback and broader considerations such as regional representation, diversity, and coverage across different parts of the firm. The system is built to look unimpeachably meritocratic.
But anyone who has sat on these committees knows that politics and personalities inevitably intrude. Senior MDs quietly lobby for their protégés, and top leadership can override the committee’s recommendations. Last-minute decisions to promote office favourites occasionally happen.
Judging candidates is genuinely hard; comparing them is harder. How do you benchmark a Houston-based energy M&A banker against a German debt capital markets originator? Their skills, markets and revenue profiles bear almost no resemblance, and yet the system demands you rank them. One may make the cut, the other not.
The questions asked in the promotion committee highlight the salient issues. Is this person indispensable or replaceable? Do they have their own client franchise, or are they a supporting player to a rainmaker? How valuable is their “seat” at the bank? How likely are they to leave if passed over for promotion? These are perennial questions, and they also reveal how much of the process rests on finely balanced, ineradicably subjective judgments.
Across most big investment banks, only one-third to one-half of eligible directors make the jump to managing director in a given year. The title still carries weight, but at first the job barely changes. You don’t manage more people and the work looks much the same. After my own promotion, the only immediate difference was that I could put “managing director” on the pitch-book team page.
The real change is subtle and accrues over time. You gain the ability to say no without giving a long justification, the freedom to leave the office for a long lunch or a school play, and the authority to schedule calls around your own calendar instead of someone else’s. Those are valuable powers.
Later, compensation and influence begin to diverge. Some MDs build a franchise and flourish; others plateau and stagnate; a few crash and burn. The title just opens a door.
It’s easy to be cynical about the whole thing but one moment has stayed with me. A senior colleague and I video-called a banker based in a small Asian market to deliver happy promotion news. He was talented and hardworking, but operating in a place with limited revenue potential. So his MD prospects had always been on a knife-edge.
When he heard the decision, tears welled up in his eyes. He spoke with unfiltered joy about what promotion meant to him and his family — proof that his contributions were appreciated, that his work really mattered to his colleagues and clients, that he was respected by his peers.
That moment reminded me that, for all the processes and politics, MD promotion still taps into something deeply human: the need for recognition. For many, that validation matters as much as — and sometimes more than — money. The managing director title may bring baubles and benefits, but its true value lies in what it means to those who earn it.
Chronic respiratory diseases are major causes of global morbidity and mortality [,]. In 2019, chronic obstructive pulmonary disease (COPD), lung cancer, and lower respiratory infections ranked among the top 10 causes of disability-adjusted life-years for individuals older than 50 years []. Moreover, those with chronic respiratory diseases face additional challenges, including reduced quality of life and limited physical activity and exercise capacity [,].
Pulmonary rehabilitation offers a comprehensive approach to improving physical and psychological well-being in people with chronic respiratory disease, incorporating exercise, behavior change, and education []. It has been shown to effectively enhance exercise capacity, quality of life, dyspnea, and even survival rates, especially in patients with COPD [-]. Muscle wasting and dysfunction, affecting both skeletal and respiratory muscles, are also common in these patients, alongside reduced physical activity and respiratory function [,]. Pulmonary rehabilitation, which includes intensive exercise training and nutritional support, may be the most effective intervention for such conditions [].
Landmark studies have recommended pulmonary rehabilitation programs with exercise training sessions lasting 30-45 minutes per day, 3-5 days per week, for at least 8-12 weeks [,]. However, center-based programs often face barriers such as limited facilities, low awareness among health care providers, lack of patient motivation, minimal health insurance cost and social support, and transport challenges [-]. Moreover, it is also challenging for patients with chronic respiratory disease to maintain the rehabilitation programs in daily lives, as they did not receive sufficient instructions to continue their programs at home, resulting in insufficient participation and high dropout rates in center-based pulmonary rehabilitation [,,]. Consequently, alternatives to center-based rehabilitation are urgently needed [-]. The COVID-19 pandemic further accelerated the development of telerehabilitation alternatives to center-based pulmonary rehabilitation []. Thus, researchers have investigated the clinical efficacy of telerehabilitation compared with traditional face-to-face rehabilitation in individuals with COPD [-].
Although telerehabilitation has been proposed previously, it encompasses several different models, including video conferencing, mobile apps, webpages, and audio or video telephone calls []. Among telerehabilitation modalities, the clinical evidence for smartphone app–based pulmonary rehabilitation remains inconclusive []. While such interventions have been shown to improve quality of life and alleviate respiratory symptoms, their effect on enhancing exercise capacity has been limited [-]. Notably, significant improvements in exercise capacity have been observed only among users with high adherence []. However, recent studies suggest that app-based rehabilitation programs are effective not only in maintaining physical activity but also in improving exercise capacity, highlighting their potential for future implementation in clinical practice [,]. Furthermore, pilot studies have suggested the potential of reducing hospital readmissions after COPD exacerbations compared with standard care [].
In previous work, we reported positive outcomes in patients with chronic respiratory disease using a smartphone-based rehabilitation program in a single-arm prospective study []. In this study, we assessed the clinical efficacy of smartphone-based rehabilitation through a randomized controlled trial, with the study protocol being previously published []. Additionally, we conducted a feasibility trial (a single-arm prospective study) across 4 community primary health care clinics to evaluate whether an app-based rehabilitation program is feasible in primary health care facilities with limited medical resources. This study aimed to evaluate the clinical efficacy of smartphone app–based pulmonary rehabilitation programs in improving exercise capacity, quality of life, and respiratory symptoms in individuals with chronic respiratory diseases.
Methods
Study Design
This study adhered to the CONSORT statement () []. This single-center, single-blind randomized controlled trial was conducted at Asan Medical Center in Seoul, Republic of Korea. In 2023, a total of 90 participants were recruited from the pulmonology outpatient clinic and randomly assigned to the intervention or control group in a 2:1 ratio (60 in the intervention group and 30 in the control group). This 2:1 allocation strategy ensured that a larger number of participants were assigned to the intervention group, which helped maintain statistical power despite the potential for higher dropout rates in that group and allowed for more robust subgroup analyses. The initial plan was to include 81 participants (54 in the intervention group and 27 in the control group), based on an estimation for detecting significant improvement in maximal oxygen consumption (VO2 max) []; however, due to a higher-than-expected dropout rate, we ultimately enrolled 90 participants.
The intervention lasted 12 weeks. The intervention group underwent app-based rehabilitation for 12 weeks. They received one protein supplement drink (Himmune Protein Balance Drink, 10 g protein per 190 mL pack, Ildong Foodis, Seoul, Republic of Korea) daily throughout the study period, as adequate protein intake was required during the rehabilitation program []. The control group received standard outpatient medical treatment without rehabilitation. Participants were assessed at baseline and again at the end of the 12-week rehabilitation period.
A subsequent feasibility trial was conducted in 4 community primary health care clinics (Maseok Asan Clinic Internal Medicine, Seoul Comfort Medical Clinic, Good Breath Internal Medicine Clinic, and Seoul Eco Internal Medical Clinic). In 2023, 32 participants (different from the original randomized controlled trial participants) were recruited and underwent the 12-week app-based rehabilitation. They were assessed twice: at baseline and at the end of the program.
Inclusion and Exclusion Criteria
The inclusion criteria were as follows: (1) age of 20-80 years; (2) a dyspnea symptom score of ≥1 on the modified Medical Research Council (mMRC) dyspnea scale; and (3) a chronic respiratory disease, including (1) obstructive lung disease (such as asthma and COPD) with a forced expiratory volume in one second (FEV1) of <80% of the predicted value or FEV1/forced vital capacity (FVC) of <0.7, (2) bronchiectasis visible in more than one lung lobe on chest computed tomography, or (3) restrictive lung disease (such as tuberculous lung destruction or interstitial lung disease) with FVC or diffusing capacity for carbon monoxide (DLCO) of <80% of the predicted value [].
The exclusion criteria were (1) disease exacerbation within 4 weeks before enrolment, (2) disabilities, (3) inability to use smartphone apps or being an iPhone user, (4) pregnancy or breastfeeding, (5) deemed unsuitable for participation by the attending physician, and (6) refusal to consent.
Smartphone App and Rehabilitation Program
The SENIORS smartphone app (LifeSemantics Corp, Seoul, Republic of Korea) was developed through collaboration with health care professionals, service designers, and software developer. It was built for Android devices (requiring Android 8.0 or later).
The app included features such as exercise programs, exercise records, exercise partners, a 6-minute walk test, disease education specific to each respiratory disease, inhaler usage guidance, and a medication and health data diary. The pulmonary rehabilitation program consisted of 30 minutes of aerobic exercise (outdoor walking) and 20-30 minutes of limb and trunk muscle exercise. Smartphone sensors automatically track walking exercises without additional pedometers. The muscle exercise included warm-up stretching, a main exercise of varied muscle workouts with progressively increasing intensity (weekly), and cool-down stretching. Participants engaged in the rehabilitation program independently using the app, without intervention from the center site. The app displayed daily pop-up messages to encourage continued participation. Participants could earn incentives based on their exercise records (Figure S1 in ).
Study Outcome
The primary outcomes were VO2 max measured by cardiopulmonary exercise test [], and the COPD assessment test (CAT) []. Cardiopulmonary exercise test was conducted using an incremental protocol with a cycle ergometer (VIAsprint 150P; Carefusion) and a metabolic cart (Vmax 29; SensorMedics) []. To assess long-term rehabilitation effects, CAT scores for the intervention group were re-evaluated at 12 weeks post rehabilitation (24 weeks from baseline). The app was unavailable during the postrehabilitation period.
Secondary outcomes included daily physical activity measured by the International Physical Activity Questionnaire Short Form (IPAQ) Korean Version [], mMRC dyspnea scale, quality of life questionnaires, such as EQ-5D-5L [,] and the Health-related Quality of Life Instrument with 8 Items (HINT-8) questionnaire [], lung function (FVC, FEV1, and DLCO), hand grip strength, and limb muscle mass measured by bioelectrical impedance analysis.
The study outcomes were simplified in a feasibility study conducted in primary health care clinics. Primary outcomes were the 6-minute walk test distance and CAT [], and secondary outcomes included lung function (FVC and FEV1).
Cost-Utility Analysis
The main outcome indicators for the cost-utility analysis were the EQ-5D-5L and HINT-8 indexes, measured at baseline and the end of the intervention. Quality-adjusted life year (QALY) was calculated as the change in EQ-5D-5L or HINT-8 index from baseline to the end of the intervention for each participant []. Health care costs related to chronic respiratory diseases were gathered from invoices issued by Asan Medical Center, and outpatient drug costs were calculated based on prescription history. Based on the subscription costs of existing commercial applications, the app subscription fee in the intervention group was set at US $40 per month (approximately US $1=1400 Korean won as of November 2024), totaling US $120 for 3 months, with participant incentives deducted from this amount.
Statistical Analysis
Continuous variables were presented as medians with IQRs and compared using the Mann-Whitney U test (to compare the intervention and control groups at the same time point) or Wilcoxon signed-rank test (to compare baseline and follow-up within each group), as the number of participants was relatively small and most variables did not follow a normal distribution. A paired t test was conducted to evaluate the mean differences and corresponding CIs of normally distributed continuous variables (the CAT score and EQ-5D-5L index) before and after the intervention. Categorical variables were reported as numbers (percentages) and compared using the chi-square or Fisher exact test. All P values were 2-tailed, with statistical significance set at P<.05. All statistical analyses were conducted using SPSS (version 26.0; IBM SPSS Corp) and MedCalc Statistical Software (version 23.0.5; MedCalc Software Ltd).
Ethical Considerations
The study protocol was approved by the Institutional Review Board of Asan Medical Center (2022-1460) and the Public Institutional Review Board designated by the Ministry of Health and Welfare (P01-202303-01-013). This study adhered to the Declaration of Helsinki guidelines, and all procedures were conducted in compliance with relevant regulations. It was prospectively registered in the ClinicalTrials.gov database (NCT05610358). Written informed consent was obtained from all participants before inclusion. Participants were informed that their participation was voluntary and that they could withdraw from the study at any time without any disadvantage or penalty. All identifiable data were removed from the original dataset, and each participant was anonymized. Participants received small incentives (approximately US $30) based on their exercise records, which were obtained from the app’s log data for aerobic exercise timers and anaerobic exercise instruction videos. No identification of individual participants is possible in any images included in the manuscript or in Multimedia Appendices.
Results
Study Process and Baseline Characteristics
shows the study process. Among 102 screened for eligibility, 90 participants were recruited and allocated to the intervention (n=60) and control (n=30) groups. Thereafter, 14 participants withdrew consents, one encountered a smartphone error, and 3 failed baseline studies. Consequently, 72 participants completed baseline assessments. In the intervention group, 47 participants began rehabilitation, and 46 completed follow-ups (included in the intention-to-treat analysis). Three were later identified as having no app-use history in log data, so 43 were included in the per-protocol analysis. In the control group, 25 began follow-up, with 24 completing it. Overall, 77.8% (70/90) of participants completed follow-ups, and no musculoskeletal injuries or disease exacerbations related to the rehabilitation program were reported.
Figure 1. Study flowchart of a randomized controlled trial investigating the clinical efficacy of smartphone-based rehabilitation in individuals with chronic respiratory disease, conducted at Asan Medical Center, Seoul, Republic of Korea, 2023. ITT: intention to treat; PP: per protocol.
presents the baseline characteristics of 70 participants who completed follow-ups. The median age was 65.5 years (IQR 61.0-72.0), with 48 (68.6%) men. Forty-four (62.9%) participants had a smoking history, and approximately three-quarters (53/70, 75.7%) had obstructive lung disease as their chronic respiratory disease.
Table 1. Baseline characteristics of participants in a randomized controlled trial investigating the clinical efficacy of smartphone-based rehabilitation in individuals with chronic respiratory disease, conducted at Asan Medical Center, Seoul, Republic of Korea, 2023.
Total (n=70)
Intervention (n=46)
Control (n=24)
P value
U value
Age (years), median (IQR)
65.5 (61.0-72.0)
64.0 (60.0-68.0)
67.5 (62.5-74.5)
.14
434.00
Sex (male), n (%)
48 (68.6)
35 (76.1)
13 (54.2)
.06
N/Aa
Body weight (kg), median (IQR)
61.0 (54.0-71.4)
61.0 (54.0-71.8)
59.0 (53.0-70.2)
.34
483.50
Height (cm), median (IQR)
167.0 (160.0-172.0)
168.1 (161.0-172.0)
164.5 (157.0-168.0)
.04
383.00
BMI (kg/m2), median (IQR)
23.0 (20.0-25.4)
23.0 (19.8-25.3)
22.9 (20.8-25.6)
.89
541.00
Ever-smoker
44 (62.9)
32 (69.6)
12 (50.0)
.11
N/A
Respiratory disease, n (%)
.29
N/A
Obstructive
53 (75.7)
34 (73.9)
19 (79.2)
Bronchiectasis
14 (20.0)
11 (23.9)
3 (12.5)
Restrictive
3 (4.3)
1 (2.2)
2 (8.3)
Comorbidities, n (%)
Diabetes mellitus
9 (12.9)
5 (10.9)
4 (16.7)
.48
N/A
Hypertension
20 (28.6)
13 (28.3)
7 (29.2)
.94
N/A
Dyslipidemia
18 (25.7)
11 (23.9)
7 (29.2)
.64
N/A
Malignancy
6 (8.6)
2 (4.3)
4 (16.7)
.17
N/A
Lung resection
3 (4.3)
1 (2.2)
2 (8.3)
.27
N/A
aN/A: not applicable.
Clinical Parameters of Participants
In the per-protocol analysis, the baseline CAT score was higher in the intervention group than in the control group (median 16.0 vs 11.0, P=.08). At follow-up, the intervention group had a significantly lower CAT score than the control group (median 7.0 vs 10.0, P=.04). VO2 max did not significantly differ between groups at follow-up (median 14.0 vs 12.7 mL/kg/min, P=.24). The intervention group also showed significant improvements in the IPAQ score (median 1488.0 vs 1164.0, P=.04) and mMRC dyspnea scale (median 1.0 vs 2.0, P=.01) compared with the control group at follow-up (). In the intention-to-treat analysis, only the mMRC dyspnea scale showed a significant difference at follow-up, with no significant changes in the CAT score and IPAQ (Table S1 in ).
Comparing clinical outcomes between baseline and follow-up in the intervention group, CAT score, IPAQ, mMRC dyspnea scale, EQ-5D-5L index, and HINT-8 index showed significant improvements, while these parameters, except for IPAQ, did not improve in the control group ( and Table S2 in ). In the intervention group, the CAT score showed a significant improvement from baseline to post-intervention (mean difference=–6.14, 95% CI –8.19 to –4.09, P<.001, t42=–6.051), exceeding the minimal important clinical difference of 2 points []. The EQ-5D-5L index demonstrated a meaningful increase (mean difference=0.073, 95% CI 0.042-0.103, P<.001, t42=4.814), surpassing the minimal important clinical difference for COPD (0.028) []. To assess long-term rehabilitation effects, the CAT score in the intervention group remained stable 12 weeks post-rehabilitation, showing no significant difference from the score at the end of rehabilitation (median 7.0 vs 8.0, P=.77, Figure S2 in ).
Table 2. Comparison of clinical outcomes of participants between the intervention and control group (per protocol analysis) in a randomized controlled trial investigating the clinical efficacy of smartphone-based rehabilitation in individuals with chronic respiratory disease, conducted at Asan Medical Center, Seoul, Republic of Korea, 2023.
Total (n=67), median (IQR)
Intervention (n=43), median (IQR)
Control (n=24)
P value
U value
Baseline
VO2 maxa (mL/kg/min, n=65)
15.3 (11.5-18.3)
15.7 (12.7-19.2)
13.4 (9.0-16.1)
.06
339.50
CATb score
14.0 (8.0-19.0)
16.0 (9.5-20.0)
11.0 (7.5-17.0)
.08
380.50
IPAQc (n=65)
693.0 (23.1-1535.3)
792.0 (26.0-1737.8)
445.5 (11.6-1188.0)
.23
386.50
mMRCd dyspnea scale
1.0 (1.0-2.0)
1.0 (1.0-2.0)
2.0 (1.0-2.0)
.53
472.50
EQ-5D-5L index
0.816 (0.752-0.862)
0.816 (0.743-0.861)
0.822 (0.777-1.000)
.41
453.50
HINT-8e index
0.804 (0.750-0.862)
0.792 (0.735-0.859)
0.811 (0.784-0.863)
.16
409.00
FEV1f (%predicted)
51.0 (42.5-65.8)
57.0 (44.3-66.8)
49.0 (38.5-56.0)
.11
394.00
FVCg (%predicted)
73.0 (66.3-87.5)
75.0 (66.3-87.5)
72.0 (64.0-86.0)
.39
450.00
DLCOh (%predicted)
58.0 (45.0-67.0)
61.0 (53.5-67.0)
50.0 (45.0-65.0)
.30
436.00
Hand grip strength (kg)
32.0 (25.7-39.2)
33.7 (28.0-41.0)
27.9 (21.5-37.1)
.12
397.50
Limb muscle mass (kg)
Upper limb
4.8 (3.5-5.7)
5.0 (3.9-6.0)
4.3 (3.3-5.5)
.06
371.00
Lower limb
15.0 (12.4-16.8)
15.6 (13.1-17.0)
14.5 (10.8-15.6)
.05
365.50
Follow-up
VO2 max (mL/kg/min, n=65)
12.9 (11.0-16.1)
14.0 (10.6-18.4)
12.7 (11.3-13.7)
.24
389.00
CAT score
8.0 (5.0-16.8)
7.0 (4.0-15.0)
10.0 (6.5-18.5)
.04
358.50
IPAQ (n=62)
1386.0 (876.0-2772.0)
1488.0 (1250.3-3027.8)
1164.0 (618.8-2205.0)
.04
290.50
mMRC dyspnea scale
1.0 (1.0-2.0)
1.0 (1.0-1.8)
2.0 (1.0-2.0)
.01
346.50
EQ-5D-5L index
0.862 (0.786-1.000)
0.871 (0.814-1.000)
0.829 (0.768-1.000)
.22
425.50
HINT-8 index
0.821 (0.751-0.876)
0.828 (0.767-0.891)
0.795 (0.728-0.848)
.09
385.50
FEV1 (%predicted)
50.0 (40.5-67.8)
58.0 (43.5-69.0)
45.0 (37.5-54.5)
.06
372.00
FVC (%predicted)
73.0 (67.3-87.5)
77.0 (69.3-87.5)
71.5 (63.0-86.0)
.22
422.50
DLCO (%predicted, n=66)
61.0 (49.0-71.0)
62.0 (51.0-71.8)
57.0 (48.0-64.8)
.20
400.00
Hand grip strength (kg)
32.7 (22.7-39.5)
33.3 (27.7-41.7)
24.0 (20.6-37.0)
.08
380.00
Limb muscle mass (kg)
Upper limb
4.6 (3.6-5.9)
4.8 (3.8-6.1)
4.3 (3.5-5.5)
.17
411.50
Lower limb
15.0 (12.2-16.8)
15.4 (13.0-16.9)
14.4 (10.8-16.0)
.08
381.00
aVO2 max: maximal oxygen consumption. It was measured using a cardiopulmonary exercise test.
cIPAQ: International Physical Activity Questionnaire.
dmMRC: modified Medical Research Council.
eHINT-8: Health-related Quality of Life Instrument with 8 Items.
fFEV1: forced expiratory volume in one second.
gFVC: forced vital capacity.
hDLCO: diffusing capacity for carbon monoxide.
Table 3. Comparison of clinical outcomes of participants between the baseline and follow-up (per protocol analysis) in a randomized controlled trial investigating the clinical efficacy of smartphone-based rehabilitation in individuals with chronic respiratory disease, conducted at Asan Medical Center, Seoul, Republic of Korea, 2023.
Baseline, median (IQR)
Follow-up, median (IQR)
P value
Intervention (n=43)
VO2 maxa (mL/kg/min)
15.7 (12.7-19.2)
14.0 (10.6-18.4)
.04
CATb score
16.0 (9.5-20.0)
7.0 (4.0-15.0)
<.001
IPAQc (n=41)
792.0 (23.1-1649.3)
1488.0 (1250.3-3027.8)
<.001
mMRCd dyspnea scale
1.0 (1.0-2.0)
1.0 (1.0-1.8)
.006
EQ-5D-5L index
0.816 (0.743-0.861)
0.871 (0.814-1.000)
<.001
HINT-8e index
0.792 (0.735-0.859)
0.828 (0.767-0.891)
<.001
FEV1f (%predicted)
57.0 (44.3-66.8)
58.0 (43.5-69.0)
.27
FVCg (%predicted)
75.0 (66.3-87.5)
77.0 (69.3-87.5)
.04
DLCOh (%predicted)
61.0 (53.5-67.0)
62.0 (51.0-71.8)
.08
Hand grip strength (kg)
33.7 (28.0-41.0)
33.3 (27.7-41.7)
.74
Limb muscle mass (kg)
Upper limb
5.0 (3.9-6.0)
4.8 (3.8-6.1)
.47
Lower limb
15.6 (13.1-17.0)
15.4 (13.0-16.9)
.56
Control (n=24)
VO2 max (mL/kg/min, n=22)
13.4 (9.0-16.1)
12.7 (11.3-13.7)
.45
CAT score
11.0 (7.5-17.0)
10.0 (6.5-18.5)
.78
IPAQ (n=21)
198.0 (11.6-1237.5)
1164.0 (618.8-2205.0)
.005
mMRC dyspnea scale
2.0 (1.0-2.0)
2.0 (1.0-2.0)
.74
EQ-5D-5L index
0.822 (0.777-1.000)
0.829 (0.768-1.000)
.26
HINT-8 index
0.811 (0.784-0.863)
0.795 (0.728-0.848)
.08
FEV1 (%predicted)
49.0 (38.5-56.0)
45.0 (37.5-54.5)
.46
FVC (%predicted)
72.0 (64.0-86.0)
71.5 (63.0-86.0)
.78
DLCO (%predicted, n=23)
50.0 (45.0-65.0)
57.0 (48.0-64.8)
.17
Hand grip strength (kg)
27.9 (21.5-37.1)
24.0 (20.6-37.0)
.29
Limb muscle mass (kg)
Upper limb
4.3 (3.3-5.5)
4.3 (3.5-5.5)
.12
Lower limb
14.5 (10.8-15.6)
14.4 (10.8-16.0)
.67
aVO2 max: maximal oxygen consumption. It was measured using a cardiopulmonary exercise test.
cIPAQ: International Physical Activity Questionnaire.
dmMRC: modified Medical Research Council.
eHINT-8: Health-related Quality of Life Instrument with 8 Items.
fFEV1: forced expiratory volume in one second.
gFVC: forced vital capacity.
hDLCO: diffusing capacity for carbon monoxide.
The IPAQ questionnaire was administered during the cardiopulmonary exercise test, so these values were missing for the 2 participants with severely impaired lung function. Although some missing data (IPAQ and DLCO) were observed at the follow-up time point, the Little’s Missing Completely At Random test indicated that these data were missing completely at random (P=.12).
Comparison of Clinical Parameters Among Subgroup Participants
Defining physically active participants as those with an IPAQ score of >1000 at baseline, 19 participants in the intervention group were classified as physically active. At follow-up, their VO2 max (median 14.3 vs 12.7 mL/kg/min, P=.05) and IPAQ (median 2779.0 vs 1164.0, P=.009) were significantly higher than those of the participants in the control group. Their CAT score (median 5.0 vs 10.0, P=.005) and mMRC dyspnea scale (median 1.0 vs 2.0, P=.03) were also significantly lower than those of the participants in the control group. Comparing baseline and follow-up data, physically active participants in the intervention group showed significant improvements in the CAT score, EQ-5D-5L index, and HINT-8 index (Tables S3 and S4 in , ).
Figure 2. Subgroup analysis: comparison of primary outcomes between participants in the intervention group (initially active, International Physical Activity Questionnaire > 1000) and the control group in a randomized controlled trial investigating the clinical efficacy of smartphone-based rehabilitation in individuals with chronic respiratory disease, conducted at Asan Medical Center, Seoul, Republic of Korea, 2023. Data are shown for (A) maximal oxygen consumption and (B) CAT score. CAT: chronic obstructive pulmonary disease assessment test; VO2 max: maximal oxygen consumption.
Defining good compliance as completing > 50% of the assigned exercise program, 17 participants in the intervention group were classified as compliant. At baseline, their CAT scores were significantly higher than those of the participants in the control group. At follow-up, their CAT score did not significantly differ from that of the control group, but their IPAQ was significantly higher. Comparing baseline and follow-up data, compliant participants in the intervention group showed significant improvements in CAT score, EQ-5D-5L index, and HINT-8 index after the intervention (Tables S5 and S6 in ).
Ease of Use of the App
Among the user questionnaire of 43 participants who completed the rehabilitation program, approximately 80% (35/43) of participants in the intervention group found the app easy to use. More than 60% (27/43) felt it helped improve dyspnea symptoms. Additionally, 79.1% (34/43) expressed interest in using the app commercially, with 44.1% (15/34) noting that the exercise program tailored to their condition was its most attractive feature (Table S7 in ).
Cost-Utility Analysis
The mean hospital costs were US $300 for the control and US $250 for the intervention group. Outpatient drug costs averaged US $195 and US $189, respectively, while the app subscription fee averaged US $84 after incentive reductions. The mean total health care costs, including hospital, drug, and app fees, were US $495 in the control and US $523 in the intervention group. The QALY distribution using the EQ-5D-5L index was 0.208 for both groups, and using the HINT-8 index, it was 0.199 in the control and 0.201 in the intervention group ().
Figure 3. Cost-utility analysis: distribution of total health care costs and quality-of-life utility between the intervention and control groups in a randomized controlled trial investigating the clinical efficacy of smartphone-based rehabilitation in individuals with chronic respiratory disease, conducted at Asan Medical Center, Seoul, Republic of Korea, 2023. Data are shown for (A) Euro-QoL 5-Dimension 5-Level index and (B) HINT-8 index. eQALY: the quality-adjusted life year calculated using the EQ-5D-5L; hQALY, the quality-adjusted life year calculated using the HINT-8 index.
Feasibility Trial in Primary Health Care Clinics
Subsequently, a feasibility trial was performed in primary health care clinics. Among 32 participants initially recruited, 24 completed follow-up visits (Table S8 in ). The median age was 62.5 years (IQR 57.0-69.0), with 58.3% (14/24) being men and 54.2% (13/24) having a smoking history (Table S9 in ). Comparing baseline to follow-up data, the CAT score significantly improved post rehabilitation (median 8.5 to 5.0, P<.001, Table S10 in ). No musculoskeletal injuries or disease exacerbations related to the rehabilitation program were reported.
Discussion
Principal Findings
This study examined the clinical efficacy of a smartphone-based pulmonary rehabilitation program for patients with chronic respiratory diseases. It showed that the program improved the quality of life, daily physical activity, and dyspnea symptoms. Significant improvements were particularly notable in participants who were physically active or compliant with the exercise regimen, and positive outcomes were also observed in primary health care clinics. These findings suggest that smartphone-based pulmonary rehabilitation could be a valuable treatment option for older patients with chronic respiratory diseases.
Improvements in Study Outcomes
This program was associated with a significant improvement in the CAT score, which predicts the severity of airflow obstruction and disease exacerbation in patients with COPD [,]. The CAT score also correlates with lung function, 6-minute walk distance, and exertional desaturation in idiopathic pulmonary fibrosis and connective tissue disease-associated interstitial lung disease [,]. CAT also correlated with disease severity, lung function, and 6-minute walk distance in patients with bronchiectasis, making it a valid tool for this condition []. Although we included patients with a broad spectrum of chronic respiratory diseases, CAT score improvements may broadly predict clinical benefits. Notably, CAT scores in the intervention group remained stable 12 weeks post-rehabilitation, further supporting the program’s efficacy.
Daily physical activity is crucial for patients with chronic respiratory disease, as low activity levels are linked to higher risks of acute exacerbation and mortality in COPD []. Patients with COPD generally have significantly reduced physical activity compared with healthy controls, though disease severity is not strongly correlated with activity levels []. Thus, even patients with severe COPD who stay active can reduce their exacerbation and mortality risks. This study found that physical activity improved through app-based pulmonary rehabilitation in older adults with chronic respiratory disease. Additionally, subgroup analysis showed marked clinical improvements in initially active participants, highlighting the importance of physical activity. Further studies with longer follow-ups could reveal reduced exacerbation and mortality rates from app-based rehabilitation.
Compliance With Rehabilitation Programs
As reported, compliance with home-based pulmonary rehabilitation remains a challenge []. In app-based rehabilitation, CAT scores were estimated to decrease by −0.22 (95% CI −0.74 to 0.31) per additional 7 days of app use []. However, while app use dropped from 85% in week one to 40% in the last week, active users maintained a consistent weekly usage of 4.9 days []. A previous study reported lack of motivation as the most common reason for nonadherence in home-based pulmonary rehabilitation, with non-adherent patients with COPD experiencing more exacerbations and reduced 6-minute walk distances []. In this study, 39.5% (17 of 43) of participants showed good compliance (completing >50% of assigned exercises) and demonstrated significant improvements in CAT scores and IPAQ. Thus, physicians should emphasize steady engagement with the app-based pulmonary rehabilitation program. The initial stage of pulmonary rehabilitation involves educating patients on how following an appropriate exercise program can improve their symptoms. Additionally, regular phone calls or text messages from health care providers can boost patient motivation []. Repeated exposure to exercise programs encourages app use and motivates patients to stay active.
Cost-Utility Analysis
In the cost-utility analysis, the mean health care costs were US $495 in the control group and US $523 in the intervention group. After reducing the app subscription fee (mean US $84 with incentive reductions), intervention group costs were US $439, notably lower than the control group. However, since the subscription fee was based on similar commercialized apps, it may be adjustable for future commercialization. While there was some cost difference between groups, QALYs based on EQ-5D-5L and HINT-8 indices were similar, limiting further cost-utility analysis. Previous cost-utility analyses have demonstrated that home-based pulmonary rehabilitation and tele-rehabilitation are more cost-effective compared with hospital-based pulmonary rehabilitation [,]. However, further studies are needed to evaluate the cost-effectiveness of these programs within the Korean health care context.
Feasibility in Primary Clinics
Pulmonary rehabilitation is typically provided in referral hospitals; however, primary care practitioners face barriers in referring patients with chronic respiratory diseases, including limited engagement from rehabilitation providers, patient’s poor physical ability or accessibility, low motivation, and unclear referral practices []. To address these issues, previous studies have delivered rehabilitation programs in primary care settings, reporting favorable outcomes in exercise capacity, quality of life, and dyspnea symptoms [,]. Our feasibility trial, conducted in a real-world setting, involved app-guided rehabilitation without provider education or guidance. Despite these limitations, we observed improvements in the CAT score and mMRC dyspnea scale, supporting the feasibility of app-based pulmonary rehabilitation in primary care, where center-based programs are generally unavailable.
At an Australian referral center, the referral rate for pulmonary rehabilitation from primary care clinics was notably low—only 6% []. This likely reflects limited awareness and understanding of pulmonary rehabilitation among both patients and health care providers in primary care settings []. Considering the challenges many patients face in attending regular sessions at tertiary hospitals, as well as the impracticality of tertiary centers accommodating all eligible patients, there is a clear need to implement home-based rehabilitation programs. Using tools such as smartphone apps could enable continuous management of patients within primary care settings.
Strengths, Limitations, and Future Perspectives
This study has several notable strengths with innovative contributions to the field of digital pulmonary rehabilitation. First, unlike earlier mobile health interventions that targeted single diseases such as COPD or relied on simple video-based exercise guidance, the app offered integrated multidimensional components, incorporating exercise programs, disease education, medication management, social support, and a health data diary, in a single smartphone platform. Particularly, exercise levels could be adjusted according to exercise performance records. The app included social support features that allowed users to see their ranking by comparing their exercise records with those of other users, as well as send and receive encouraging messages with one another. Second, the program was validated not only in a tertiary hospital setting but also through a feasibility trial in primary care clinics, highlighting its scalability and adaptability for community-level implementation. Third, it was quite a novel trial to incorporate an administrator web system that enabled clinicians to monitor adherence and performance data in real time, facilitating a feedback loop between patients and health care providers. It demonstrated the potential of the app as a foundation for a medical information-sharing platform to support patient referrals and transfers. Fourth, this was the first cost-utility analysis of smartphone-based pulmonary rehabilitation conducted in Korea, which may provide health economic evidence to support potential coverage under the National Health Insurance system. Clinically, this integrated digital rehabilitation model can complement or substitute traditional center-based rehabilitation, expanding access for older adults and patients with limited mobility. Together, these innovations demonstrate a practical and evidence-based framework for integrating smartphone-based pulmonary rehabilitation into routine clinical and public health practice.
This study has several limitations. First, while participants showed significant improvements in physical activity according to the IPAQ questionnaire, their correlations to objective measurements are limited [,]. Participants’ follow-up VO2 max was also lower than that at baseline. Many follow-up tests occurred during a particularly hot summer, which limited participants’ maximal exercise capacity during cardiopulmonary tests, especially as they had outpatient visits scheduled immediately afterward. Additionally, some participants, having experienced fatigue during the baseline test, did not reach their maximal exercise capacity at follow-up. In the control group, 2 participants underwent the 6-minute walk test instead of the cardiopulmonary exercise test due to severely impaired lung function, in accordance with the study protocol. The IPAQ questionnaire was administered during the cardiopulmonary exercise test, so these values were missing for those 2 participants. Although some missing data (IPAQ and DLCO) were observed at the follow-up time point, the Little’s test indicated that these data were missing at random. During the feasibility trial, we also noted that participants’ 6-minute walk distance increased by only 5 m after the rehabilitation. Future studies should develop a more refined exercise test protocol to address these challenges. Second, this study did not show statistically significant improvement in the EQ-5D-5L and HINT-8 indices. Studies with larger samples may reveal quality-of-life improvements for patients with chronic respiratory diseases. Third, this study found no improvement in hand grip strength or limb muscle mass in the intervention group, despite providing muscle exercises and nutritional supplements. Although we provided protein supplements of 10 g/day, this amount was far below the recommended daily protein intake for adults of 0.8-1.2 g/kg, so we believe the observed benefits were mainly driven by the app design itself. Future research should consider more tailored exercise programs and nutritional support to enhance physical parameters. Finally, due to several practical constraints, we were unable to set the control group as traditional face-to-face (center-based) pulmonary rehabilitation, which warrants caution when interpreting the findings of this study.
Conclusions
In the randomized controlled trial, the smartphone-based pulmonary rehabilitation program improved clinical outcomes, including quality of life, physical activity, and dyspnea, in patients with chronic respiratory diseases. Although physically active and program-compliant participants showed significant clinical improvements, the fact that fewer than half of the participants demonstrated good compliance highlights the need for more robust strategies to enhance adherence in future programs. Additionally, while our feasibility trial demonstrated the potential for rehabilitation programs for older adults with chronic respiratory diseases to be implemented in primary health care settings, further research and development will be necessary to achieve this in practice.
This research was supported by a grant from the Korea Health Promotion R&D Project, funded by the Ministry of Health & Welfare, Republic of Korea (HS21C0096), a National Research Foundation of Korea (NRF) grant funded by the Korean government (MSIT; RS-2023-NR077159), the Bio&Medical Technology Development Program of the NRF funded by the MSIT (RS-2022-NR067421 and RS-2023-00222687), and the National Institute of Health research project (2024ER080601). The funder had no involvement in the study design, data collection, analysis, interpretation, or the writing of the manuscript.
The datasets used and analyzed during the current study are available from the corresponding author upon reasonable request.
CC, A-RK, D-YK, SK, JO, HJK, BP, SHL, DK, HK, M-WJ, and SWL contributed to the planning of the study. SWL secured the funding for the study. CC, A-RK, D-YK, SK, DK, HK, SHL, M-WJ, and SWL conceived and designed the study. CC, M-WJ, and SWL collected the data and conducted data analysis. CC, M-WJ, and SWL interpreted the data and drafted the manuscript. All authors revised and approved the final version of the manuscript, and all take responsibility for its accuracy. Generative artificial intelligence was not used in any portion of the manuscript writing.
None declared.
Edited by S Brini, A Mavragani; submitted 30.Apr.2025; peer-reviewed by P O’Halloran, YC Liu; comments to author 03.Sep.2025; revised version received 19.Oct.2025; accepted 19.Oct.2025; published 28.Nov.2025.
This is an open-access article distributed under the terms of the Creative Commons Attribution License (https://creativecommons.org/licenses/by/4.0/), which permits unrestricted use, distribution, and reproduction in any medium, provided the original work, first published in the Journal of Medical Internet Research (ISSN 1438-8871), is properly cited. The complete bibliographic information, a link to the original publication on https://www.jmir.org/, as well as this copyright and license information must be included.
Item 1 of 2 The logo of the Adani Group is seen on the facade of its Corporate House on the outskirts of Ahmedabad, India, November 21, 2024. REUTERS/Amit Dave
[1/2]The logo of the Adani Group is seen on the facade of its Corporate House on the outskirts of Ahmedabad, India, November 21, 2024. REUTERS/Amit Dave Purchase Licensing Rights, opens new tab
Nov 28 (Reuters) – India’s Adani Group plans to invest up to $5 billion in Alphabet-owned Google’s (GOOGL.O), opens new tab India AI data centre project, an executive said on Friday, as it seeks to cash in on booming demand for data capacity in the world’s most populous nation.
In October, Google said it would invest $15 billion over five years to set up an artificial intelligence data centre in the southern state of Andhra Pradesh, its biggest investment in India.
Sign up here.
AI requires enormous computing power, pushing demand for specialised data centres that enable thousands of chips to be linked in clusters.
Adani Group CFO Jugeshinder Singh said the Google project could mean an investment of up to $5 billion for Adani Connex – a joint venture between Adani Enterprises (ADEL.NS), opens new tab and private data centre operator EdgeConneX.
“It’s not just Google, there are a lot of parties that would like to work with us, especially when the data centre capacity goes to gigawatt and higher,” Singh told reporters on Friday.
Google has committed to spending about $85 billion this year to expand data centre capacity as tech companies invest heavily in infrastructure to meet the booming demand for AI services.
Indian billionaires Gautam Adani and Mukesh Ambani have also unveiled investments in building data centre capacity.
The data centre campus in the port city of Visakhapatnam will have an initial power capacity of 1 gigawatt.
($1 = 89.3660 Indian rupees)
Reporting by Harshita Meenaktshi and Dhwani Pandya; Editing by Kevin Liffey
Our Standards: The Thomson Reuters Trust Principles., opens new tab
(Reuters) -India’s Adani Group plans to invest up to $5 billion in Alphabet-owned Google’s India AI data centre project, an executive said on Friday, as it seeks to cash in on booming demand for data capacity in the world’s most populous nation.
In October, Google said it would invest $15 billion over five years to set up an artificial intelligence data centre in the southern state of Andhra Pradesh, its biggest investment in India.
AI requires enormous computing power, pushing demand for specialised data centres that enable thousands of chips to be linked in clusters.
Adani Group CFO Jugeshinder Singh said the Google project could mean an investment of up to $5 billion for Adani Connex – a joint venture between Adani Enterprises and private data centre operator EdgeConneX.
“It’s not just Google, there are a lot of parties that would like to work with us, especially when the data centre capacity goes to gigawatt and higher,” Singh told reporters on Friday.
Google has committed to spending about $85 billion this year to expand data centre capacity as tech companies invest heavily in infrastructure to meet the booming demand for AI services.
Indian billionaires Gautam Adani and Mukesh Ambani have also unveiled investments in building data centre capacity.
The data centre campus in the port city of Visakhapatnam will have an initial power capacity of 1 gigawatt.
($1 = 89.3660 Indian rupees)
(Reporting by Harshita Meenaktshi and Dhwani Pandya; Editing by Kevin Liffey)
Abu Dhabi’s TII and Honeywell are collaborating to develop quantum-secure satellite communication systems using quantum key distribution technology.
The partnership integrates Honeywell’s QKDSat platform with TII’s Abu Dhabi Quantum Optical Ground Station to test end-to-end satellite-to-ground QKD links.
The initiative aims to build global quantum-resilient networks for government, security, and commercial use as traditional encryption faces quantum threats.
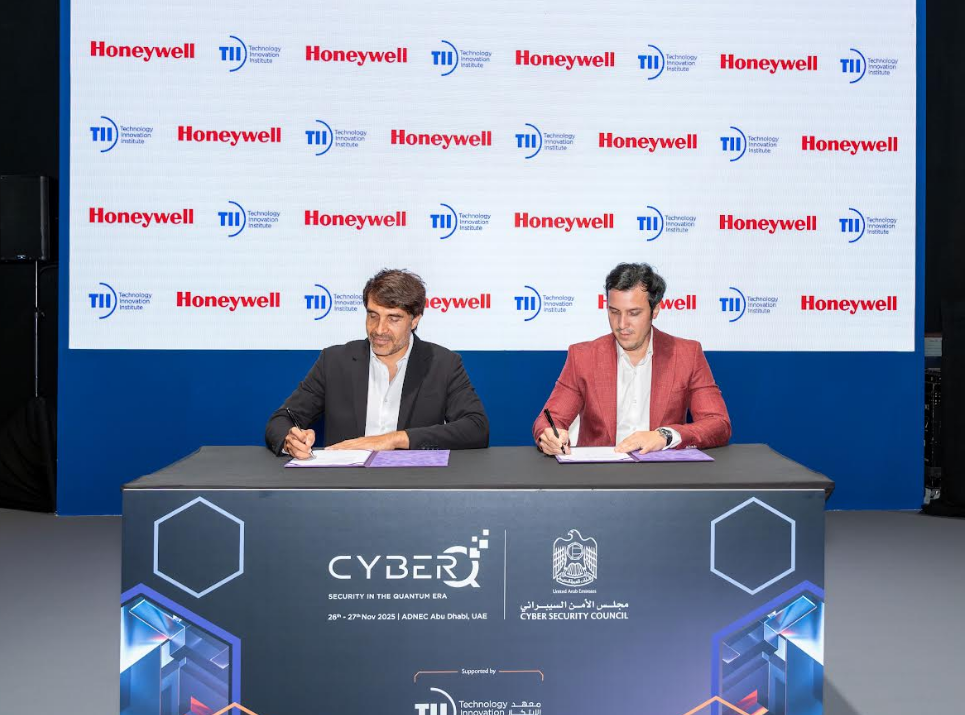
PRESS RELEASE — The Technology Innovation Institute (TII), the applied research arm of Abu Dhabi’s Advanced Technology Research Council (ATRC), and Honeywell have launched a joint initiative to develop quantum-secure satellite communication systems designed to protect sensitive information across global networks.
As quantum computing capabilities continue to evolve, traditional encryption methods are coming under increasing pressure. Quantum key distribution (QKD) offers a future-proof solution by using the quantum properties of light to generate encryption keys that are inherently immune to interception and secure against emerging computing threats.
Under this collaboration, Honeywell’s ‘QKDSat’ platform will be integrated with TII’s ground-based infrastructure – the Abu Dhabi Quantum Optical Ground Station (ADQOGS) – to establish and test end-to-end QKD links between satellites and terrestrial quantum networks. The initiative represents a key step toward building quantum-resilient communication infrastructure capable of safeguarding critical data for government, security, and commercial applications.
Dr. Najwa Aaraj, CEO of TII,said: “This collaboration is a significant step toward building global quantum-secure networks in the UAE and beyond. It brings together Honeywell’s track record in aerospace innovation and TII’s expertise in quantum technologies to address one of the most pressing challenges of the digital era: how we protect our most critical information in a quantum-powered future.”
Quantum-resilient infrastructure said: “Turning quantum science into operational capability requires proven space engineering. Honeywell’s heritage in secure satellite systems allows us to take these concepts from laboratory testing to real-world missions. Teaming up with TII ensures that together we’re advancing technologies that can deliver trusted, quantum-secure communications on a global scale.”
Developed and operated by TII, ADQOGS is a versatile optical ground station designed to support a range of satellite-based quantum communication experiments – methods used to encode information onto particles of light so they can transmit encryption keys securely between space and Earth. Its integration with Honeywell’s QKDSat platform will allow experts to test and validate quantum-backed encryption methods under realistic satellite operating conditions, demonstrating long-distance QKD links and overcoming the distance limitations of fiber-based quantum networks – opening the door to truly global quantum communication that is not constrained by terrestrial infrastructure.
The collaboration underscores both organizations’ commitment to developing trusted, quantum-secure communication systems, and highlights Abu Dhabi’s growing role in shaping the future of global cybersecurity innovation.
For more information about ADQOGS, visit https://www.tii.ae/publications/adqogs-versatile-optical-ground-station-satellite-based-quantum-key-distribution.
For more information about QKDSat, visit https://aerospace.honeywell.com/us/en/products-and-services/product/services/quantum