Japan’s economy contracted by a smaller-than-expected 0.4% in the quarter ended September compared to the previous three months, helped by both private and government consumption.
Economists polled by Reuters had expected a 0.6% decline.
On an annualized basis, Japan’s GDP for the third quarter of 2025 fell 1.8%, a softer decline compared with estimates of a 2.5% contraction.
Exports of goods and services shrank 1.2% compared to the second quarter when they had risen by 2.3%. Net exports contributed to a 0.2 percentage point drop in GDP.
Japan’s shipments had seen contractions for four straight months since May as U.S. tariffs hurt exports, although September saw a rebound to growth. Tokyo in July clinched a trade deal with Washington, bringing down tariffs on its exports to the U.S. to 15% from 25%. The 15% tariffs took effect on Aug. 7.
Domestic consumption helped slow the economic contraction, with government and private consumption up 0.5% and 0.1%, respectively, compared to the second quarter.
Private demand proved to be the largest drag on GDP this quarter, declining 0.4% compared to the quarter before and pulling the economy down by 0.3 percentage point owed to a sharp plunge in residential investment, down 9.4%.
Public demand was a bright spot, growing 0.5% quarter on quarter and contributing 0.1 percentage point to the Japanese economy.
This is breaking news, please check back for updates.
TOKYO (Reuters) -When 22-year-old Hinako Mori moved to Tokyo last year, she chose to work part-time at Don Quijote, a major discount retailer, for one main reason – it doesn’t care what colour her hair is.
Sporting ash blonde locks with light and dark blue streaks when interviewed, Mori likes to dye her hair different colours every six weeks.
It was very different when she worked at a major Japanese convenience store chain that mandated black or dark brown hair.
“One time, I dared to dye my hair blonde. But the next day, I was told to either wear a wig or use spray-on colour,” said Mori. “It was very stressful.”
RETAILERS RELAX RULES
Squeezed by Japan’s tight labour market, more companies are this year following in the footsteps of Don Quijote, a Pan Pacific International group company. It relaxed its rules around hair and nail polish three years ago and says nearly a quarter of its employees now have brightly coloured hair. When brown is included, 55% of its employees have non-black hair.
Drugstore chain Fuji Yakuhin, for example, has done away with a plethora of rules for non-pharmacist employees. It now allows any hair colour, nail art, heavy makeup, as well as all kinds of rings, whereas previously only wedding rings were permitted. Similarly, the operator of Tokyu Store supermarkets has dialled back restrictions on hair colours, hair styles, accessories, nail polish and piercings.
Japan Inc has been gradually relaxing its dress codes over the past two decades. The catalyst was a 2005 Ministry of Environment “Cool Biz” campaign that encouraged the ditching of jackets and ties to cut down on air conditioning costs during summer.
Since then, summer dress codes have become more casual, uniforms are no longer mandated for many department store employees and white gloves for taxi drivers were made optional.
The newest changes around hair colour, nail polish and accessories are predominantly taking place at smaller companies facing more acute labour shortages than bigger firms and don’t have as much leeway to offer competitive wages.
But some big listed firms have relaxed dress codes this year. Japan Airlines last week joined subway operator Tokyo Metro and domestic budget carrier Skymark Airlines in allowing staff to wear sneakers to work.
LABOUR CRUNCH PRESSURE
Japan, a rapidly ageing country with limited immigration, has seen its working-age population tumble 16% since a peak in 1995, according to OECD data. That’s set off fierce competition for staff.
Two-thirds of Japanese firms have said the labour shortage is having a serious business impact, a Reuters survey shows. It was the leading cause of Japanese bankruptcies in April-September, with the number of failures hitting their highest level in 12 years for a first-half period, according to Tokyo Shoko Research.
That’s given young people more power, at least with regard to part-time work.
Two-thirds of students believe they should be able to choose their appearance when working part-time, according to an April survey by job information and recruitment firm Mynavi. One-third said they had withdrawn job applications because of dress codes at potential employers.
“Students aren’t just looking for work experience or to earn money; they seem to be seeking something more in their jobs – a sense of freedom or comfort,” said Shota Miyamoto, a researcher at Mynavi. But he added they did not expect the same of full-time work.
While Japan may be loosening up, some aspects of personal appearance that have become common in the West, like multiple or facial piercings, are still a bridge too far for many companies. Workers with tattoos - art traditionally associated with the yakuza in Japan – are generally asked to conceal them so as not to intimidate customers.
The latest changes have also yet to permeate many traditional big-name Japanese companies. Sumitomo Mitsui Banking Corp, for example, says it doesn’t have policies about hair or nail polish, but it’s generally understood among employees that their personal appearance shouldn’t create waves.
(Reporting by Satoshi Sugiyama; Editing by Edwina Gibbs)
(Bloomberg) — Asian markets looked set for a cautious start as investors braced for a barrage of US economic data amid lingering uncertainty over the Federal Reserve’s policy path. Bitcoin erased its gains for the year.
Equity-index futures pointed to modest declines in Hong Kong and a slight gain for Japan, while Australian shares opened lower. The yen held steady ahead of third-quarter growth data. US shares closed little changed on Friday as investors stayed on the sidelines ahead of economic reports delayed by the government shutdown.
After weeks of limited data, investors will finally get fresh signals on the health of the US economy as agencies begin releasing key indicators, including the September employment figures on Thursday. Traders are also navigating a mix of risks — from stretched valuations in AI-related stocks to renewed strains in relations between China and Japan. Risk appetite seemed to be fading, with Bitcoin sliding below $94,000 and wiping out its year-to-date advance.
“November so far has seen a pretty wobbly ride for shares,” Shane Oliver, chief economist and head of investment strategy at AMP Ltd., wrote in a note to clients. “Share markets remain at risk of a correction given stretched valuations, risks around US tariffs and the softening US jobs market.”
A slew of Fed officials have expressed skepticism over the need for a cut in December, or outright opposed one, less than a month after Chair Jerome Powell warned that a December cut is far from a “foregone conclusion.”
Last week, futures traders pushed the odds of a quarter-point rate cut in December below 50% as some Fed officials indicated that such a move is far from a sure thing. That near-term uncertainty has driven up a gauge of expected bond-market volatility, which had been hovering around a four-year low.
“While there will be questions about data quality, market participants will react to new information” and weigh the dollar, Commonwealth Bank of Australia strategists led by Joseph Capurso wrote in a note to clients. “We expect the non-farm payrolls report for September to underperform expectations of a 50,000 increase.”
Meanwhile, the yen was steady in early trading ahead of Japanese third quarter growth data, which may provide justification for Prime Minister Sanae Takaichi compiling a hefty stimulus package. Japan’s real gross domestic product is forecast to contract by 2.4% in the three months through September on an annualized basis, the first decline in six quarters, according to economists’ estimates.
The potential for stimulus and a reduction in rate hike expectations following Takaichi’s appointment has placed fresh pressure on the yen. The currency slid to its weakest in nine months last week, leading to official warnings that moves have become one-sided. Any further weakening may increase angst over possible government intervention with the currency near levels that previously drew authorities into the market.
“Technically, USD/JPY is approaching levels where Japanese currency officials are expected to begin to verbally intervene more aggressively,” Tony Sycamore, a strategist at IG Markets, wrote in a note. “However, actual physical intervention is unlikely until the exchange rate reaches around 160 or higher, given the dovish stance of the new Japanese Prime Minister.”
In commodities, oil started the week a touch lower while gold edged up. The precious metal has jumped more than 50% this year, putting it on course for its best annual gain since 1979.
Attention is also on the cryptocurrencies market. Just a little more than a month after reaching an all-time high, Bitcoin has erased the more than 30% gain registered since the start of the year as the exuberance over the pro-crypto stance of the Trump administration fades.
The dominant cryptocurrency fell below $93,714 on Sunday, pushing the price beneath the closing level reached at the end of last year, when financial markets were rallying following President Donald Trump’s election victory. Bitcoin soared to a record $126,251 on Oct. 6, only to begin tumbling four days later after unexpected comments on tariffs by Trump sent markets into a tailspin worldwide.
Corporate News:
Samsung Group and SK Group were among four of South Korea’s biggest companies that pledged to invest about $550 billion in the country after meeting with President Lee Jae Myung. A White House national security memo claimed Alibaba Group Holding Ltd. provided the Chinese military with technology support against targets in the US, the Financial Times reported. Boeing Co. said it will ensure its factories are ready to absorb a higher rate of aircraft output before lifting the tempo again next year. Some of the main moves in markets:
Stocks
S&P 500 futures rose 0.1% as of 8:26 a.m. Tokyo time Hang Seng futures fell 0.3% Australia’s S&P/ASX 200 fell 0.2% Currencies
The Bloomberg Dollar Spot Index was little changed The euro was little changed at $1.1622 The Japanese yen was little changed at 154.54 per dollar The offshore yuan was little changed at 7.0978 per dollar The Australian dollar was little changed at $0.6534 Cryptocurrencies
Bitcoin rose 0.9% to $94,271.23 Ether rose 0.7% to $3,094.2 Bonds
Australia’s 10-year yield advanced three basis points to 4.47% Commodities
West Texas Intermediate crude fell 1% to $59.48 a barrel Spot gold rose 0.5% to $4,106.23 an ounce This story was produced with the assistance of Bloomberg Automation.
Artificial intelligence and emerging markets are set to define the next decade, according to Goldman Sachs. The Goldman Sachs 10-year global outlook, released on Wednesday, sets out the investment bank’s expectations leading up to 2035. The longer-look report is designed to complement forecasts from the firm’s economists. “While cyclical forces will periodically influence markets, the drivers that we expect to dominate over this horizon are structural: trend nominal growth, profitability and margin behavior, starting valuations and the policy backdrop,” Goldman Sachs analysts noted. They used a common framework across assessed regions, adapting it based on local specifics. The model estimated total returns as the sum of earnings growth, valuation changes and dividend yield, using assumptions tailored to each market’s drivers and index makeup. AI has been the defining trend of the year, and emerging markets have been hot amid volatility in supply chains, tariffs, and currency, leading investors to diversify their portfolios. Goldman Sachs analysts expect those trends to continue. “Historically, dollar weakness has coincided with non-US outperformance, adding an extra layer of opportunity for globally diversified portfolios,” they added. Here’s a look at the report’s key points in more detail: Equities look robust in the long-term, despite AI bubble fears Analysts at Goldman Sachs are comfortable with the current track of global equities, despite the are-we-aren’t-we chatter surrounding an AI bubble . “We expect global equities to deliver solid long-term returns despite elevated valuations,” they wrote. The investment bank forecasts global equities to grow 7.7% per annum, which “sits close to the historical median,” the analysts noted. While valuations start at around 19-times forward earnings, they said, “we assume they will be slightly lower over the decade.” Buoyancy is supported by nominal growth, profitability, and shareholder distributions, per the note. A bubble is typically defined by a disconnection between valuations and fundamentals, a dynamic many fund managers and analysts believe is emerging within AI-related stocks. On the flip side, a strong earnings season has quelled some concerns and caused a further rally on tech stocks . “Earnings growth remains the primary engine of performance. We expect global earnings — including buybacks — to compound at roughly 6% annually. Dividends provide the rest of the return, while we expect valuations to ease modestly from current highs,” the Goldman Sachs analysts added. Emerging markets to outperform the U.S. Emerging markets are expected to hold attention over the next decade, cementing the sector as a key driver of returns as they outperform other regions including the U.S. The investment bank predicts emerging markets will advance 10.9% due to strong earnings per share growth in China and India. Excluding Japan, Asia tails closely, with an expected 10.3% rise due to earnings per share and dividend yield. Japan, whose Nikkei 225 index is up 27.4 year-to-date, will see expected returns of 8.2%, the analysts added. Elsewhere, earnings and shareholder returns could boost Europe 7.1%. The U.S. will see the smallest expected gains of 6.5%, which Goldman Sachs analysts said is driven “entirely by earnings and modest dividends.” “Diversify beyond the US, with a tilt towards Emerging Markets. We expect higher nominal GDP growth and structural reforms to favour EM, while AI’s long-term benefits should be broad-based rather than confined to US Technology,” they added. Benefits of AI to surpass Silicon Valley Investors are split on AI’s impact on emerging markets but Goldman Sachs analysts expect its benefits — which McKinsey says will eventually be worth $4.4 trillion — to be widespread. Korea, Taiwan, Japan, and China are investing heavily in AI-driven capex and adoption, however, there are “significant differences” between each country, the note said. India is likely to see the most growth, at 13% compound annual growth rate (CAGR) driven by strong economic fundamentals and demographic tailwinds. Taiwan and Korea, both 10% earnings per share CAGR, “will likely see earnings growth bolstered by AI capex, shareholder reform (mainly Korea), and strategic sectors including defence, nuclear, and shipbuilding (Korea),” Goldman Sachs analysts wrote. “China has the capacity to deliver 12% growth over the next three years, driven by AI capex/adoption, rising external market share (the going-global theme), and anti-involution (reduction of excess capacity and corresponding margin pressure),” they said.
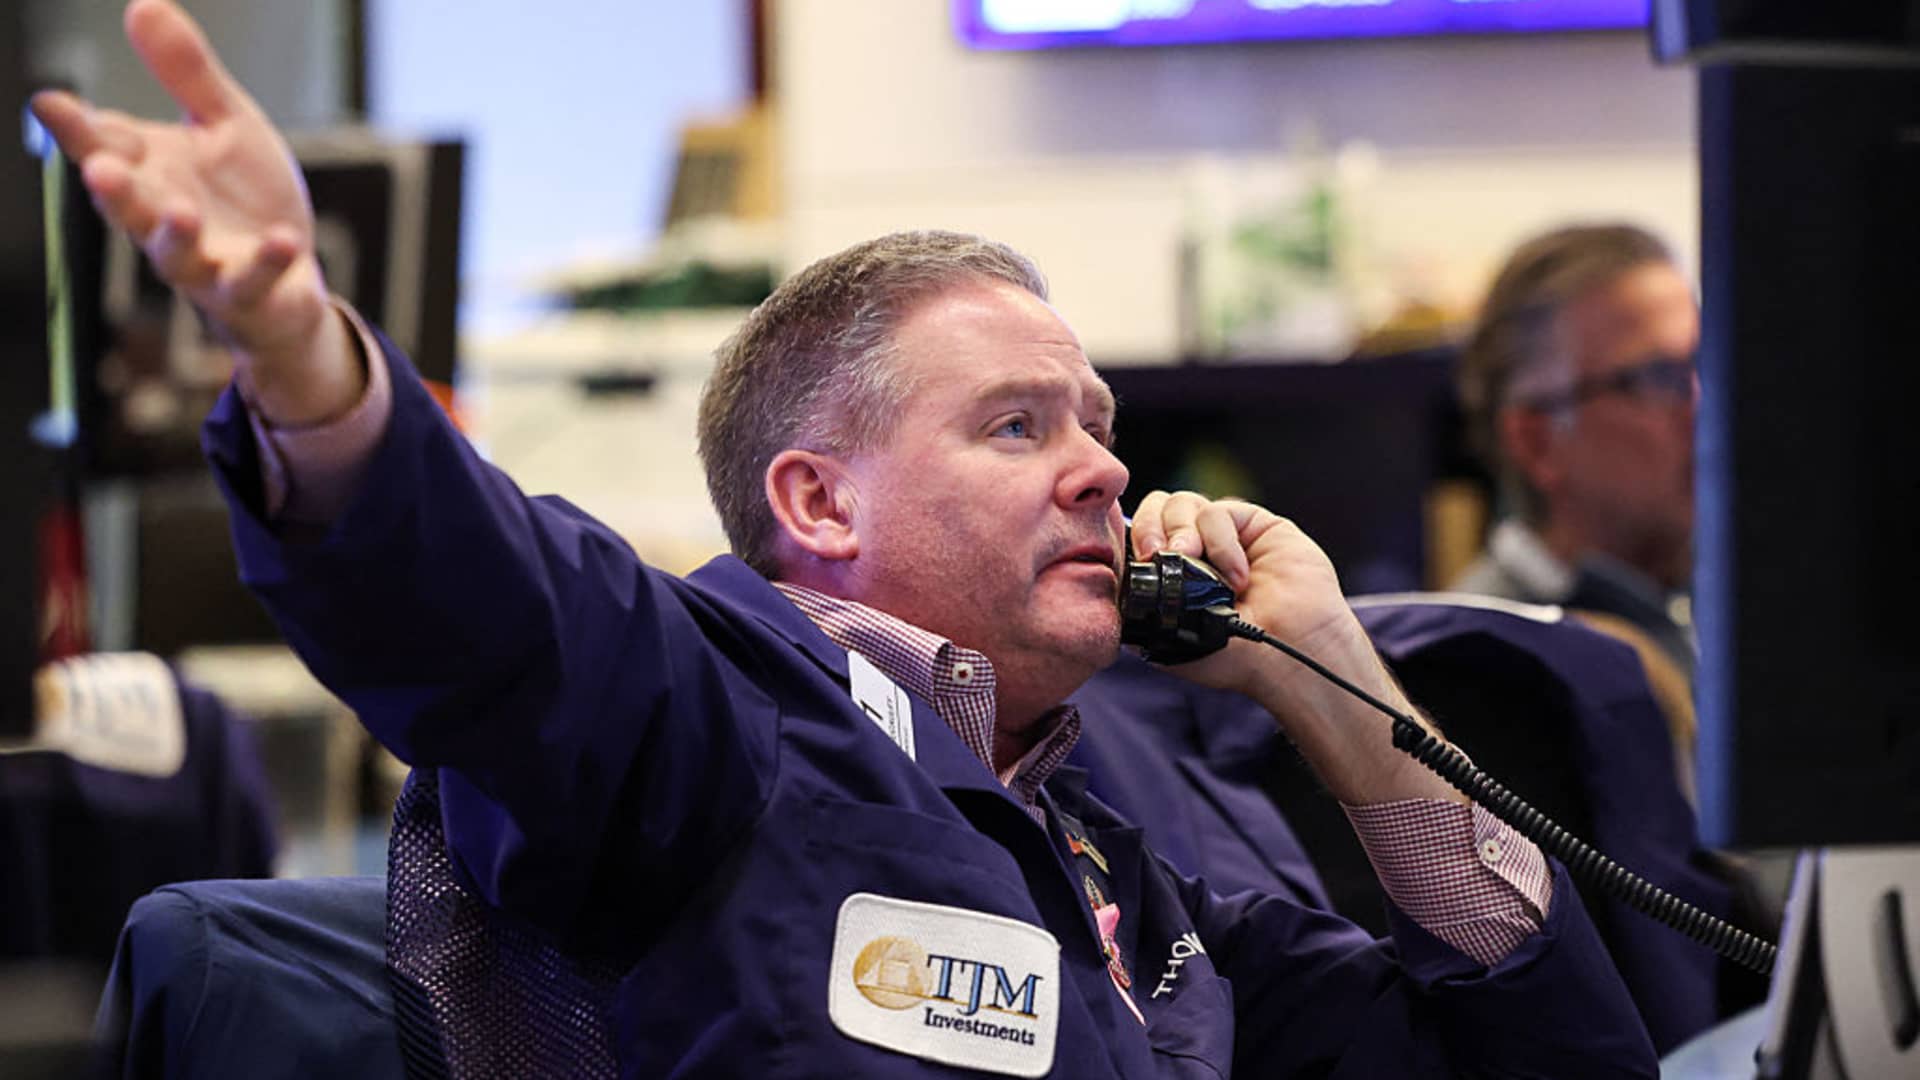
Traders work on the floor of the New York Stock Exchange (NYSE) in New York on November 14, 2025.
Charly Triballeau | Afp | Getty Images
Stock futures were little changed on Sunday night following a choppy week in which valuation fears, a rotation within the market and a recalibration of Federal Reserve rate cut expectations pressured the artificial intelligence trade.
Dow Jones Industrial Average futures slipped 58 points, or 0.1%. S&P 500 and Nasdaq-100 futures hovered around the flatline.
The Nasdaq Composite ended last week down 0.5%, led by declines in Alphabet, Amazon, Broadcom and Meta Platforms. The Dow Jones Industrial Average and S&P 500 eked out small gains last week, though they suffered steep declines on Thursday.
“We had expected the first couple weeks of November to be choppy, and it certainly looks like we are in the midst of the chop,” wrote Tom Lee, head of research at Fundstrat.
“While some parts of the wall of worries, such as the government shutdown and the New York City mayoral race, have been resolved, other parts remain,” he said. “Nevertheless, we expect the current chop to ultimately give way to a rally and ultimately add roughly 200 points to take the S&P 500 over 7,000.”
Investors will get more clues on the state of the AI trade this week, when Nvidia reports earnings on Wednesday. Wall Street will also get a look at the health of the consumer, with retail giants Walmart and Home Depot set to post their quarterly results.
It is usually uneventful when a single insider buys stock. However, When quite a few insiders buy shares, as it happened in Marvel Gold Limited’s (ASX:MVL) case, it’s fantastic news for shareholders.
While insider transactions are not the most important thing when it comes to long-term investing, logic dictates you should pay some attention to whether insiders are buying or selling shares.
AI is about to change healthcare. These 20 stocks are working on everything from early diagnostics to drug discovery. The best part – they are all under $10bn in marketcap – there is still time to get in early.
In the last twelve months, the biggest single purchase by an insider was when Independent Non-Executive Chairman Stephen Dennis bought AU$500k worth of shares at a price of AU$0.08 per share. That means that even when the share price was higher than AU$0.016 (the recent price), an insider wanted to purchase shares. It’s very possible they regret the purchase, but it’s more likely they are bullish about the company. We always take careful note of the price insiders pay when purchasing shares. It is generally more encouraging if they paid above the current price, as it suggests they saw value, even at higher levels.
Marvel Gold insiders may have bought shares in the last year, but they didn’t sell any. Their average price was about AU$0.052. These transactions suggest that insiders have considered the current price attractive. You can see the insider transactions (by companies and individuals) over the last year depicted in the chart below. By clicking on the graph below, you can see the precise details of each insider transaction!
Check out our latest analysis for Marvel Gold
ASX:MVL Insider Trading Volume November 16th 2025
Marvel Gold is not the only stock that insiders are buying. For those who like to find small cap companies at attractive valuations, this free list of growing companies with recent insider purchasing, could be just the ticket.
I like to look at how many shares insiders own in a company, to help inform my view of how aligned they are with insiders. I reckon it’s a good sign if insiders own a significant number of shares in the company. From our data, it seems that Marvel Gold insiders own 8.4% of the company, worth about AU$1.9m. However, it’s possible that insiders might have an indirect interest through a more complex structure. We do generally prefer see higher levels of insider ownership.
The fact that there have been no Marvel Gold insider transactions recently certainly doesn’t bother us. But insiders have shown more of an appetite for the stock, over the last year. The transactions are fine but it’d be more encouraging if Marvel Gold insiders bought more shares in the company. So while it’s helpful to know what insiders are doing in terms of buying or selling, it’s also helpful to know the risks that a particular company is facing. Case in point: We’ve spotted 4 warning signs for Marvel Gold you should be aware of, and 2 of these can’t be ignored.
Of course, you might find a fantastic investment by looking elsewhere. So take a peek at this free list of interesting companies.
For the purposes of this article, insiders are those individuals who report their transactions to the relevant regulatory body. We currently account for open market transactions and private dispositions of direct interests only, but not derivative transactions or indirect interests.
Have feedback on this article? Concerned about the content?Get in touch with us directly. Alternatively, email editorial-team (at) simplywallst.com.
This article by Simply Wall St is general in nature. We provide commentary based on historical data and analyst forecasts only using an unbiased methodology and our articles are not intended to be financial advice. It does not constitute a recommendation to buy or sell any stock, and does not take account of your objectives, or your financial situation. We aim to bring you long-term focused analysis driven by fundamental data. Note that our analysis may not factor in the latest price-sensitive company announcements or qualitative material. Simply Wall St has no position in any stocks mentioned.
As global markets navigate a complex landscape marked by mixed performances in key indices and cautious monetary policies, the Asian market remains an area of interest for investors, particularly in the small-cap segment. With small-cap stocks often sensitive to economic shifts and interest rate movements, identifying those with potential value can be crucial; factors such as insider buying may offer additional insights into promising opportunities amidst these dynamic conditions.
Name
PE
PS
Discount to Fair Value
Value Rating
Security Bank
4.2x
0.9x
25.14%
★★★★★★
East West Banking
3.1x
0.7x
18.75%
★★★★☆☆
Civmec
16.4x
0.9x
47.69%
★★★★☆☆
Eureka Group Holdings
10.5x
4.6x
26.80%
★★★★☆☆
PSC
9.8x
0.4x
20.28%
★★★★☆☆
Hung Hing Printing Group
NA
0.4x
44.03%
★★★★☆☆
PolyNovo
60.9x
6.3x
28.29%
★★★☆☆☆
Nickel Asia
12.0x
1.8x
17.78%
★★★☆☆☆
Ever Sunshine Services Group
7.0x
0.4x
-459.68%
★★★☆☆☆
Chinasoft International
23.0x
0.7x
-1253.99%
★★★☆☆☆
Click here to see the full list of 43 stocks from our Undervalued Asian Small Caps With Insider Buying screener.
Let’s uncover some gems from our specialized screener.
Simply Wall St Value Rating: ★★★★☆☆
Overview: Asia United Bank provides a range of financial services including branch, consumer, and commercial banking, as well as treasury operations, with a market capitalization of ₱35.76 billion.
Operations: Asia United Bank’s primary revenue streams are derived from branch banking, treasury operations, and commercial banking. As of the latest data, the net income margin stands at 55.78%, indicating a strong profitability position. The company has experienced fluctuations in its operating expenses over time, which include significant contributions from general and administrative expenses.
PE: 4.6x
Asia United Bank, a smaller player in the Asian financial sector, shows potential for value appreciation. Insider confidence is evident with Ernesto Tan Uy purchasing 30,000 shares worth approximately ₱1.05 million in recent months, indicating belief in future performance. The bank’s strategic leadership changes include appointing Dennis Edmund E. Balagtas as Head of Trust and Investments Group from November 2025, bringing decades of experience to enhance trust banking operations. These developments suggest a focus on strengthening its market position amidst evolving industry dynamics.
PSE:AUB Share price vs Value as at Nov 2025
Simply Wall St Value Rating: ★★★★☆☆
Overview: Maynilad Water Services is a Philippine-based company that provides water and wastewater services in the western zone of Metro Manila, with a market capitalization of ₱54.23 billion.
Operations: Maynilad Water Services generates revenue primarily through its water distribution and wastewater services, with a notable gross profit margin of 86.22% as of September 2025. The company experiences significant operating expenses, including general and administrative costs, which impact its overall profitability. Non-operating expenses also play a role in financial outcomes, contributing to variations in net income margins over time.
PE: 8.0x
Maynilad Water Services, a prominent player in Asia’s water utility sector, recently reported a rise in third-quarter sales to PHP 9.24 billion from PHP 8.48 billion last year, reflecting solid operational performance despite its reliance on external borrowing for funding. The company’s IPO raised PHP 30.6 billion, indicating market confidence and potential for growth as it joins the PSE All Share Index. With new leadership under COO Christopher Lichauco and strategic shifts like discontinuing certain international projects, Maynilad is poised for focused domestic expansion while maintaining insider confidence through significant share purchases over the past year.
PSE:MYNLD Share price vs Value as at Nov 2025
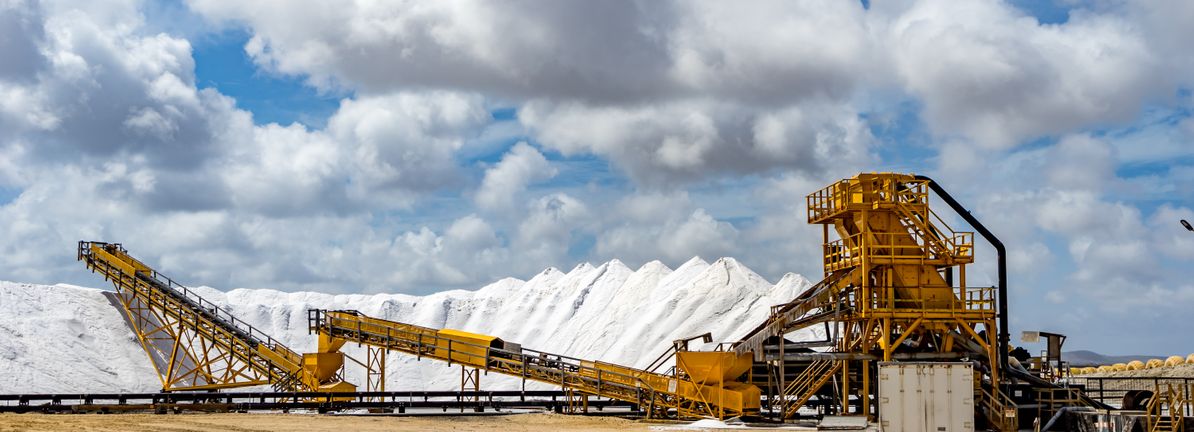
Simply Wall St Value Rating: ★★★☆☆☆
Overview: Nickel Asia is a leading nickel mining company in the Philippines, engaged in extracting, processing, and exporting nickel ore with a market capitalization of approximately ₱88.13 billion.
Operations: Nickel Asia generates revenue primarily through its operations, with significant costs attributed to the cost of goods sold (COGS). The company’s net income margin has shown variability, reaching as high as 32.88% in June 2022 and declining to 7.06% by December 2024. Operating expenses and non-operating expenses also play a role in financial performance, impacting the overall profitability.
PE: 12.0x
Nickel Asia’s recent financial performance highlights its potential in the Asian small-cap sector, with third-quarter revenue reaching PHP 11.05 billion and net income at PHP 3.09 billion, both showing significant year-over-year growth. Despite a volatile share price recently, insider confidence is evident through share purchases from March to October 2025. The company declared a special dividend of PHP 0.07 per share, payable on December 15, reflecting strong cash flow management despite relying solely on external borrowing for funding. Organizational changes effective January 2026 could further strengthen strategic planning and corporate governance structures as they navigate projected earnings declines over the next three years.
PSE:NIKL Share price vs Value as at Nov 2025
This article by Simply Wall St is general in nature. We provide commentary based on historical data and analyst forecasts only using an unbiased methodology and our articles are not intended to be financial advice. It does not constitute a recommendation to buy or sell any stock, and does not take account of your objectives, or your financial situation. We aim to bring you long-term focused analysis driven by fundamental data. Note that our analysis may not factor in the latest price-sensitive company announcements or qualitative material. Simply Wall St has no position in any stocks mentioned.
Companies discussed in this article include PSE:AUB PSE:MYNLD and PSE:NIKL.
Have feedback on this article? Concerned about the content? Get in touch with us directly. Alternatively, email editorial-team@simplywallst.com
As an investor its worth striving to ensure your overall portfolio beats the market average. But the risk of stock picking is that you will likely buy under-performing companies. Unfortunately, that’s been the case for longer term Rivco Australia Ltd (ASX:RIV) shareholders, since the share price is down 12% in the last three years, falling well short of the market return of around 33%.
With that in mind, it’s worth seeing if the company’s underlying fundamentals have been the driver of long term performance, or if there are some discrepancies.
We’ve found 21 US stocks that are forecast to pay a dividend yield of over 6% next year. See the full list for free.
In his essay The Superinvestors of Graham-and-Doddsville Warren Buffett described how share prices do not always rationally reflect the value of a business. One imperfect but simple way to consider how the market perception of a company has shifted is to compare the change in the earnings per share (EPS) with the share price movement.
Although the share price is down over three years, Rivco Australia actually managed to grow EPS by 21% per year in that time. Given the share price reaction, one might suspect that EPS is not a good guide to the business performance during the period (perhaps due to a one-off loss or gain). Or else the company was over-hyped in the past, and so its growth has disappointed.
We’re actually a quite surprised to see the share price down while EPS have grown strongly. Therefore, we should look at some other metrics to try to understand why the market is disappointed.
We note that the dividend seems healthy enough, so that probably doesn’t explain the share price drop. We like that Rivco Australia has actually grown its revenue over the last three years. But it’s not clear to us why the share price is down. It might be worth diving deeper into the fundamentals, lest an opportunity goes begging.
The graphic below depicts how earnings and revenue have changed over time (unveil the exact values by clicking on the image).
ASX:RIV Earnings and Revenue Growth November 16th 2025
We know that Rivco Australia has improved its bottom line lately, but what does the future have in store? If you are thinking of buying or selling Rivco Australia stock, you should check out this free report showing analyst profit forecasts.
When looking at investment returns, it is important to consider the difference between total shareholder return (TSR) and share price return. The TSR incorporates the value of any spin-offs or discounted capital raisings, along with any dividends, based on the assumption that the dividends are reinvested. Arguably, the TSR gives a more comprehensive picture of the return generated by a stock. In the case of Rivco Australia, it has a TSR of 3.4% for the last 3 years. That exceeds its share price return that we previously mentioned. This is largely a result of its dividend payments!
Rivco Australia shareholders gained a total return of 6.6% during the year. But that was short of the market average. The silver lining is that the gain was actually better than the average annual return of 6% per year over five year. This suggests the company might be improving over time. It’s always interesting to track share price performance over the longer term. But to understand Rivco Australia better, we need to consider many other factors. Case in point: We’ve spotted 1 warning sign for Rivco Australia you should be aware of.
If you like to buy stocks alongside management, then you might just love this free list of companies. (Hint: many of them are unnoticed AND have attractive valuation).
Please note, the market returns quoted in this article reflect the market weighted average returns of stocks that currently trade on Australian exchanges.
Have feedback on this article? Concerned about the content?Get in touch with us directly. Alternatively, email editorial-team (at) simplywallst.com.
This article by Simply Wall St is general in nature. We provide commentary based on historical data and analyst forecasts only using an unbiased methodology and our articles are not intended to be financial advice. It does not constitute a recommendation to buy or sell any stock, and does not take account of your objectives, or your financial situation. We aim to bring you long-term focused analysis driven by fundamental data. Note that our analysis may not factor in the latest price-sensitive company announcements or qualitative material. Simply Wall St has no position in any stocks mentioned.