Two-Time Best Bar in North America Brings
Award-Winning Mixology Onboard Princess Ships
FORT LAUDERDALE, Fla., Nov. 14, 2025 /PRNewswire/ — Princess Cruises has partnered with Handshake Speakeasy, named The Best Bar in North America 2025 by World’s 50 Best Bars for two consecutive years and celebrated for its inventive cocktail craftsmanship in the heart of Mexico City. This groundbreaking collaboration introduces five exclusive, bespoke cocktails, meticulously composed by Handshake’s award-winning mixologists and are set to debut aboard Princess Cruises.
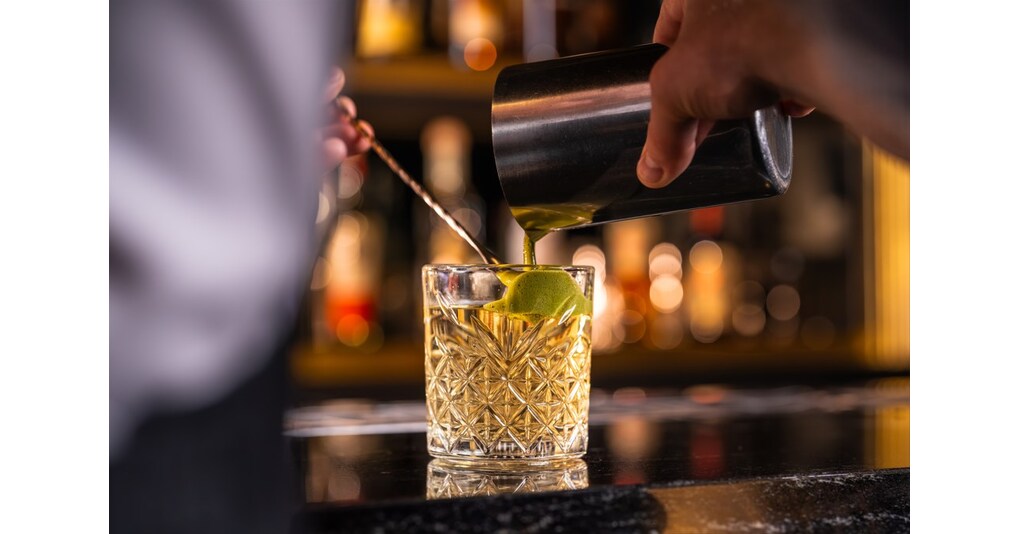
Green Tea cocktail available at Crooners Fleet Wide
Bringing the spirit and sophistication of Mexico City’s cocktail scene to sea, the partnership marks Handshake Speakeasy’s first-ever venture with a cruise line. The five signature cocktails will be available with three featured in the guest-favorite Crooners bar and two reserved exclusively for guests of The Sanctuary Collection beginning November 14, 2025, on Star Princess, with availability expanding fleetwide across all 17 Princess ships in the weeks that follow.
“At Princess, we’re always searching for ways to elevate our guests’ experiences, and this partnership with Handshake Speakeasy represents the best of the best in cocktail culture,” said Sami Kohen, Princess Cruises Vice President of Food and Beverage. “These are cocktails you simply can’t get anywhere else in the world. We’re thrilled to bring these world-class creations to the Princess fleet and offer our guests an unforgettable experience at sea.”
The partnership comes to life through a digital storytelling journey led by Rob Floyd, world-renowned mixologist and global ambassador of Princess Cruises. Recently filmed in Mexico City, the journey captures Floyd exploring vibrant markets as Eric Van Beek, Handshake’s co-owner and lead mixologist, designs cocktails that embody what he calls “the soul of the cocktail.”
Where to Sip at Sea
The exclusive creations include:
Crooners
- Pan Am Punch
Bacardi Superior, Aperol, Lemon, Orgeat - Green Tea
Bombay Sapphire Gin, Lemon, Vanilla, Coconut, Matcha Tea - Banana Bread O.F.
Rittenhouse Rye Whiskey, Banana, Walnut Brown Butter, Maple
The Sanctuary Club (part of The Sanctuary Collection)
- Hibiscus & Spice
Pantalones Tequila Blanco, Hibiscus, Lime, Cinnamon, Cointreau, Vanilla - Red Fruit & Roses
Elyx Vodka, Strawberry, Rose Water, Jasmine Tea, Lime
Handshake’s magic of cocktail-making is celebrated for its innovative drinks, sophisticated ambiance, and unique Mexican hospitality, which includes a hidden on-site flavor lab for crafting its cocktails. Recognized globally, Handshake has earned the titles of World’s Best Bar 2024 and North America’s Best Bar 2024 and 2025 by World’s 50 Best Bars.
“Working with Handshake Speakeasy is about more than mixing spirits – it’s about telling a story in every sip,” said Rob Floyd, Princess Cruises Global Mixologist Ambassador. “These five cocktails are unique, playful, and carry with them the soul of Mexico City’s vibrant bar culture.”
“We are really excited with this collaboration, because we can bring a piece of Handshake to more guests and show a little bit of our work with a great partner,” said Rodrigo Urraca, co-owner Handshake Speakeasy.
In addition to this new collaboration, Princess continues to elevate its bar scene with the popular Love Line Premium Liquors collection. The collection includes a selection of thoughtfully curated wines and spirits, offering both spirited selections and non-alcoholic* creations by renowned celebrities, including:
- Pantalones Organic Tequila by Camila and Matthew McConaughey
- Meili Vodka by Jason Momoa and Blaine Halvorson
- Sláinte Irish Whiskey by Liev Schreiber
- Archer Roose co-owned by Elizabeth Banks
- Seven Daughters Moscato by Taraji P. Henson
- Melorosa Sauvignon Blanc and Red Blend co-founded by Jason Aldean, Kasi Wicks and Chuck Wicks
- Love Prosecco by Romero Britto
- Zero Alcohol Sparkling Rosé by Kylie Minogue
- Betty Booze by Blake Lively
Additional information about Princess Cruises is available through a professional travel advisor, by calling 1-800-PRINCESS (1-800-774-6237), or by visiting the company’s website at www.princess.com.
*Some beverages labeled as “non-alcohol” may contain trace amounts of alcohol up to 0.5% alcohol by volume due to natural fermentation or flavoring extracts. In accordance with FDA and TTB guidelines, the term “non-alcoholic” does not mean “alcohol-free.” These drinks are intended for adults aged 21 and over. Please consume responsibly.
About Princess Cruises
Princess Cruises is The Love Boat, the world’s most iconic cruise brand that delivers dream vacations to millions of guests every year in the most sought-after destinations on the largest ships that offer elite service personalization and simplicity customary of small, yacht-class ships. Well-appointed staterooms, world class dining, grand performances, award-winning casinos and entertainment, luxurious spas, imaginative experiences and boundless activities blend with exclusive Princess MedallionClass service to create meaningful connections and unforgettable moments in the most incredible settings in the world – the Caribbean, Alaska, Panama Canal, Mexican Riviera, Europe, South America, Australia/New Zealand, the South Pacific, Hawaii, Asia, Canada/New England, Antarctica, and World Cruises. Sun Princess, the brand’s new, next-level Love Boat named Condé Nast Traveler’s Mega Ship of the Year, introduces the groundbreaking Sphere Class platform and will be joined by sister ship, Star Princess, in Fall 2025. The company is part of Carnival Corporation & plc (NYSE/LSE: CCL; NYSE: CUK).
SOURCE Princess Cruises