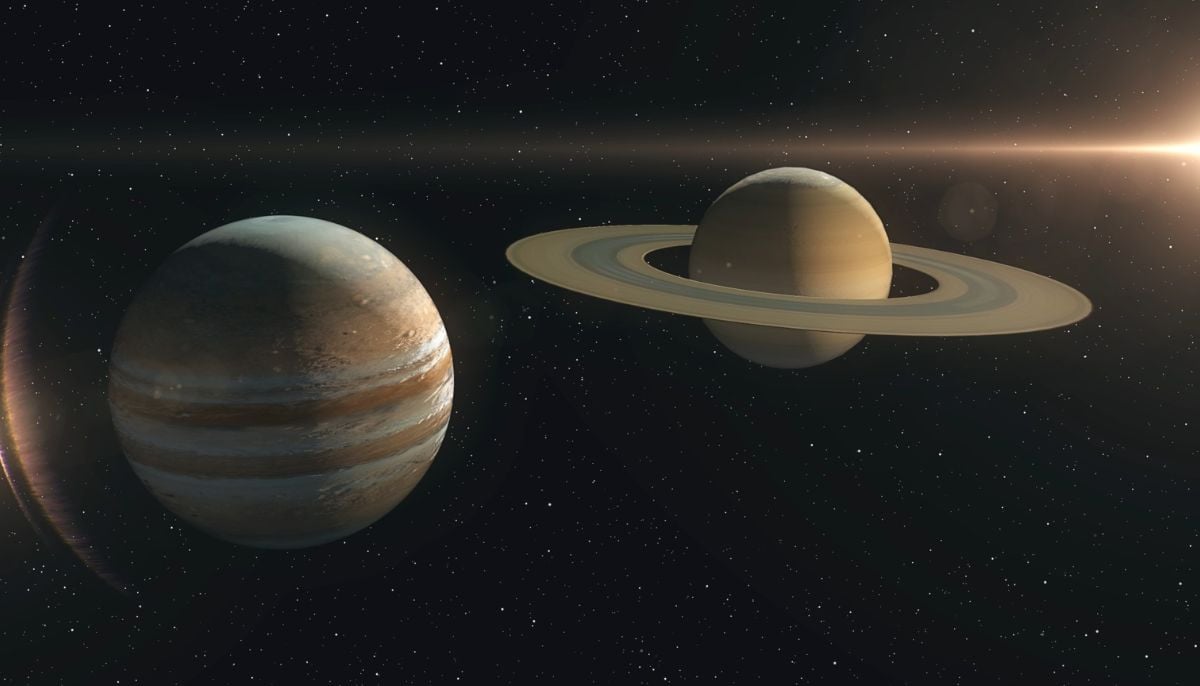
Most people do not understand that the solar system contains more objects than they…
Category: 7. Science
-

Physicists create electron ‘catapult’ that moves particles through solar cells at record speed
Molecular vibrations can “catapult” electrons across solar materials in quadrillionths of a second — much faster than previously thought, a new study shows.
The findings could help scientists find more efficient ways to convert solar…
Continue Reading
-
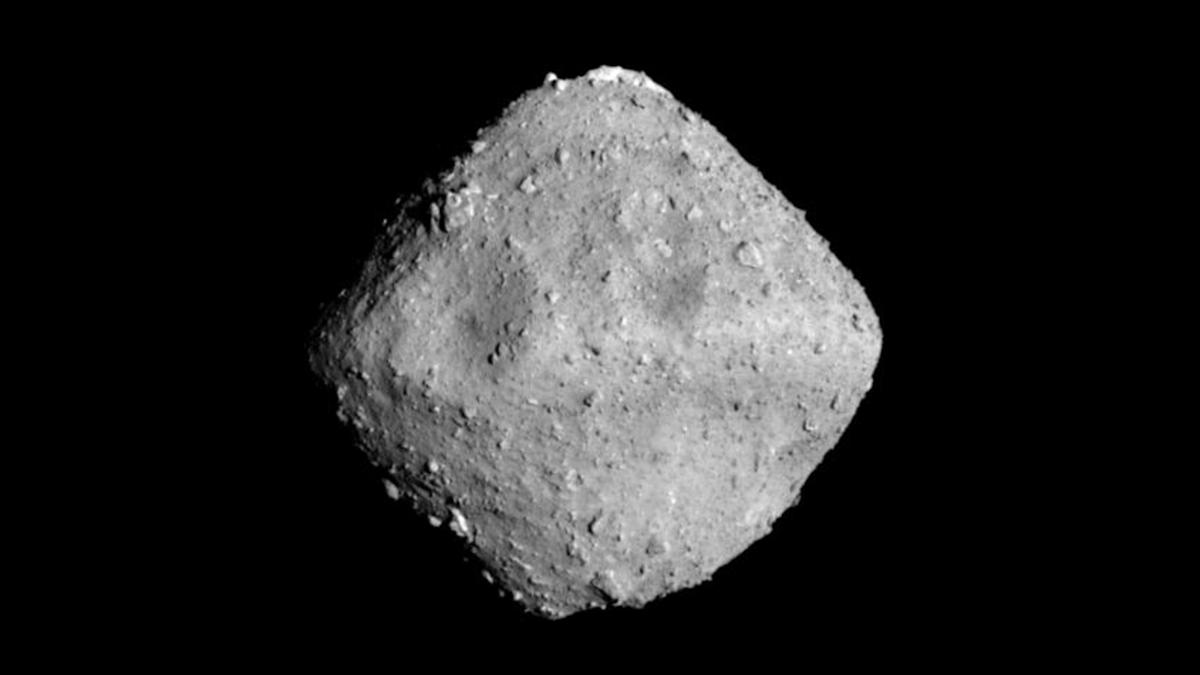
DNA building blocks on asteroid Ryugu, bacteria that eat plastic waste, and more science news
Remember when Japan sent a spacecraft to an asteroid 180 million miles away to scoop some dirt off the surface? Six years on from its arrival to Earth, that sample has yielded some insights about what may have seeded life on our planet. Read on…
Continue Reading
-

The Longest Animal On Earth Has No Brain, No Bones And 1,200 Stingers — A Biologist Explains
In 1865, a dead jellyfish washed onto a Massachusetts beach. When scientists measured it, they discovered that its bell measured 2.1 meters (7 feet) across, making it wider than most doorways. What was more shocking were its tentacles: they…
Continue Reading
-
A student volunteer and a mesh suit helped us figure out how mosquitoes reach their targets – Phys.org
- A student volunteer and a mesh suit helped us figure out how mosquitoes reach their targets Phys.org
- Why Mosquitoes Swarm Your Head: They’re Following Signals, Not Each Other Georgia Institute of Technology
- Mosquito Flight Patterns Modeled to…
Continue Reading
-
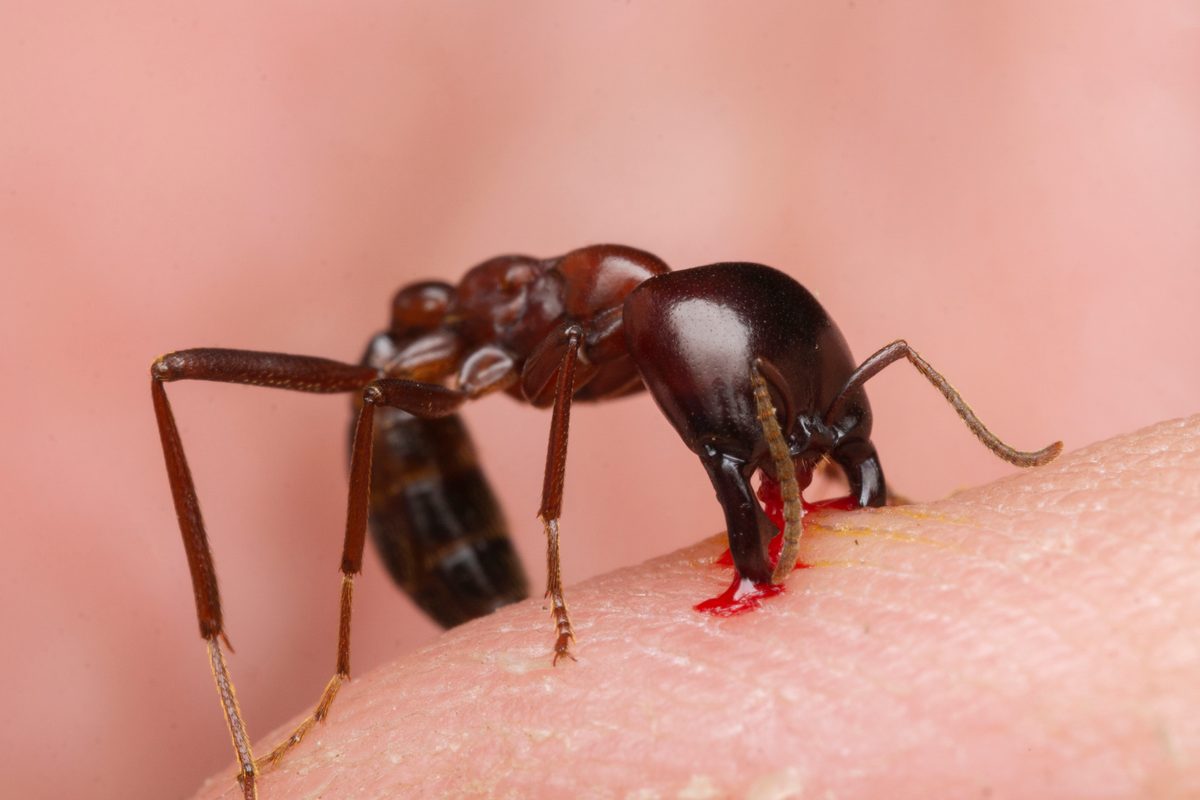
Raiding parties are the soldiers, bearing enormous heads armed with long, scissor-like mandibles capable of dismantling prey piece by piece…
What driver ants lack in size they make up for in sheer weight of numbers. A single colony may contain more than a million workers, and when they go hunting, the forest floor itself seems to come alive.
These expeditions are driven by the…
Continue Reading
-
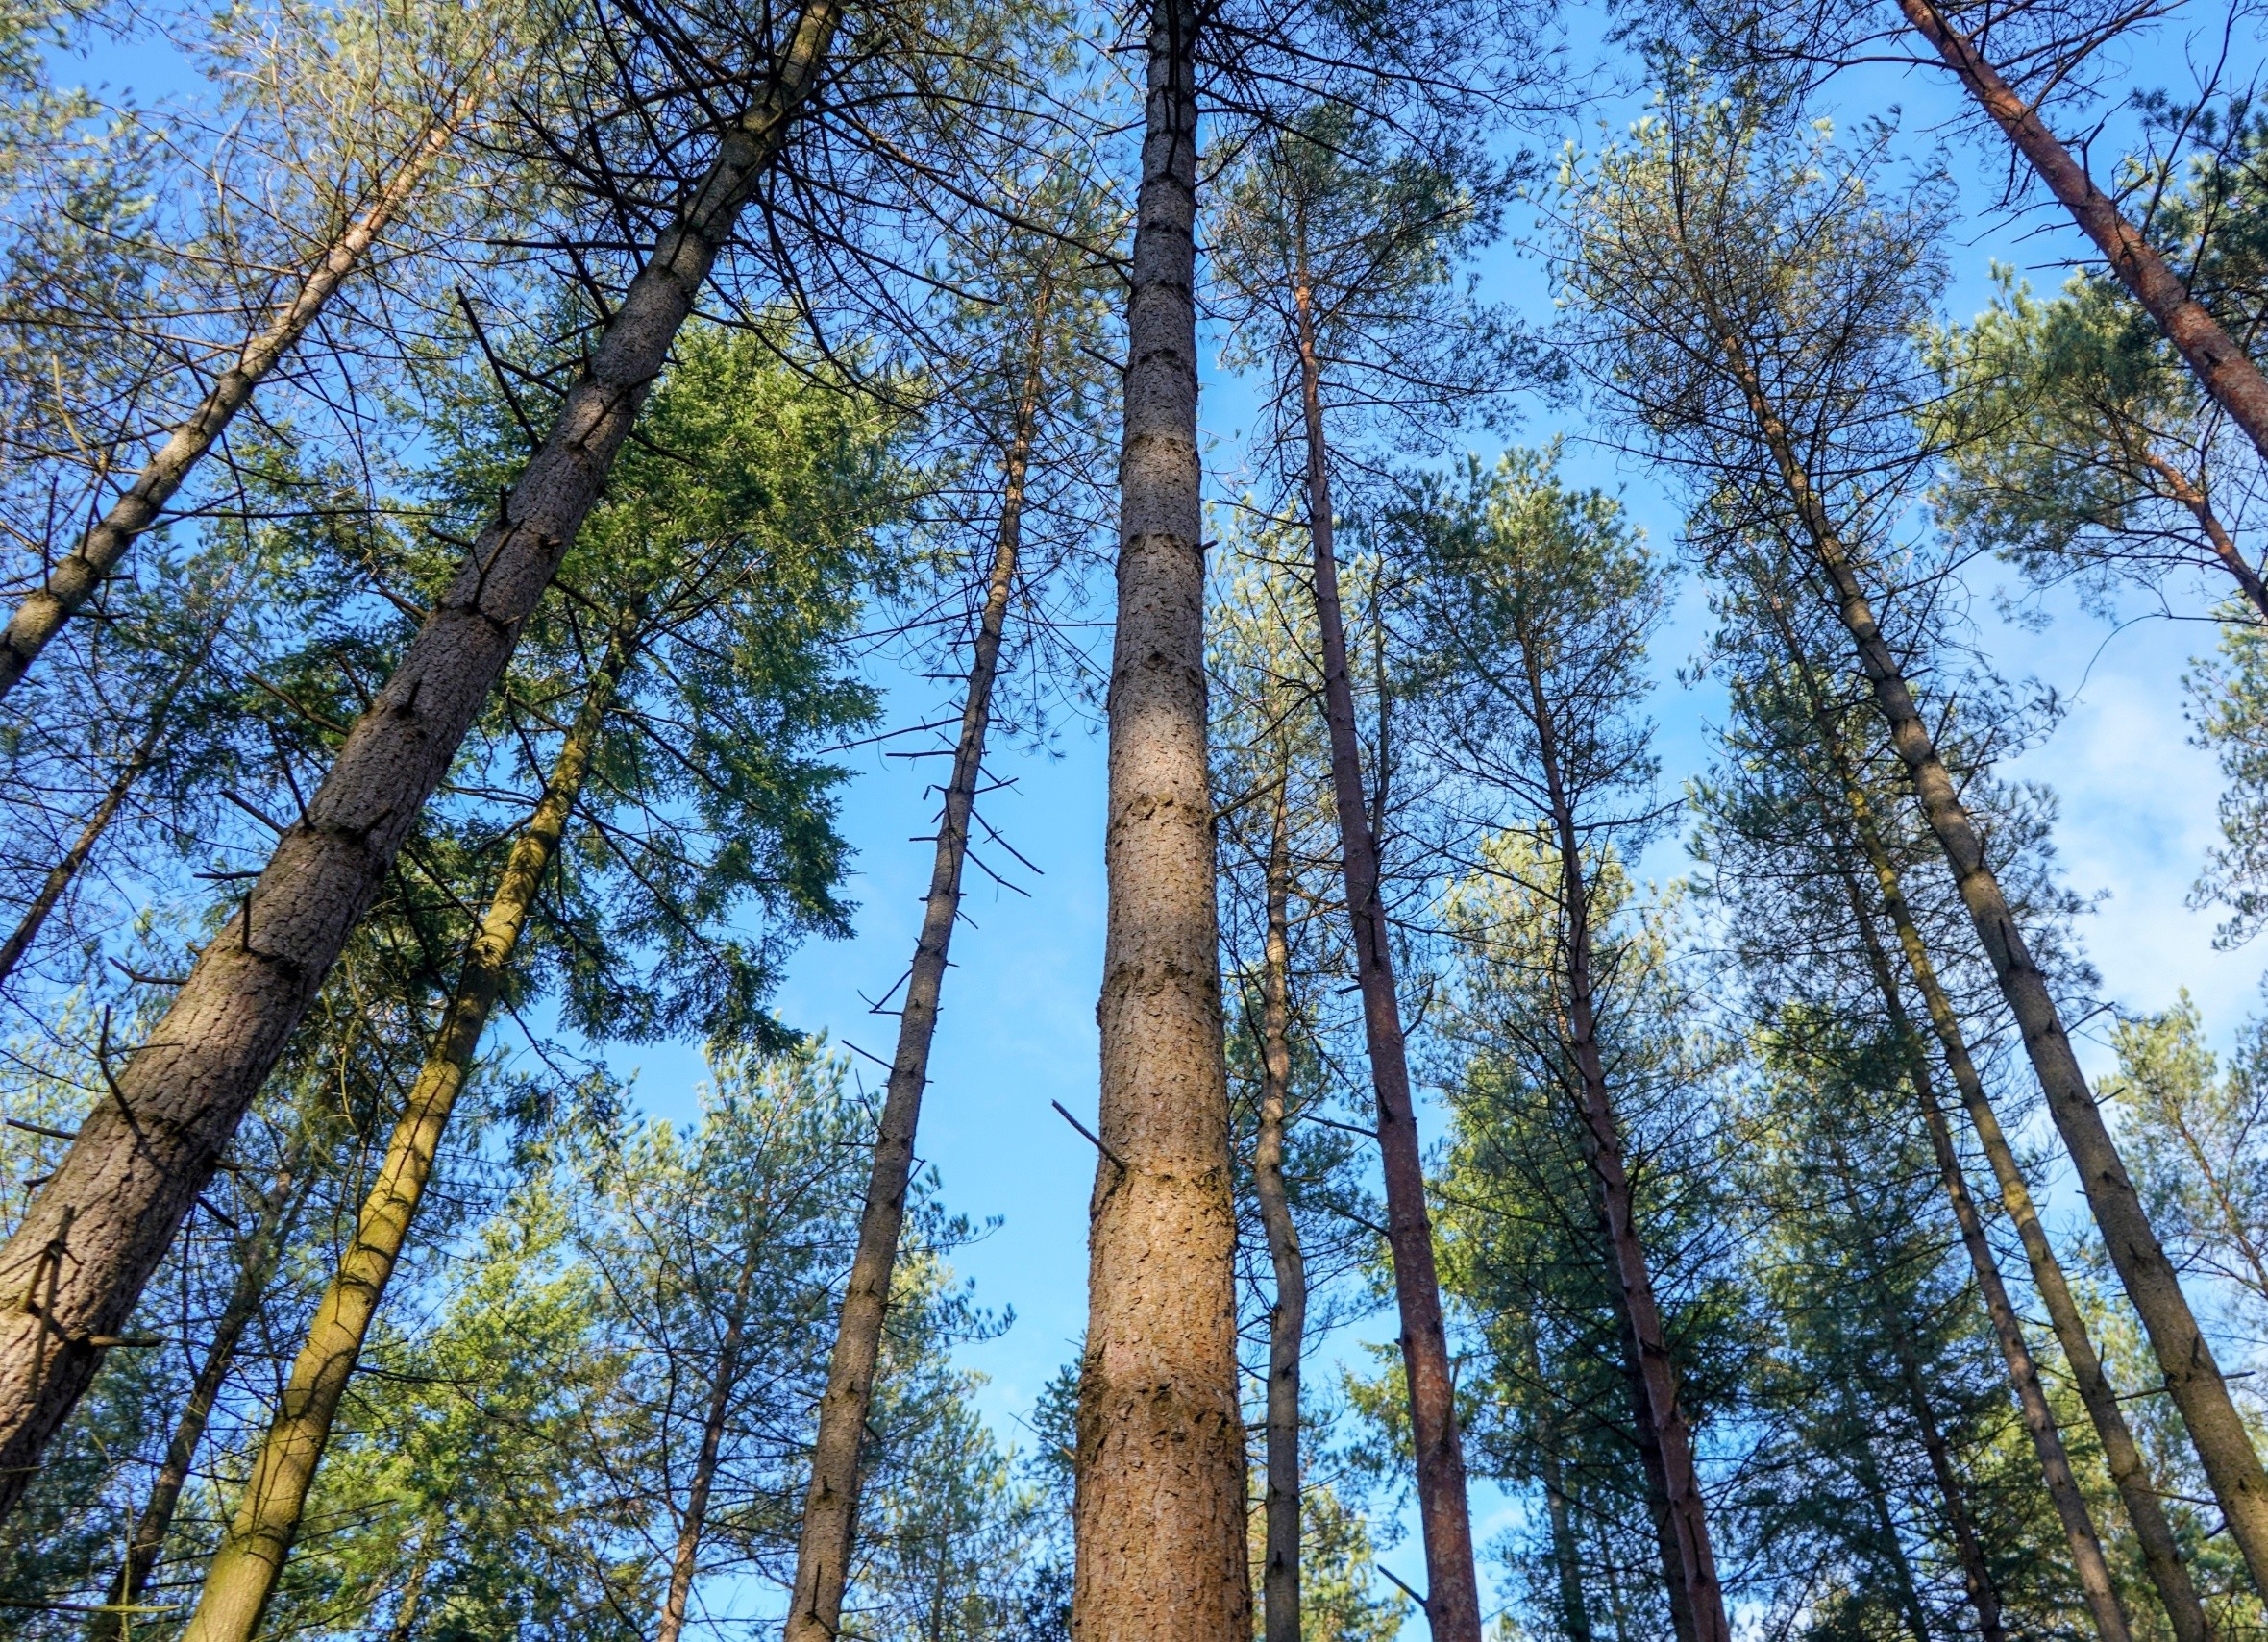
Old-growth forests hold far more carbon than managed forests
What if forests are doing much more for the climate than we ever imagined? A new study shows that some forests quietly store huge amounts of carbon, far more than scientists once believed.
This discovery changes how people understand climate…
Continue Reading
-

Crystal study reveals new way to guide heat and energy
Researchers have detected vibrations inside a magnetic crystal that split into two distinct motions and carry their own magnetic signal.
The finding reveals a direct physical link between heat, sound, and magnetism, connecting three processes that…
Continue Reading
-
Toward accelerating fluvial morphodynamic simulations through a speed accuracy trade-off assessment
Mohammadi, A., Alaghmand, S. & Mosaedi, A. Study and determination of morphological changes of Dough River in North of Iran using GIS. in Congress Int. Soc. Photogrammetry Remote Sens. 1217–1220 (2008).
Charlton, R. Fundamentals of Fluvial…
Continue Reading
-

Scientists reveal Earth’s crust was moving far earlier
The surface of the Earth is composed of tectonic plates that slowly move around over geologic time, creating continents and oceans, and influencing climates. But scientists have debated for decades when this shift began. Some theories suggest…
Continue Reading