Some genetic mutations that are expected to completely stop a gene from working surprisingly cause only mild or even no symptoms. Researchers in previous studies have discovered one reason why: Cells can ramp up the activity of other genes that…
Category: 7. Science
-

Publisher demands $500 from impersonated author to retract paper – Retraction Watch
Last year, we wrote about a Walsh Medical Media journal that refused to withdraw an author’s paper unless he paid a fee — even though he didn’t write or submit the article. For one reader, some details of that story were…
Continue Reading
-

Ocean temperatures may be protecting Earth from a planet-wide drought
Scientists at the Indian Institute of Technology Gandhinagar (IITGN), working with international collaborators, have discovered that ocean temperature patterns play a key role in limiting how widely droughts spread across the globe. Their…
Continue Reading
-
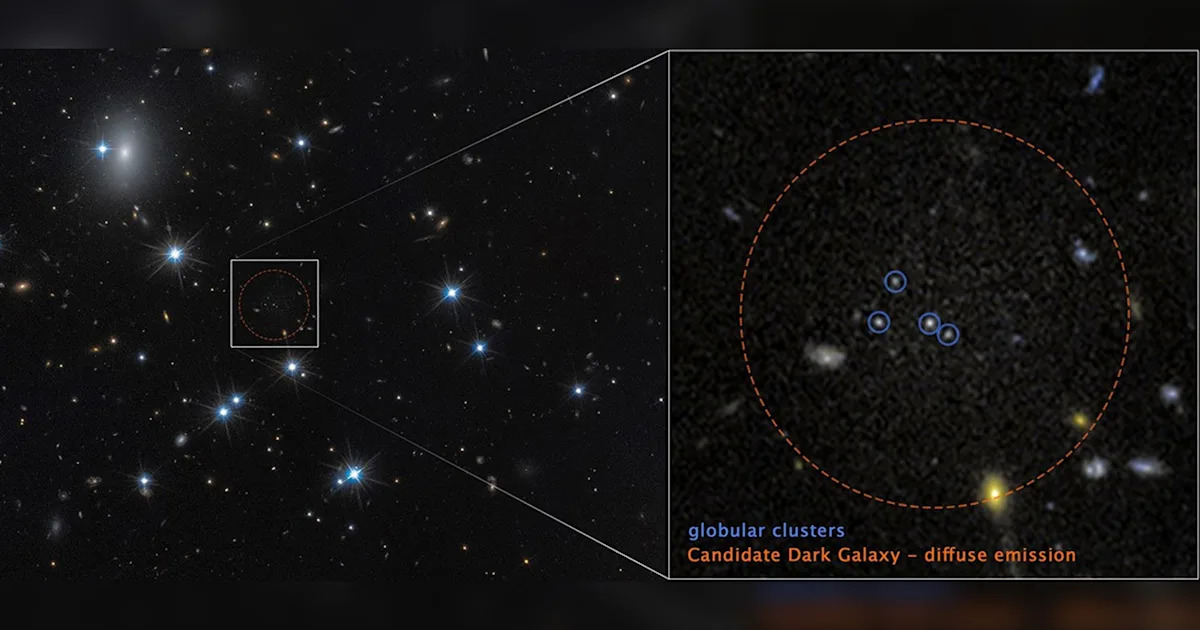
Hubble Spots Bizarre Galaxy That Appears to Be 99.9 Percent Dark Matter
The universe is overrun with dark matter, outweighing the ordinary stuff that stars and planets are made of five-to-one. But some corners of the cosmos are more dominated by the invisible substance than others.
Using the stalwart Hubble Space…
Continue Reading
-
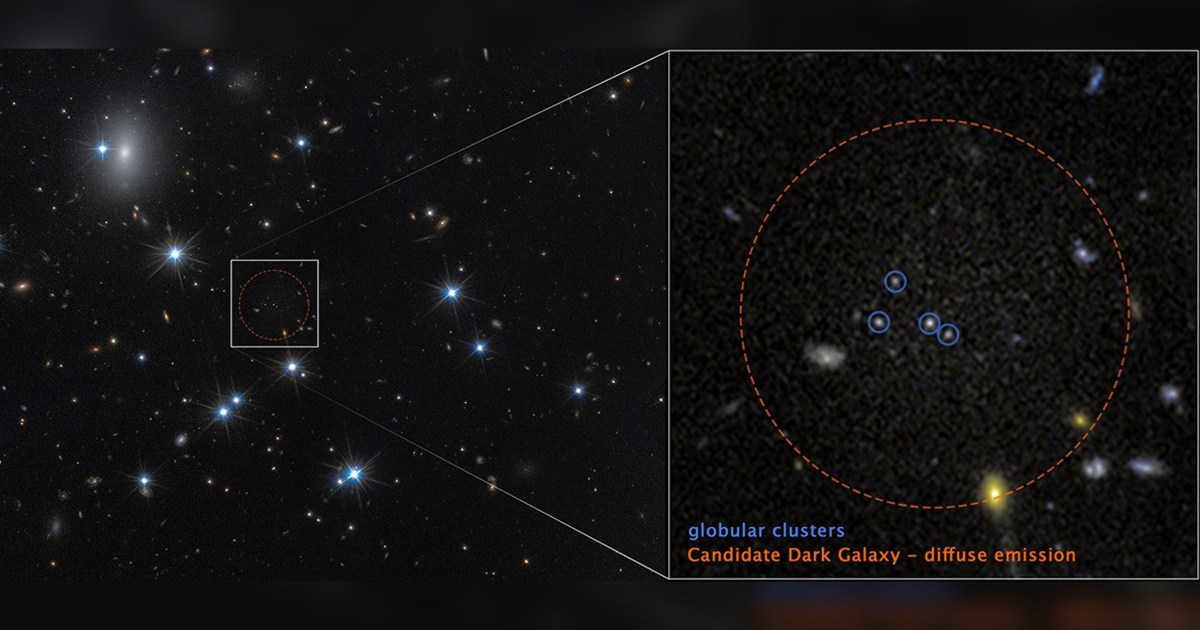
Hubble Spots Bizarre Galaxy That Appears to Be 99.9 Percent Dark Matter
The universe is overrun with dark matter, outweighing the ordinary stuff that stars and planets…
Continue Reading
-
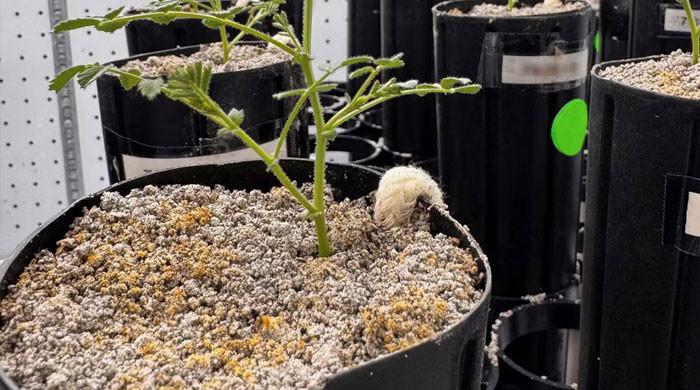
With lunar missions looming, scientists grow chickpeas in ‘moon dirt’
A chickpea plant grows in a lunar soil simulant mixture inside a climate-controlled growth chamber at Texas A&M University in College Station, Texas, US, in this undated handout. — Reuters If the idea of lunar…
Continue Reading
-
Making hummus on the moon? Scientists just grew chickpeas in simulated lunar dirt
A combination of fungi and compost could make lunar regolith more fertile and one day help astronauts grow crops on the moon, according to new research based around experiments with chickpea plants.
Future outposts on the moon will need to be as…
Continue Reading
-
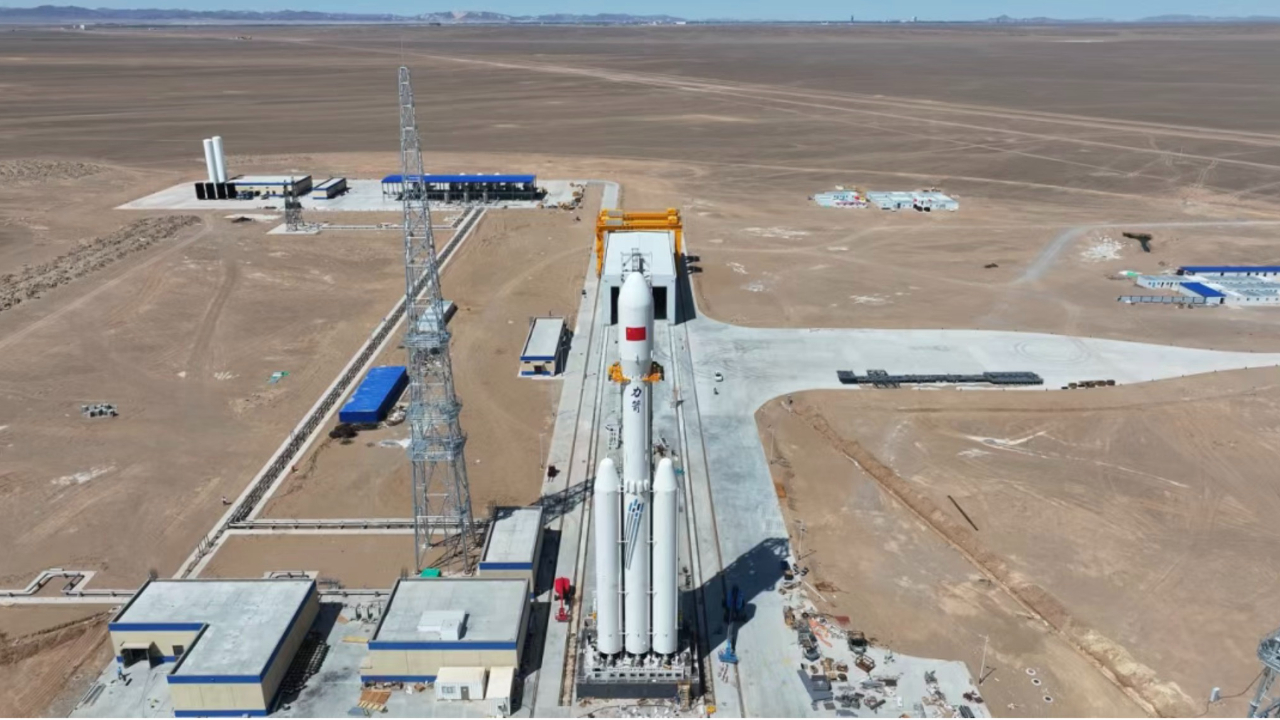
CAS Space Kinetica-2 Rocket Will Launch In Late March
CAS Space has officially set the launch of its Kinetica-2 reusable liquid rocket for late March. This launch will take place from the Jiuquan Satellite Launch Centre in the Gobi Desert and will carry a prototype of the Qingzhou-1 cargo spacecraft…
Continue Reading
-
Photographer Captures Rare Blue Line On Tuesday’s ‘Blood Moon’ Eclipse – Forbes
- Photographer Captures Rare Blue Line On Tuesday’s ‘Blood Moon’ Eclipse Forbes
- Totality is over — Feast your eyes on the 1st photos of the blood moon total lunar eclipse 2026 Space
- ‘Blood Moon’ to be visible in Pakistan today Business…
Continue Reading