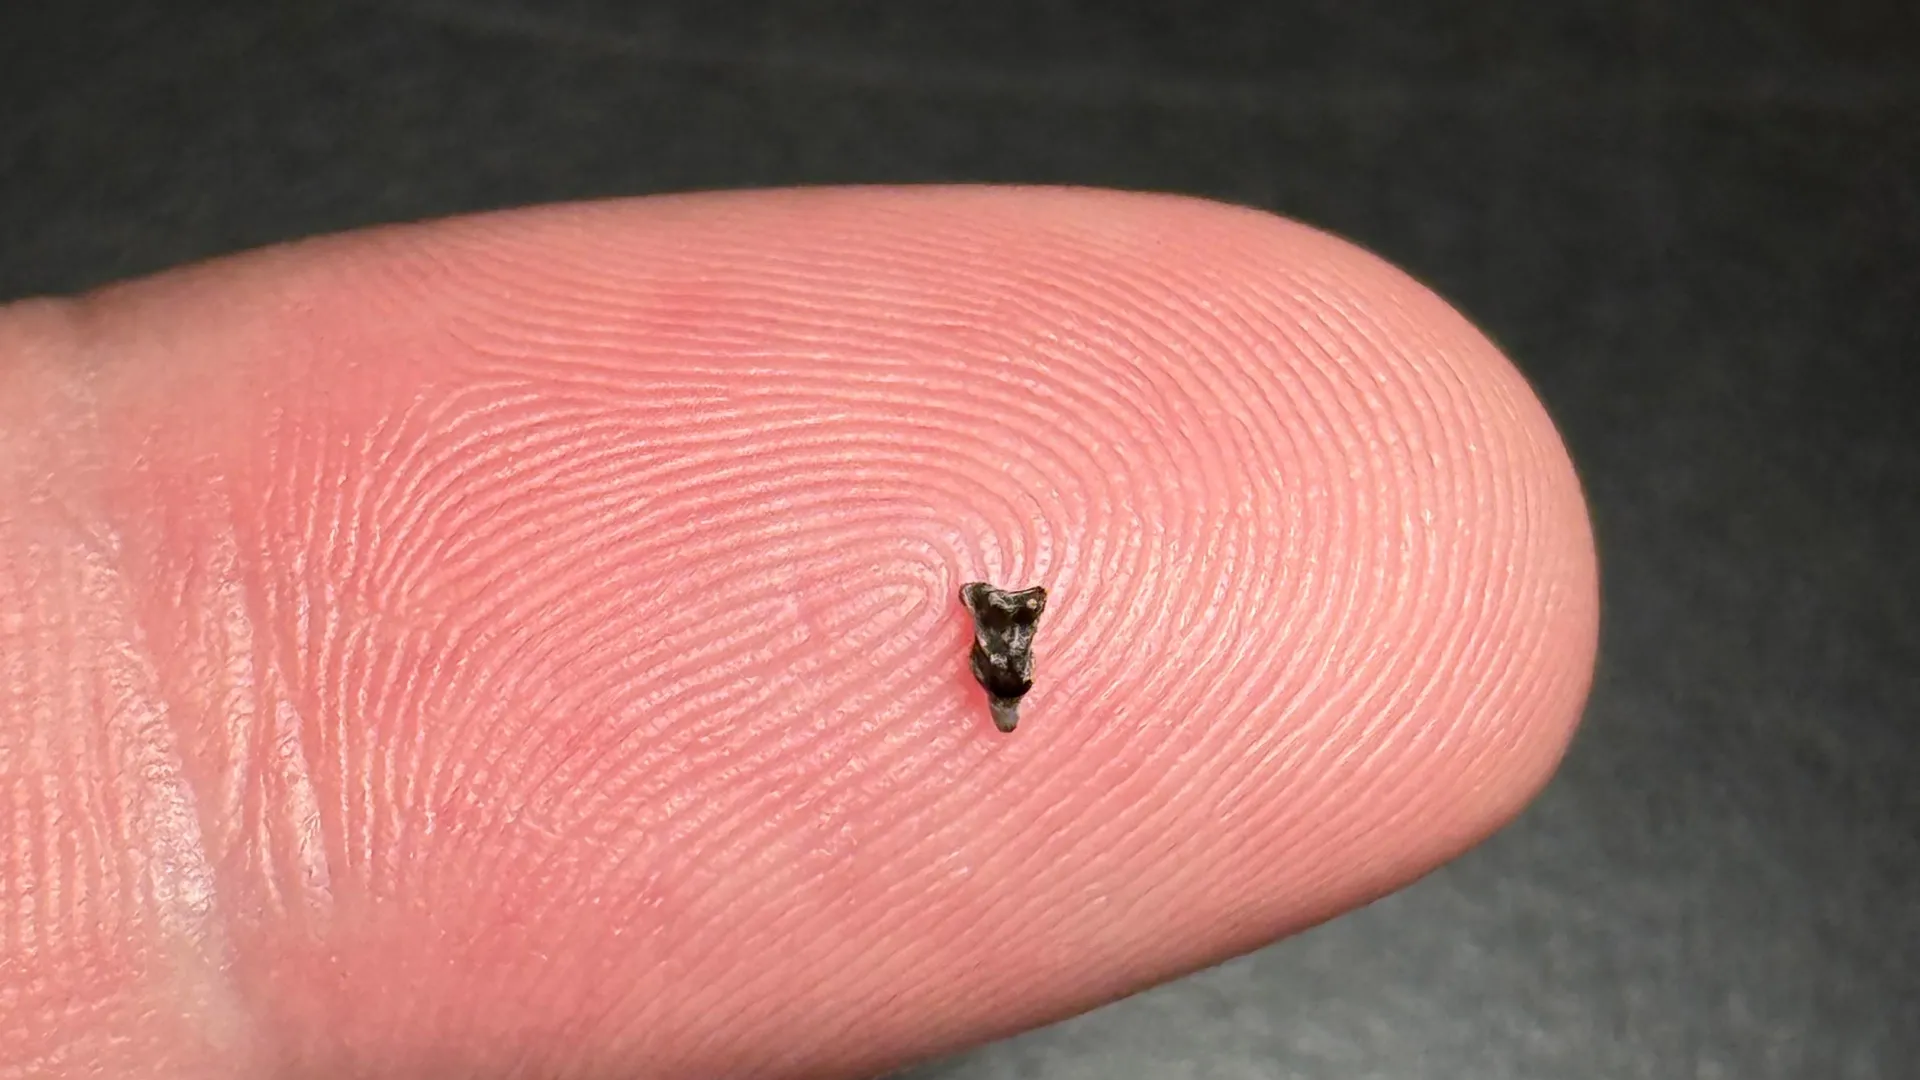
Scientists have uncovered tiny new fossils of Purgatorius, the earliest known relative of all primates, including humans, in a more southern part of North America than ever before. The discovery is offering fresh insight into how primates first…
Category: 7. Science
-
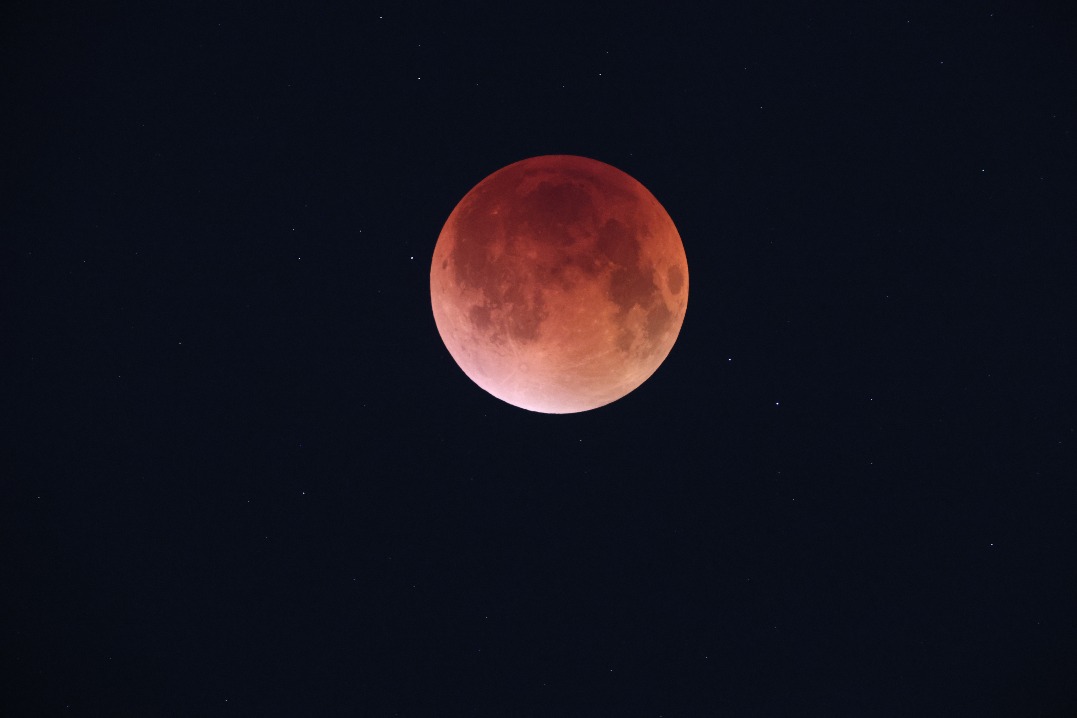
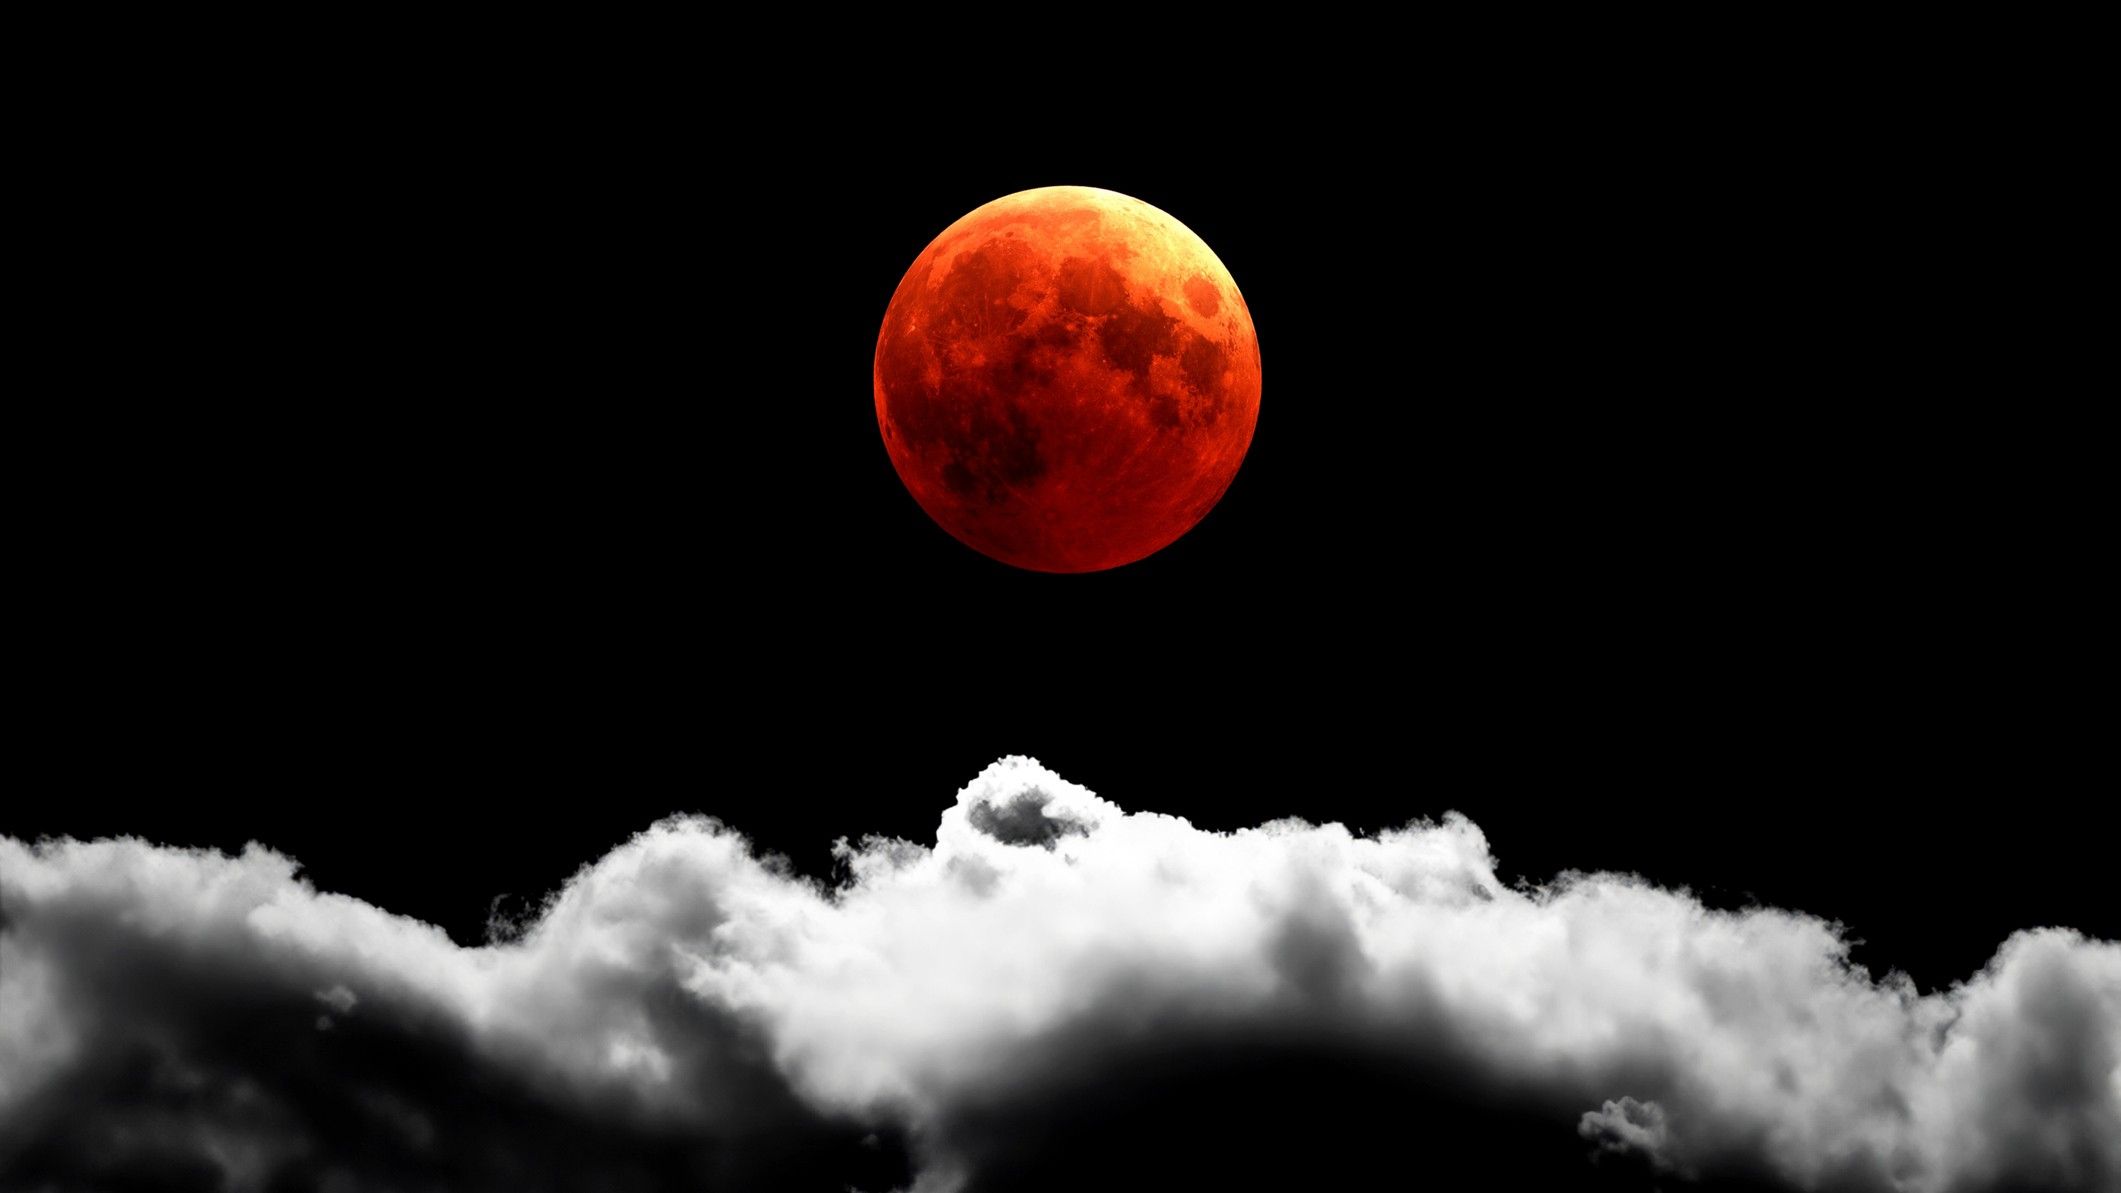
Blood Moon to light up the sky on March 3
Lunar eclipses occur when Earth moves directly between the Sun and the Moon, causing Earth’s shadow to fall across the lunar surface. The March 3 event will be a total lunar eclipse, meaning the Moon will pass fully into the…
Continue Reading
-
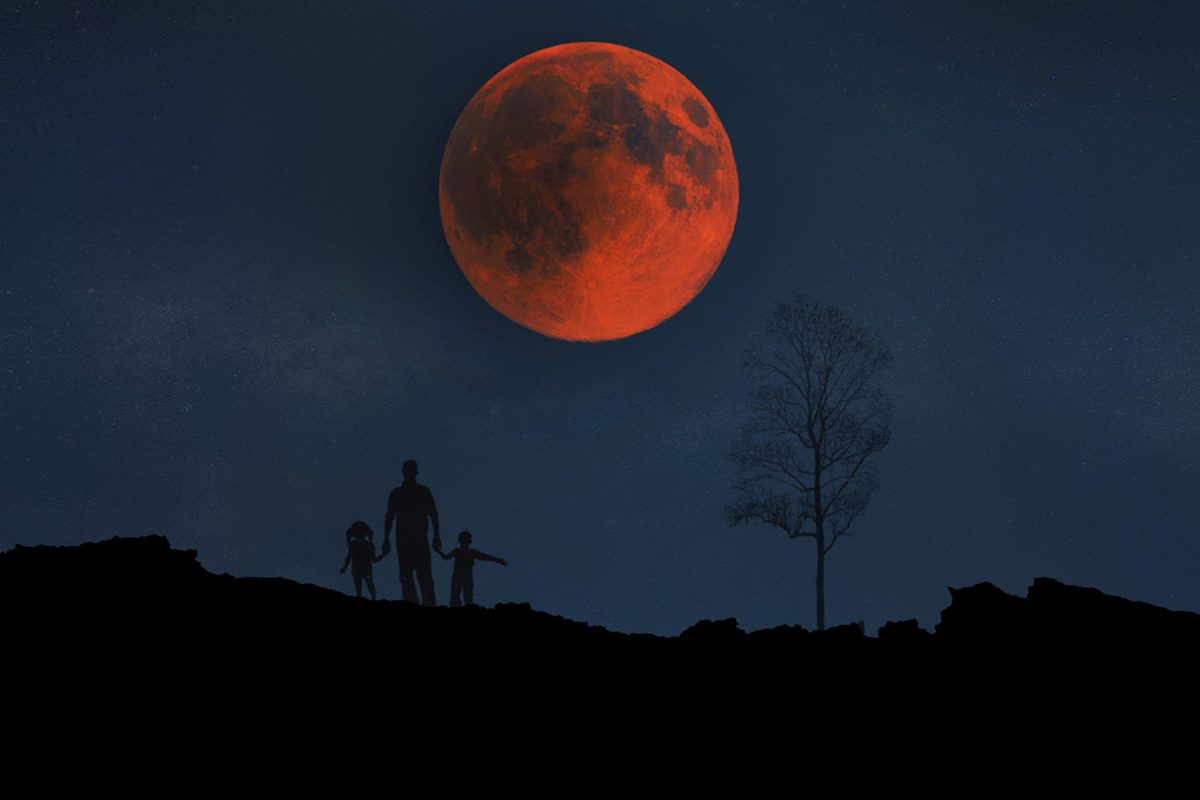
‘Blood moon’ to grace Lantern Festival skies across eastern Asia
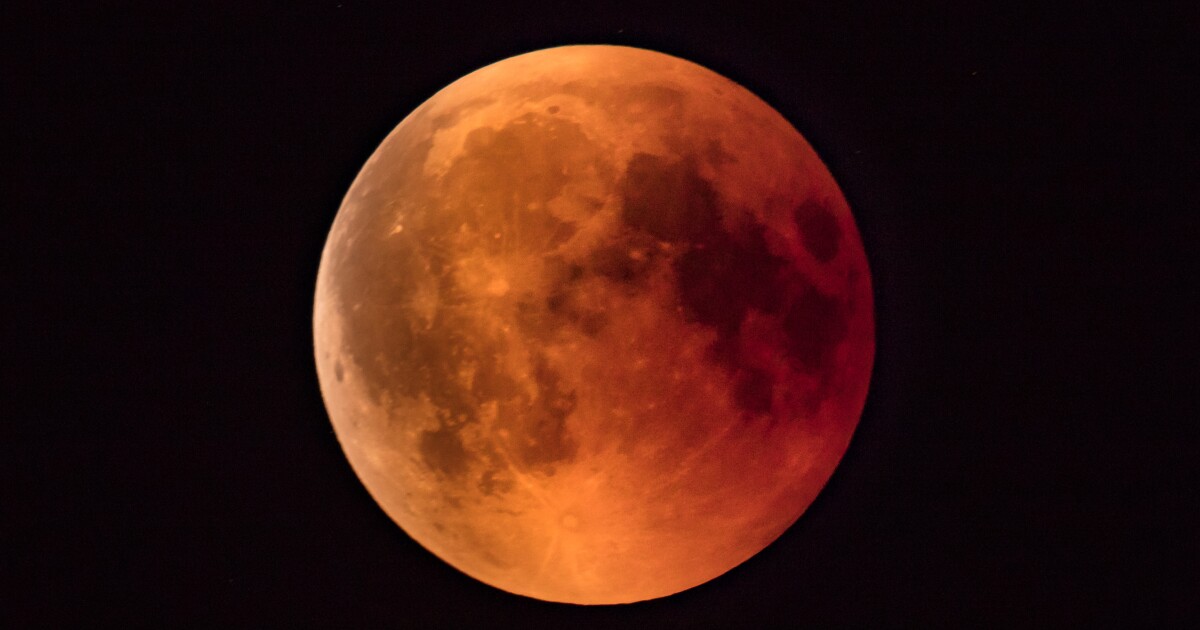
A “blood moon” captured on Sept 8 last year. Photo by Tang Haiming/For chinadaily.com.cn
Some parts of China are expected to see this year”s first “blood moon” around 7 pm on Tuesday, coinciding with…
Continue Reading
-

‘Blood moon’ set to rise over Hong Kong but clouds, rain may get in the way
This story has been made freely available as a public service to our readers. Please consider supporting SCMP’s journalism by subscribing.Hong Kong is set to witness a rare total lunar eclipse on Tuesday night, but the weather forecaster warns…
Continue Reading
-
Observing the blood Moon right now? Quick facts and smartphone tips to catch the lunar eclipse at its best
If you’re out looking at the lunar eclipse this morning – or tonight, depending on where you’re observing from – here are some quick tips to help you make the most of it.
The total lunar eclipse of March 3, 2026 is your last chance to see a…
Continue Reading
-
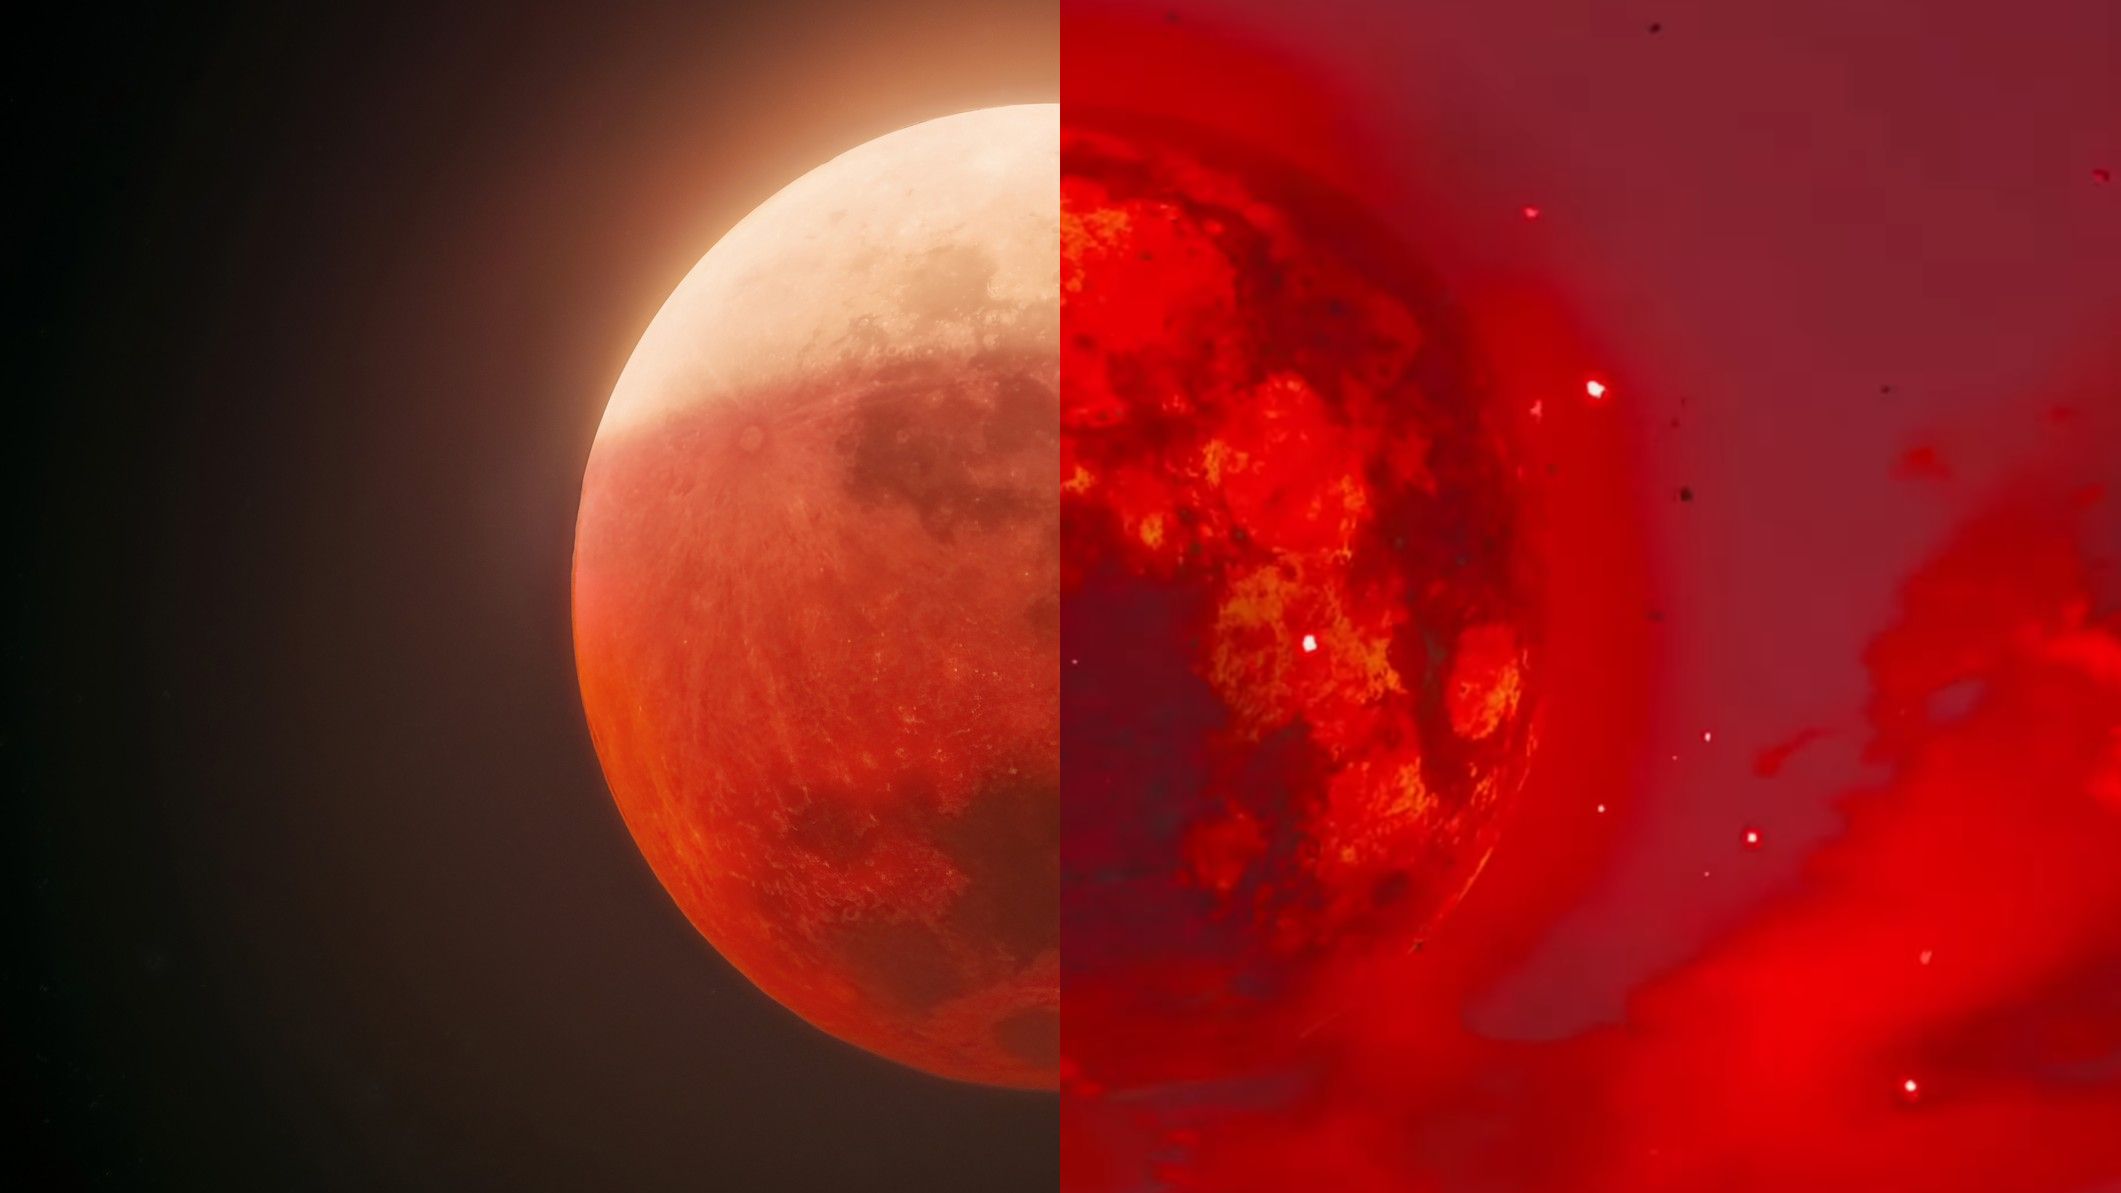
From Hyrule to the heavens: Here’s what ‘The Legend of Zelda’ gets right (and wrong) about the blood moon
March 3rd brings a rare, striking, and rather ominous spectacle to the nighttime sky in the form of a blood moon, a total lunar eclipse that occurs when Earth passes directly between the Sun and the Moon. For many cultures throughout history,…
Continue Reading
-
Total lunar eclipse weather forecast — Will US skies be clear for the blood moon?
As viewing prospects for Tuesday (March 3) morning’s total lunar eclipse are concerned, it seems that about half of the nation will have at least some occasional views of the moon plunging through the Earth’s dark shadow. The totality — aka…
Continue Reading
-
‘Blood moon’ total lunar eclipse coming Tuesday
Early Tuesday morning, a total lunar eclipse will occur.
A total lunar eclipse, often nicknamed a “blood moon” because of its reddish hue, takes place when the moon passes through Earth’s shadow…
Continue Reading
-
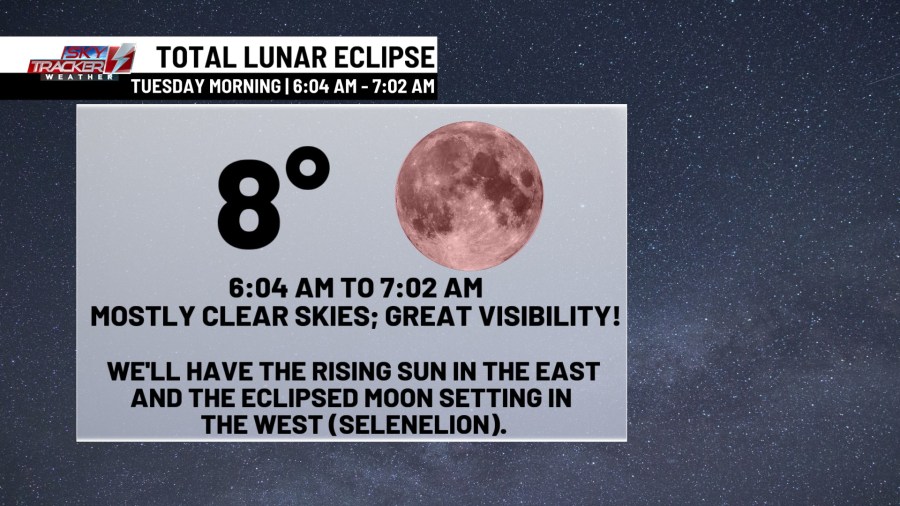
Total lunar eclipse will peak Tuesday morning
Make it a point to get up early tomorrow morning. Here are more details about Tuesday’s total lunar eclipse!
Timing: Totality will last about 58 minutes from 6:04 AM to 7:02 AM. That’s when the moon is set to glow a reddish-brownish hue.
Continue Reading

'Blood moon' to dazzle stargazers on March 3 – news.cgtn.com
- ‘Blood moon’ to dazzle stargazers on March 3 news.cgtn.com
- Where to see the total lunar eclipse in the early hours of March 3 Space
- Rare ‘blood moon’ total lunar eclipse to loom over North America, Australia and New Zealand The Guardian
- How…
Continue Reading