
…
Category: 7. Science
-
NCAR: New Research Takes 1st Step Toward Advance Warnings of Space Weather – HPCwire
- NCAR: New Research Takes 1st Step Toward Advance Warnings of Space Weather HPCwire
- New research takes first step toward advance warnings of space weather University Corporation for Atmospheric Research
- Surprise solar eruptions on sun’s far side…
Continue Reading
-

Tiny Vortices Reveal New Superconductivity Mechanism
Scientists are increasingly focused on understanding the unusual superconducting properties emerging in kagome materials, and a new theoretical study led by Frederik A. S. Philipsen and Mats Barkman, both from the Niels Bohr Institute,…
Continue Reading
-

Chinese researchers develop AI model to process stellar data from different telescopes-Xinhua
Photo taken on June 19, 2015 shows the Large Sky Area Multi-Object Fibre Spectroscopy Telescope (LAMOST) at the Xinglong observation station of the National Astronomical Observatories under the Chinese Academy of Sciences in Xinglong, north… Continue Reading
-

AI Predicts Experiment Outcomes Using Game Theory
Scientists are exploring new avenues to reconcile quantum theory with classical physics by challenging fundamental assumptions about free choice in experiments. Florian Pauschitz from ETH Zurich, Ben Moseley from Imperial College, and Ghislain…
Continue Reading
-

NASA study finds ancient life could survive 50 million years in Martian ice
Future missions to Mars may want to dig into ice rather than rock. Scientists say ancient microbes, or traces of them, could be locked inside Martian ice deposits, preserved for tens of millions of years.
Researchers from NASA Goddard Space…
Continue Reading
-

What’s behind the evolution of Earth’s deep interior?
According to a new study, researchers have…
Continue Reading
-
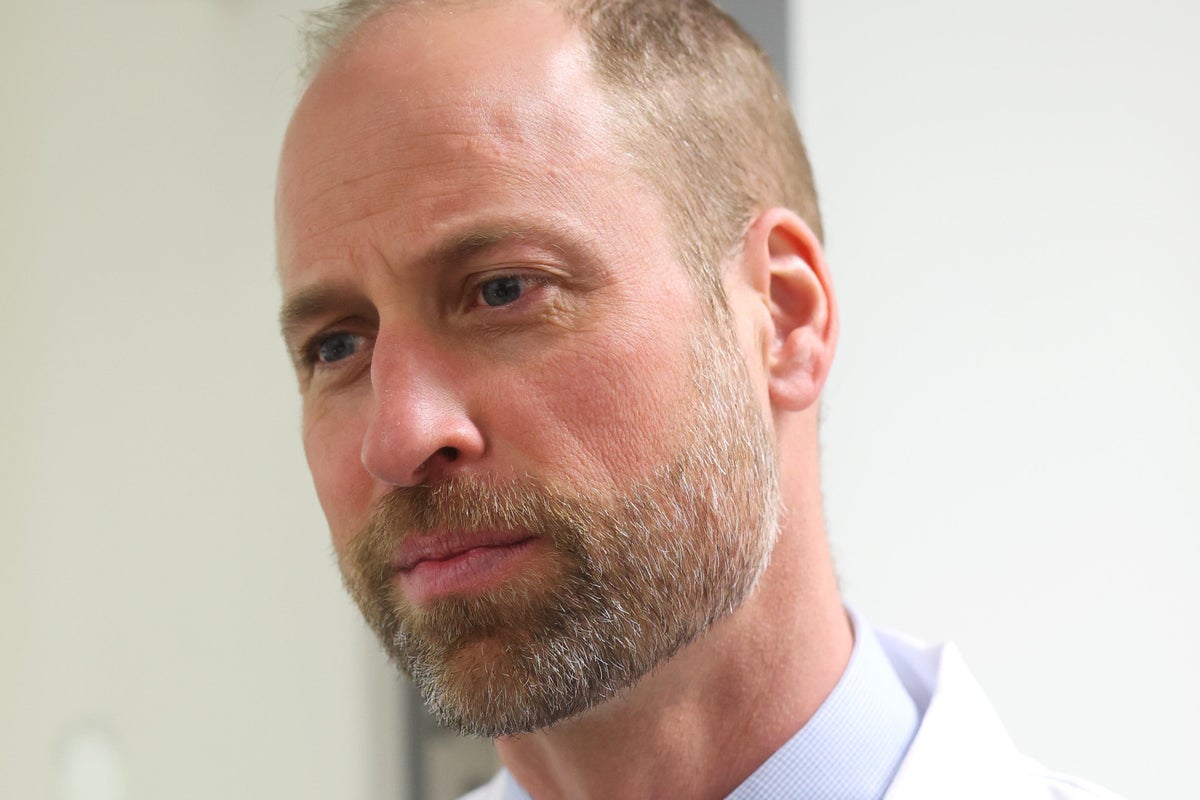
William told he is ‘doing a great job’ handling mouse sample during lab visit
The Prince of Wales was told there was a job going after he was praised for how he handled a…
Continue Reading
-
Swirling beauty of the Milky Way galaxy's heart is captured in a new telescope picture – SFGATE
- Swirling beauty of the Milky Way galaxy’s heart is captured in a new telescope picture SFGATE
- Largest image of its kind shows hidden chemistry at the heart of the Milky Way EurekAlert!
- ‘A place of extremes’: Scientists unveil the largest-ever map…
Continue Reading
-
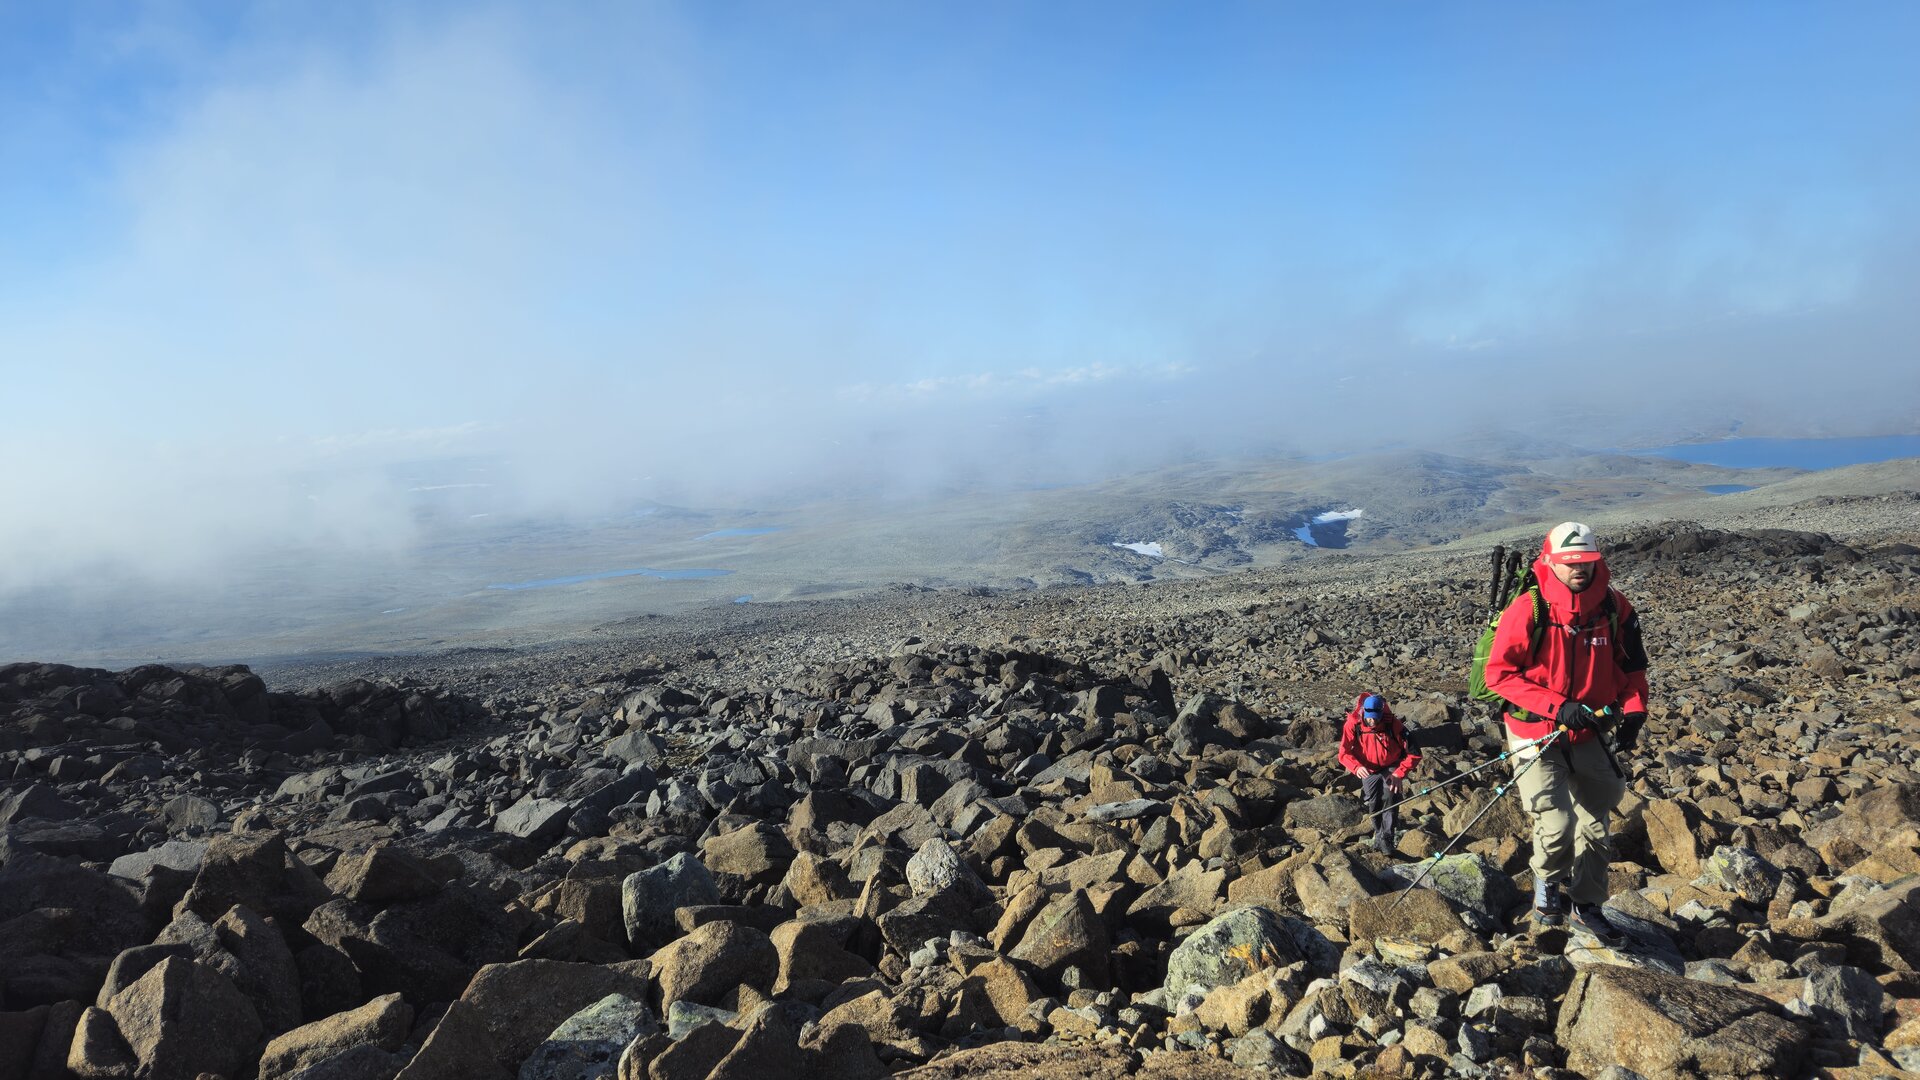
Connecting a jacket to space to save lives
Applications 25/02/2026
2 views
0 likesThe future of satellite-connected wearables is closer to becoming an everyday reality thanks to the world’s first-ever two-way S-band connectivity from a…
Continue Reading