
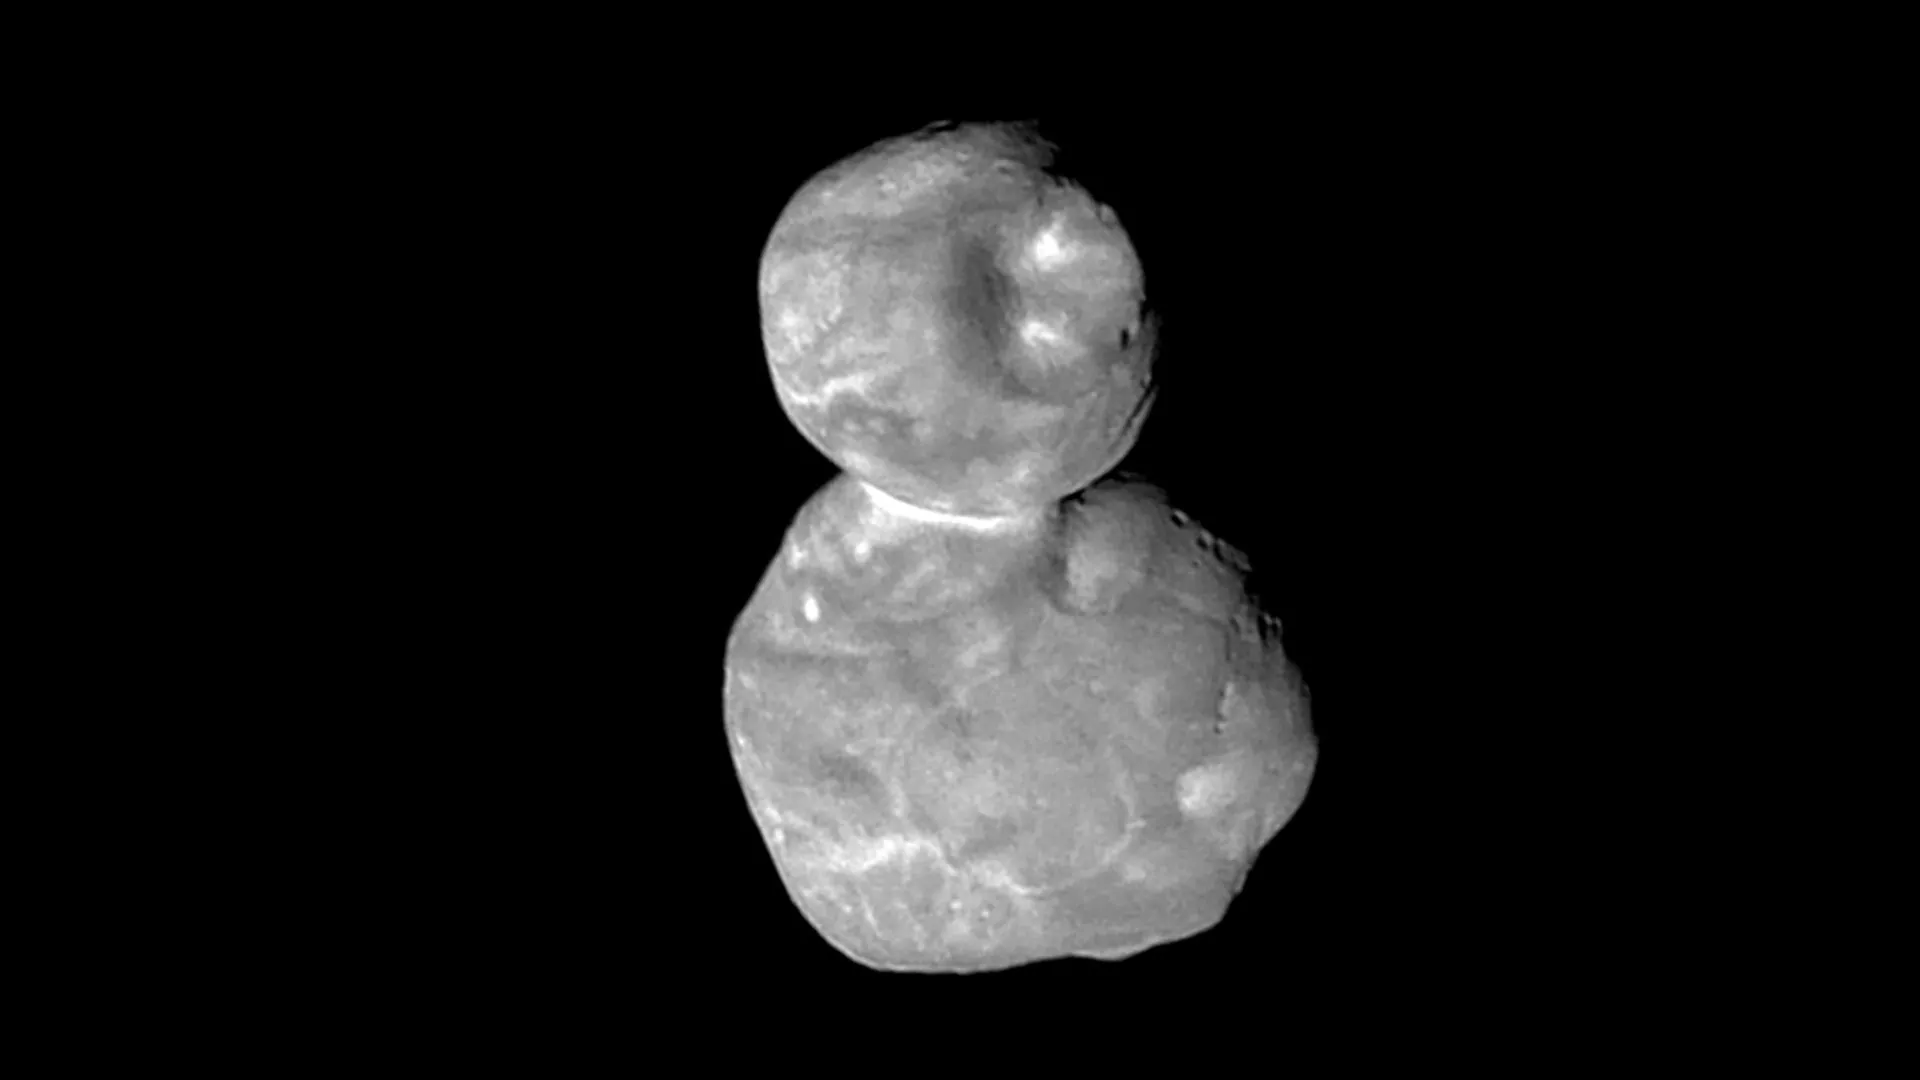
For decades, astronomers have tried to understand why so many icy bodies in the outer solar system resemble snowmen, with two rounded sections joined together. Researchers at Michigan State University now report evidence pointing to a…
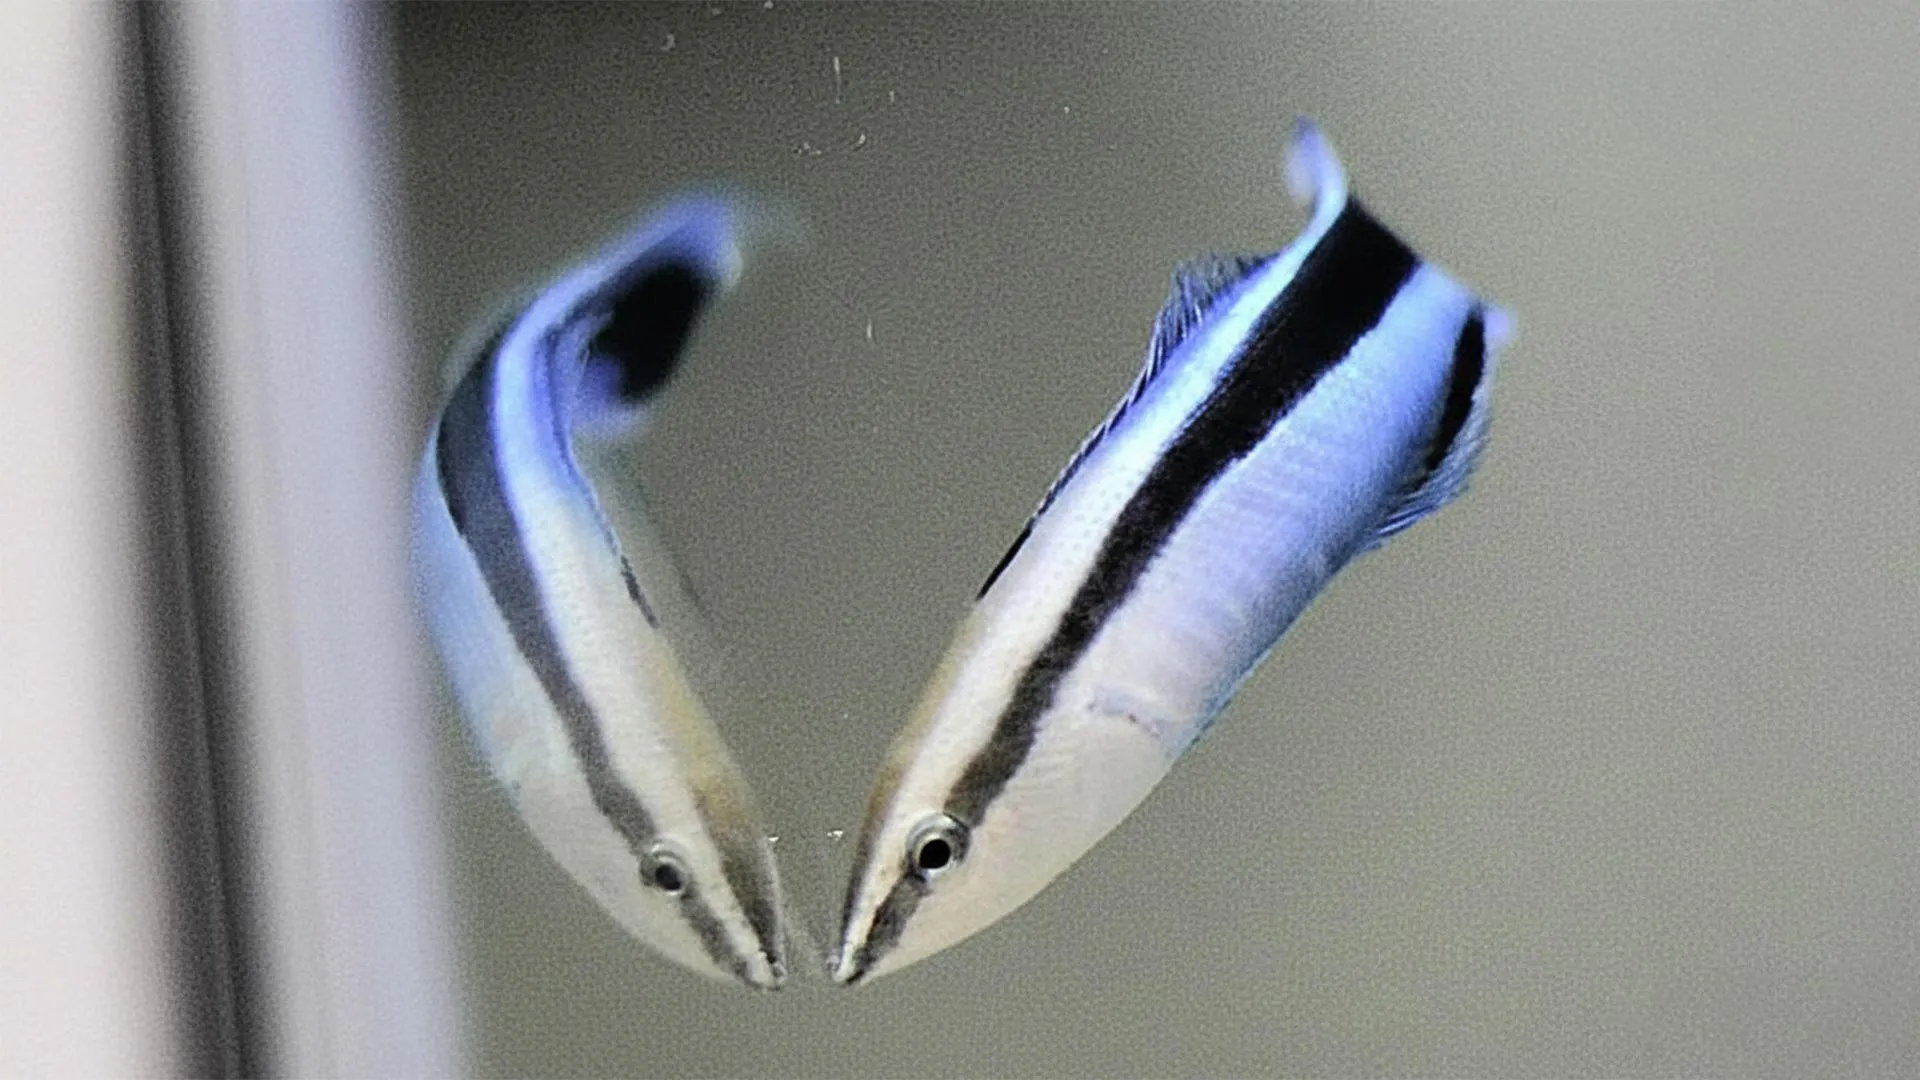
Scientists at Osaka Metropolitan University in Japan have identified a newly documented behavior in cleaner wrasse (Labroides dimidiatus). When the small reef fish were given access to a mirror, they did more than simply recognize their…
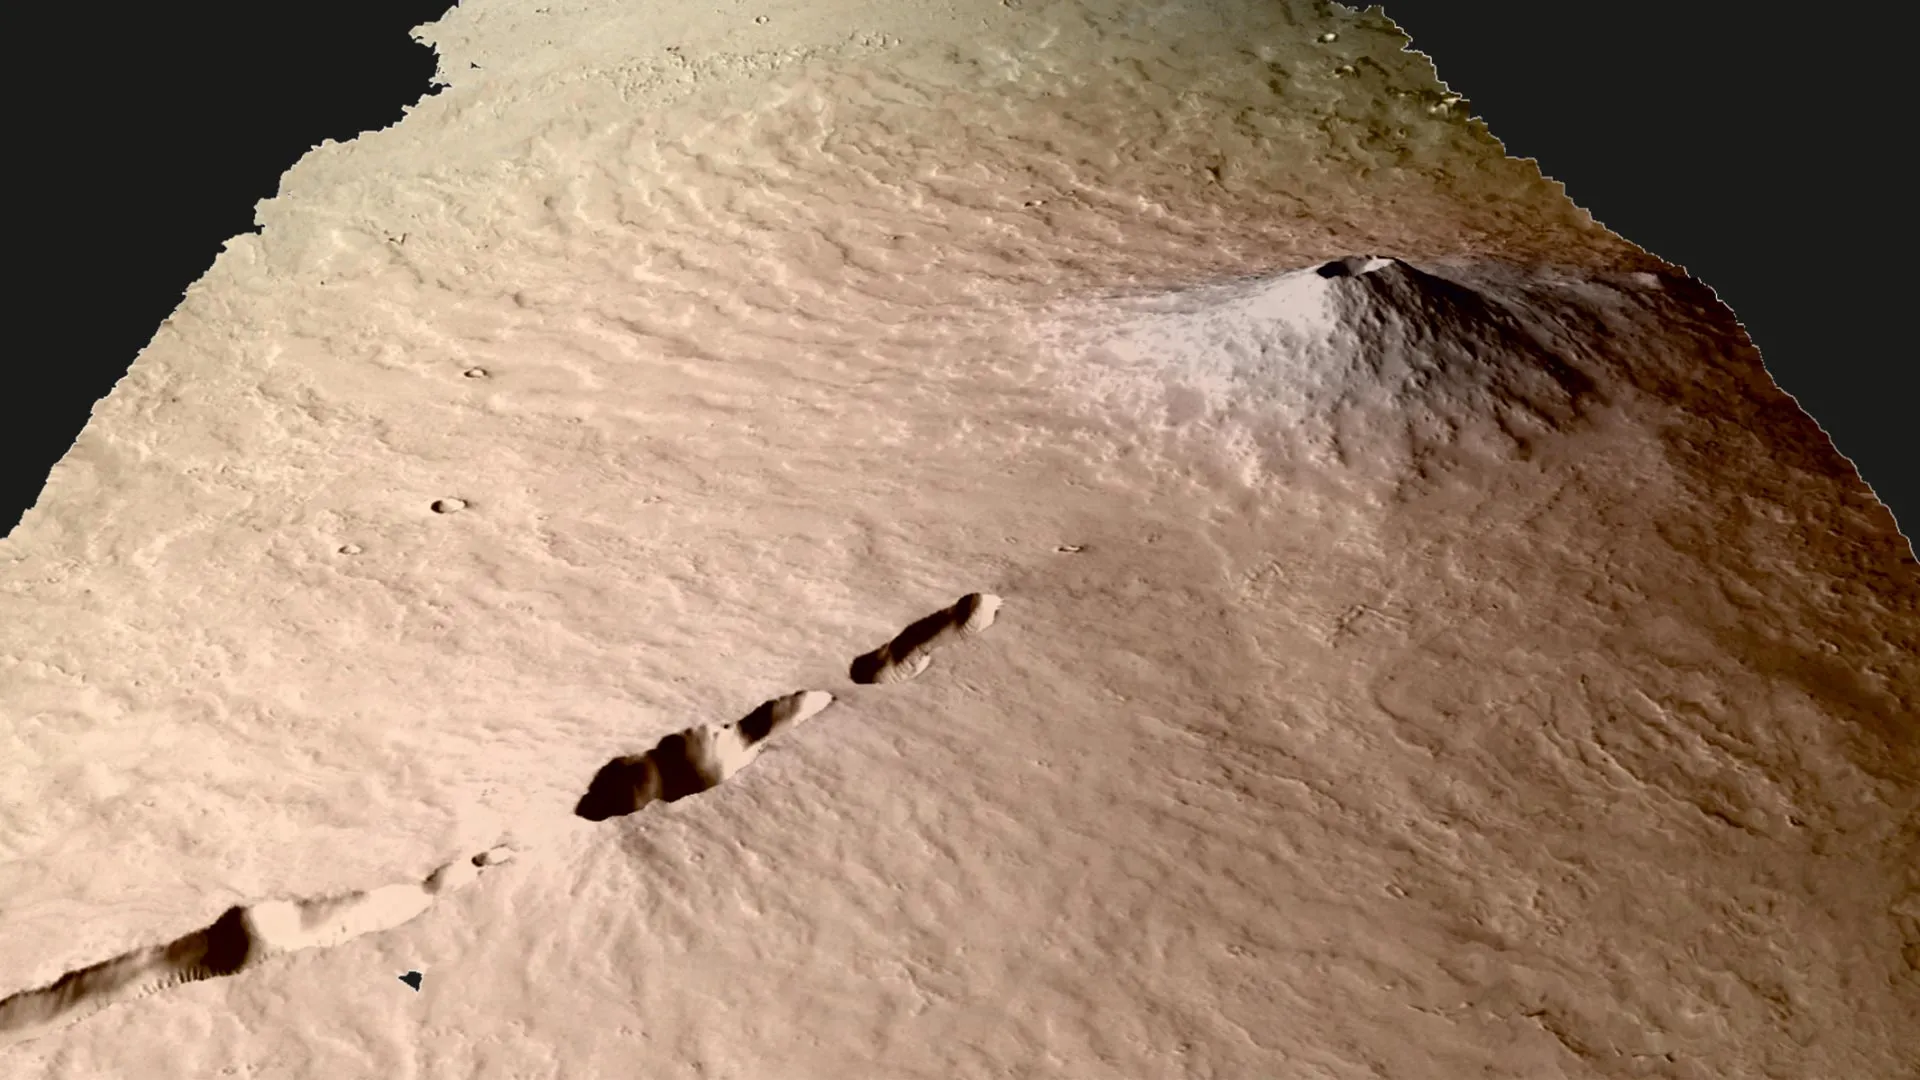
Volcanic eruptions that look like single events are often the visible outcome of slow, complicated activity taking place deep underground. Beneath the surface, magma shifts position, changes chemically, and can sit for long stretches before…
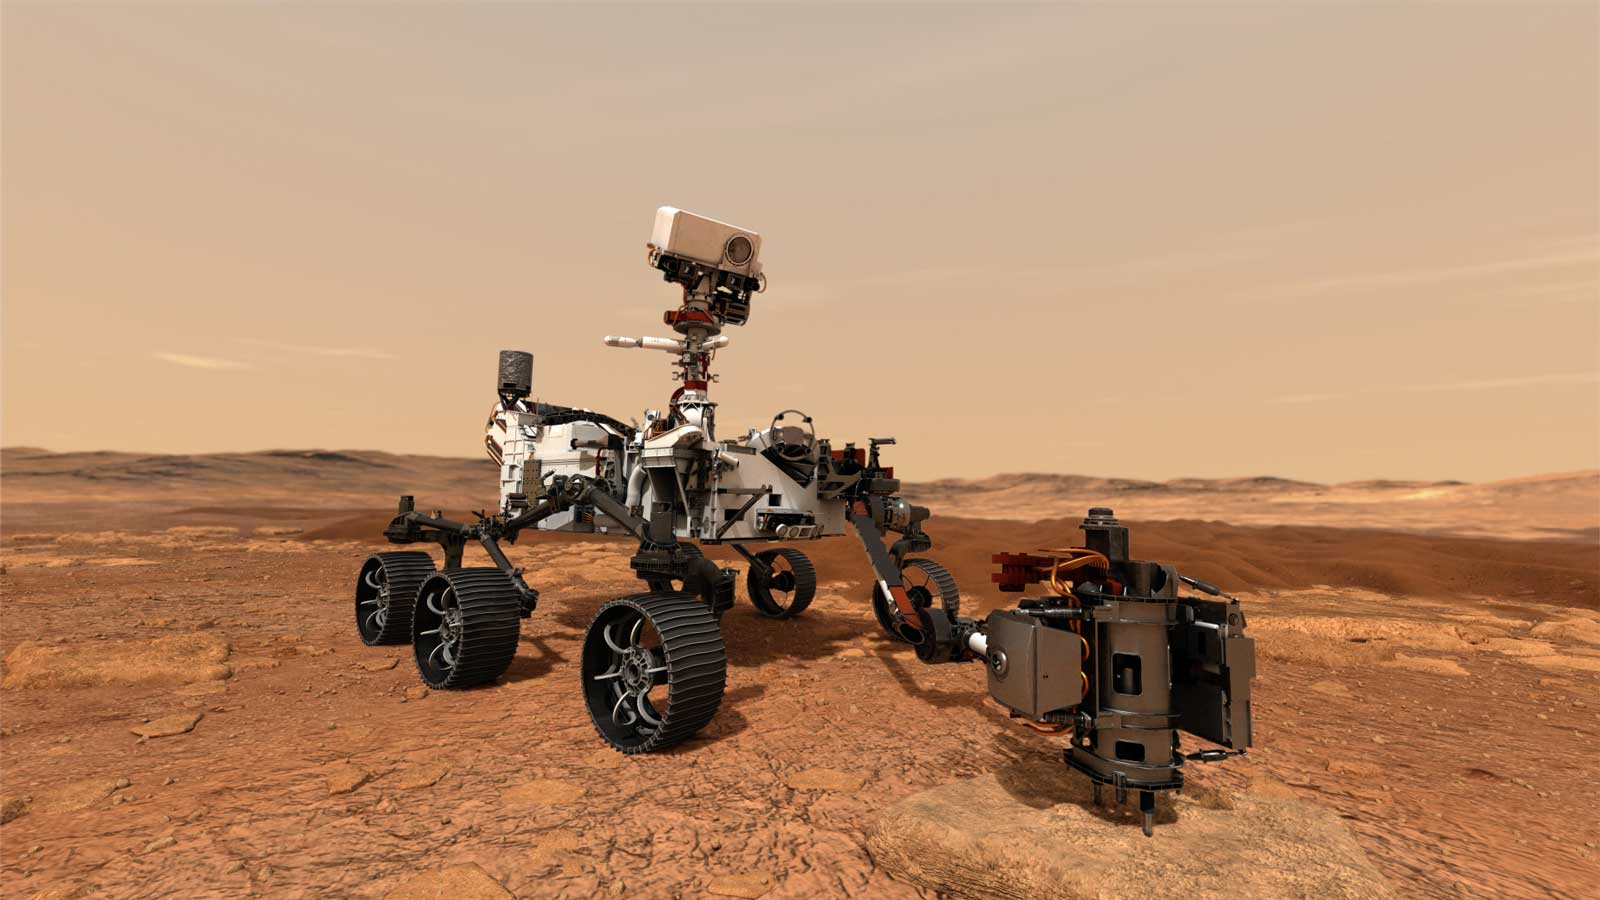
NASA has revealed it repurposed the processor the Perseverance rover used to communicate with the Ingenuity Mars Helicopter, to help the rolling robot navigate the Red Planet autonomously “for potentially unlimited distances.”
The aerospace…
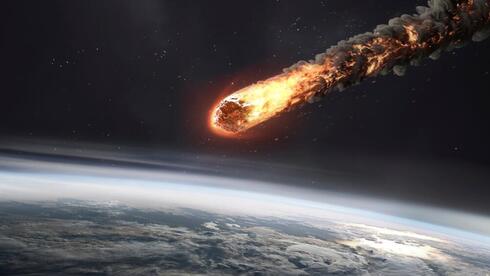
Tektites are created when rock liquefied by an impact is ejected into the air,…
Pandith, J. A., Neekhra, S., Ahmad, S. & Sheikh, R. A. Recent developments in space food for exploration missions: a review. Life Sci. Space Res. 36, 123–134, https://doi.org/10.1016/j.lssr.2022.09.007 (2023).
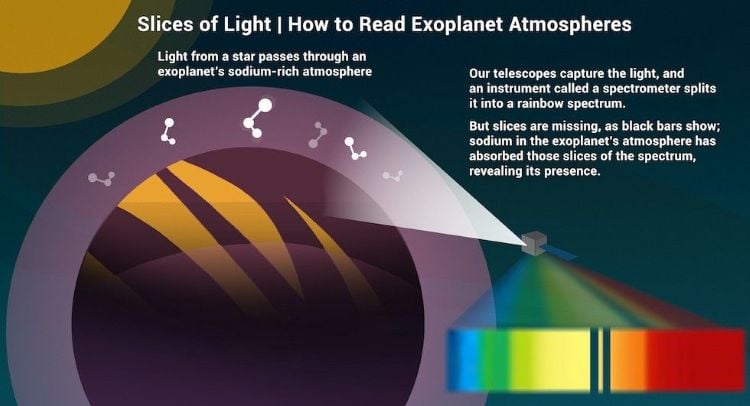
Searching for life beyond Earth has rapidly advanced in recent years. However, directly imaging an exoplanet and all their incredible features remain elusive given the literal astronomical distances from Earth. Therefore, astronomers…
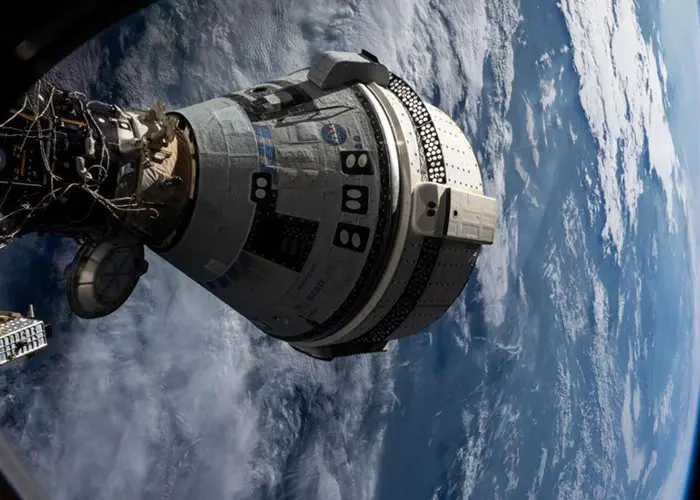
NASA has formally classified Boeing’s CST-100 Starliner Crewed Flight Test as a Type A mishap, the agency’s highest-level incident designation, following the release of an independent investigation into the spacecraft’s troubled 2024…