
China’s armed forces are openly seeking artificial intelligence tools to track undersea targets, analyse satellite orbits, generate deepfakes and fuse battlefield data at speed, according to a sweeping new study of more than 9,000 procurement…
Category: 7. Science
-
Nearsightedness Is Surging Worldwide and the Cause May Be Hiding Indoors – SciTechDaily
- Nearsightedness Is Surging Worldwide and the Cause May Be Hiding Indoors SciTechDaily
- A Clearer Look at the Rise of Myopia the-scientist.com
- It’s Not Just Your Screens: Why So Many People Suddenly Need Glasses Gizmodo
- Dim Indoor Lighting, Not…
Continue Reading
-

Antarctica’s Gravity Hole Growing Stronger, Scientists Find
For decades, scientists have been studying intriguing “gravity holes,” which are enormous depressions in the Earth’s crust where the effects of gravity are significantly lower than average.
It’s an especially pertinent phenomenon…
Continue Reading
-
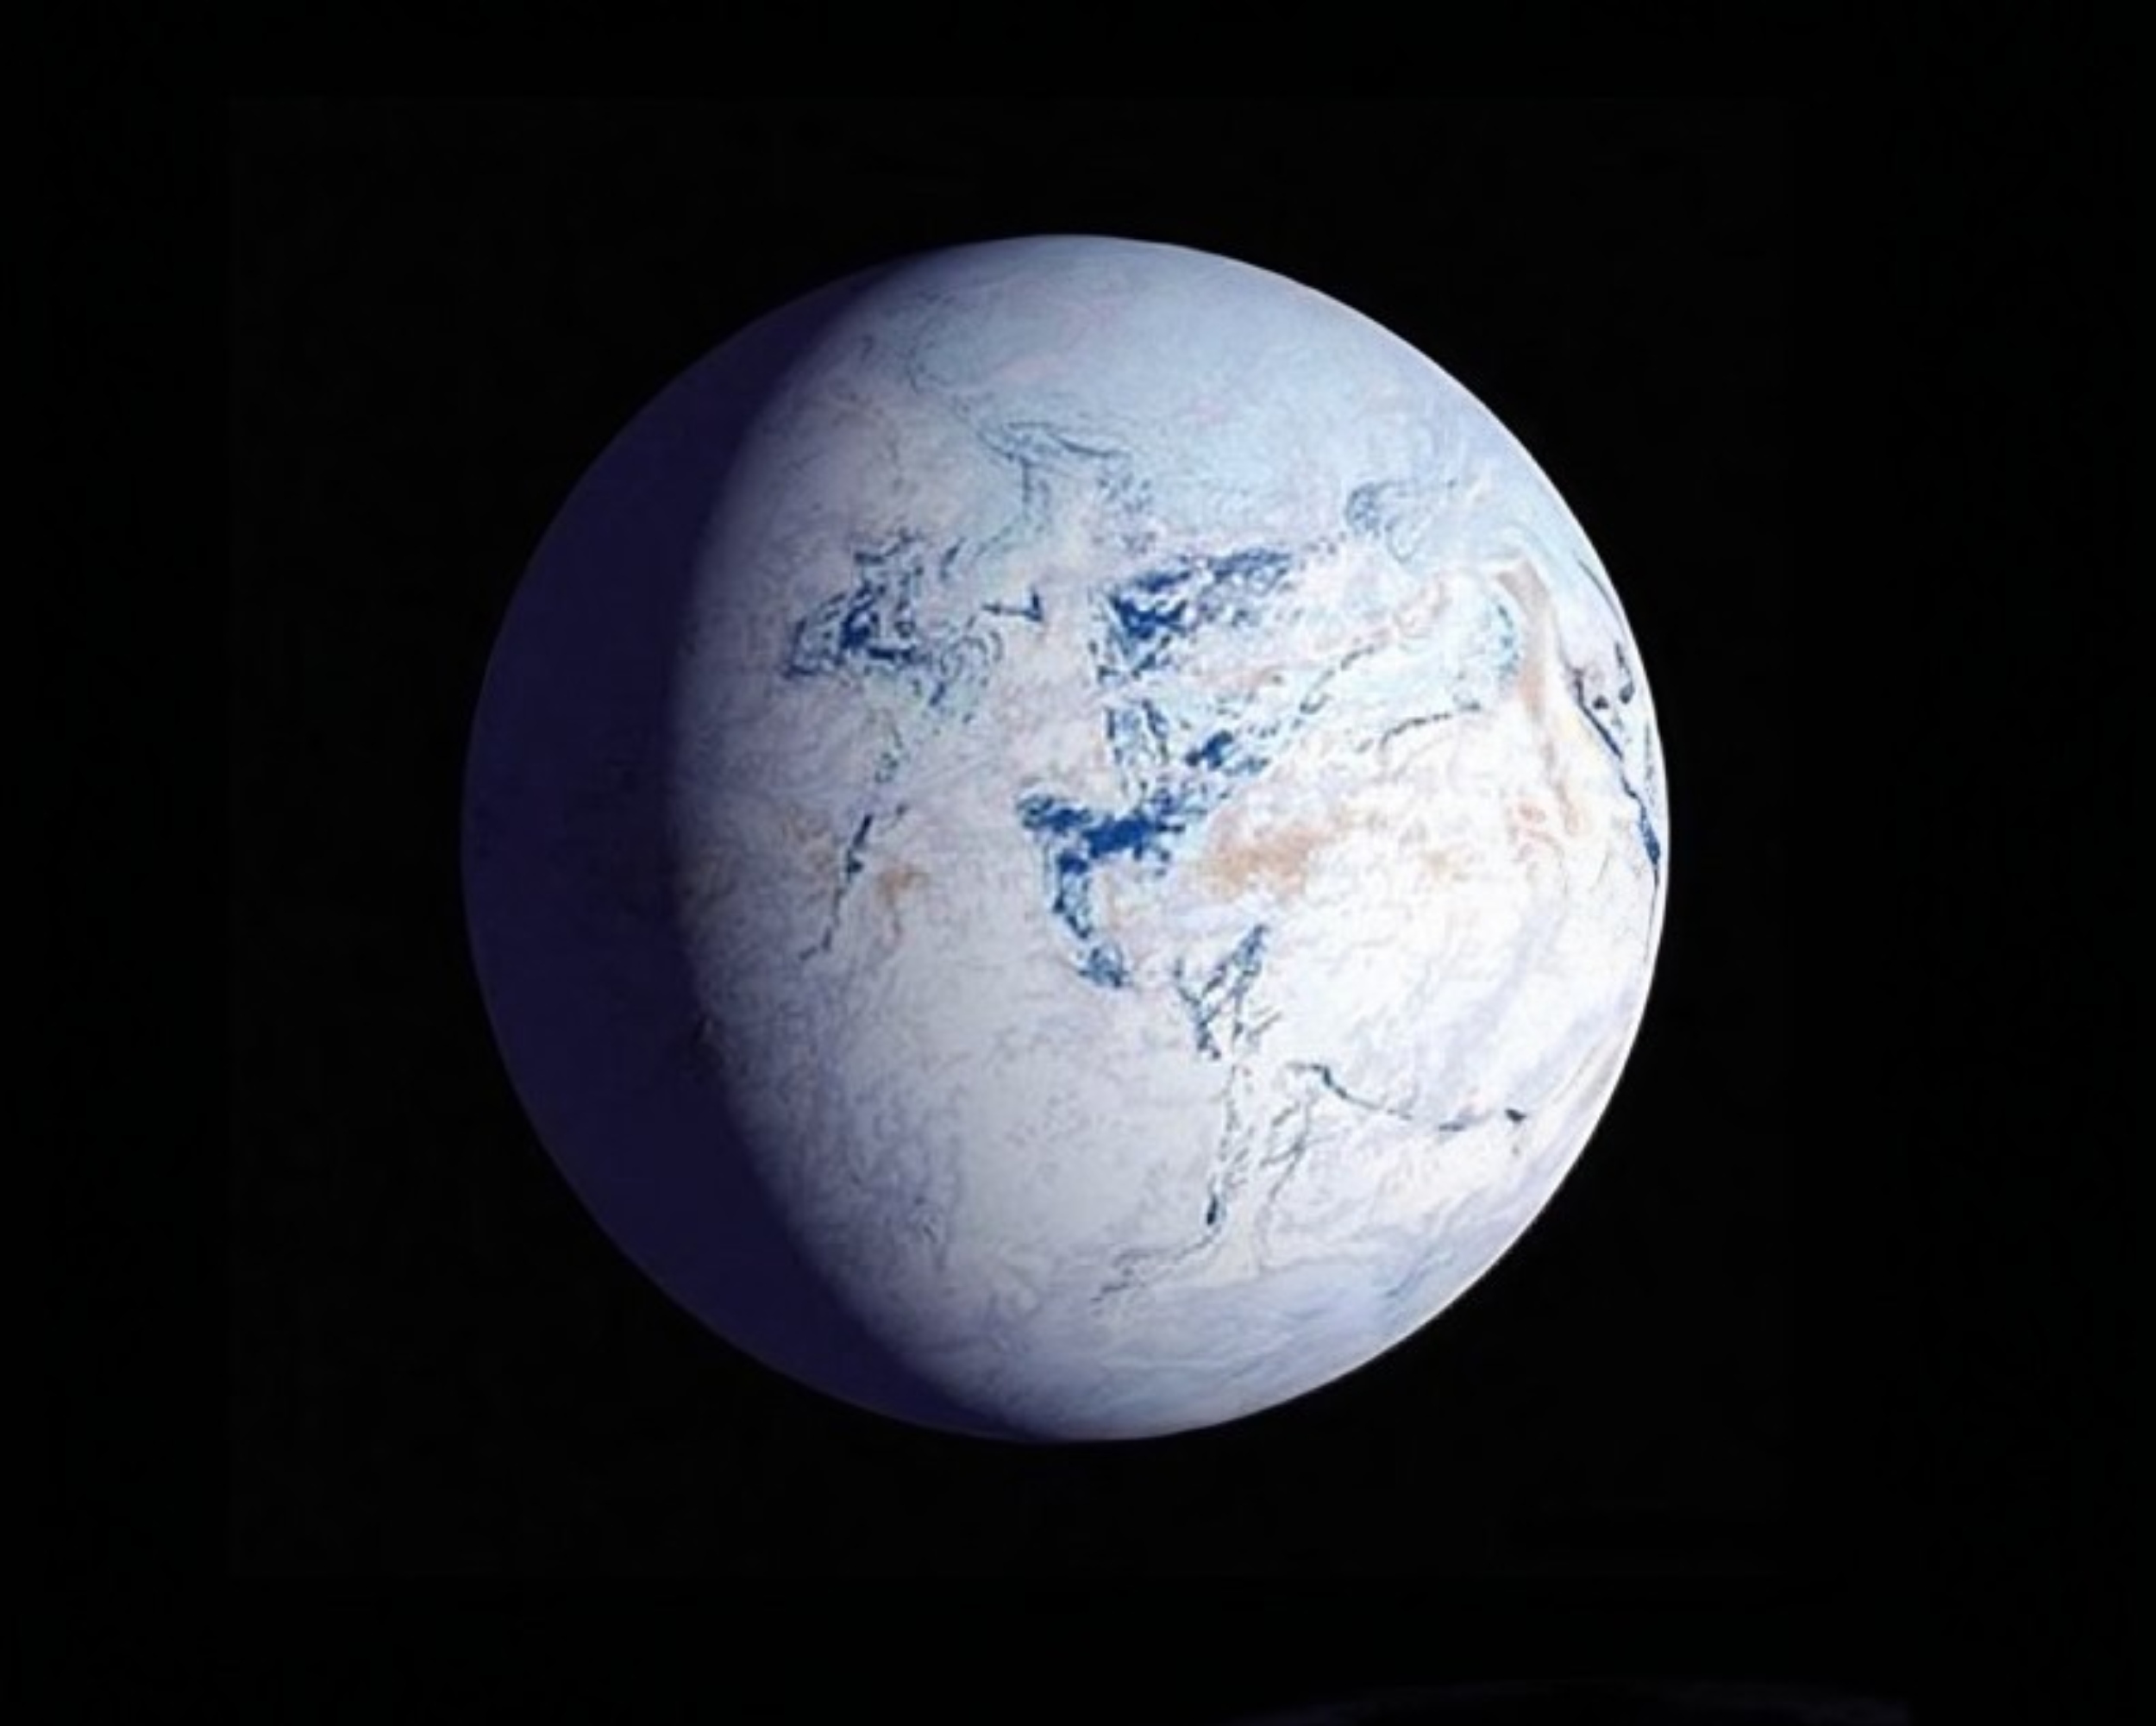
Snowball Earth: Why the planet stayed frozen for 56 million years
A chemical reaction on the ocean floor has emerged as the decisive factor that allowed one planet-wide ice age to last 56 million years while a later freeze ended after just 4 million years.
That result overturns the long-standing assumption that…
Continue Reading
-
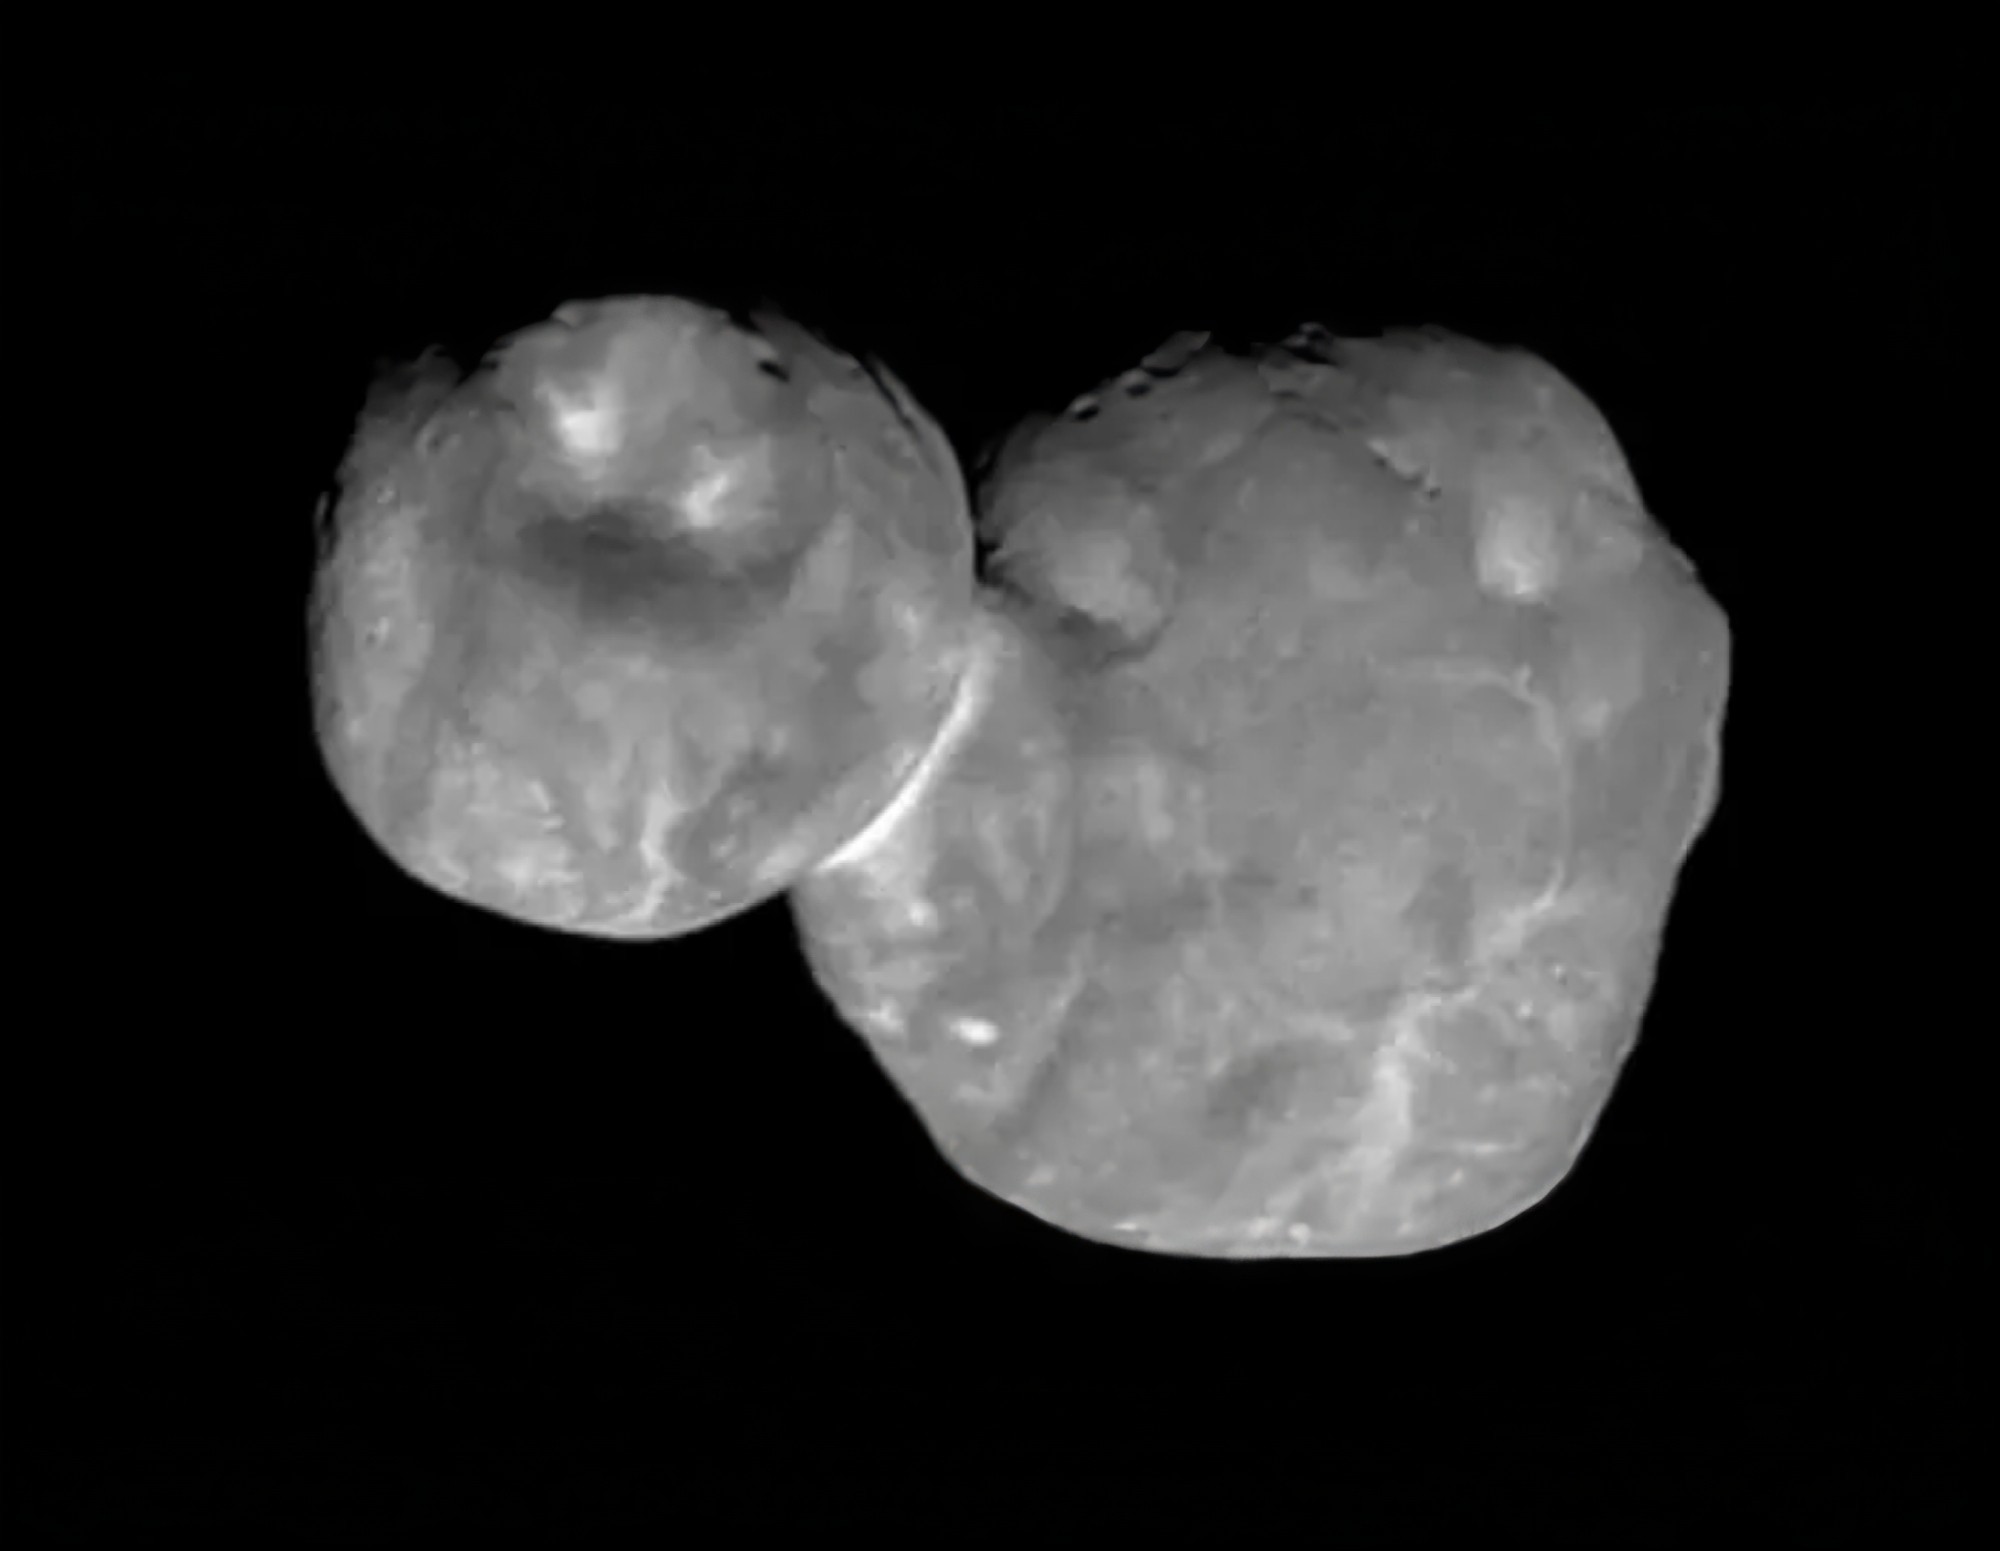
Snowman worlds: How strange shapes appeared in the Kuiper Belt
For years, scientists have debated how the Kuiper Belt’s “snowman” worlds formed. Did two separate bodies collide at just the right speed to stick together – or were they born as pairs from the start?
A new computer simulation now tips the…
Continue Reading
-
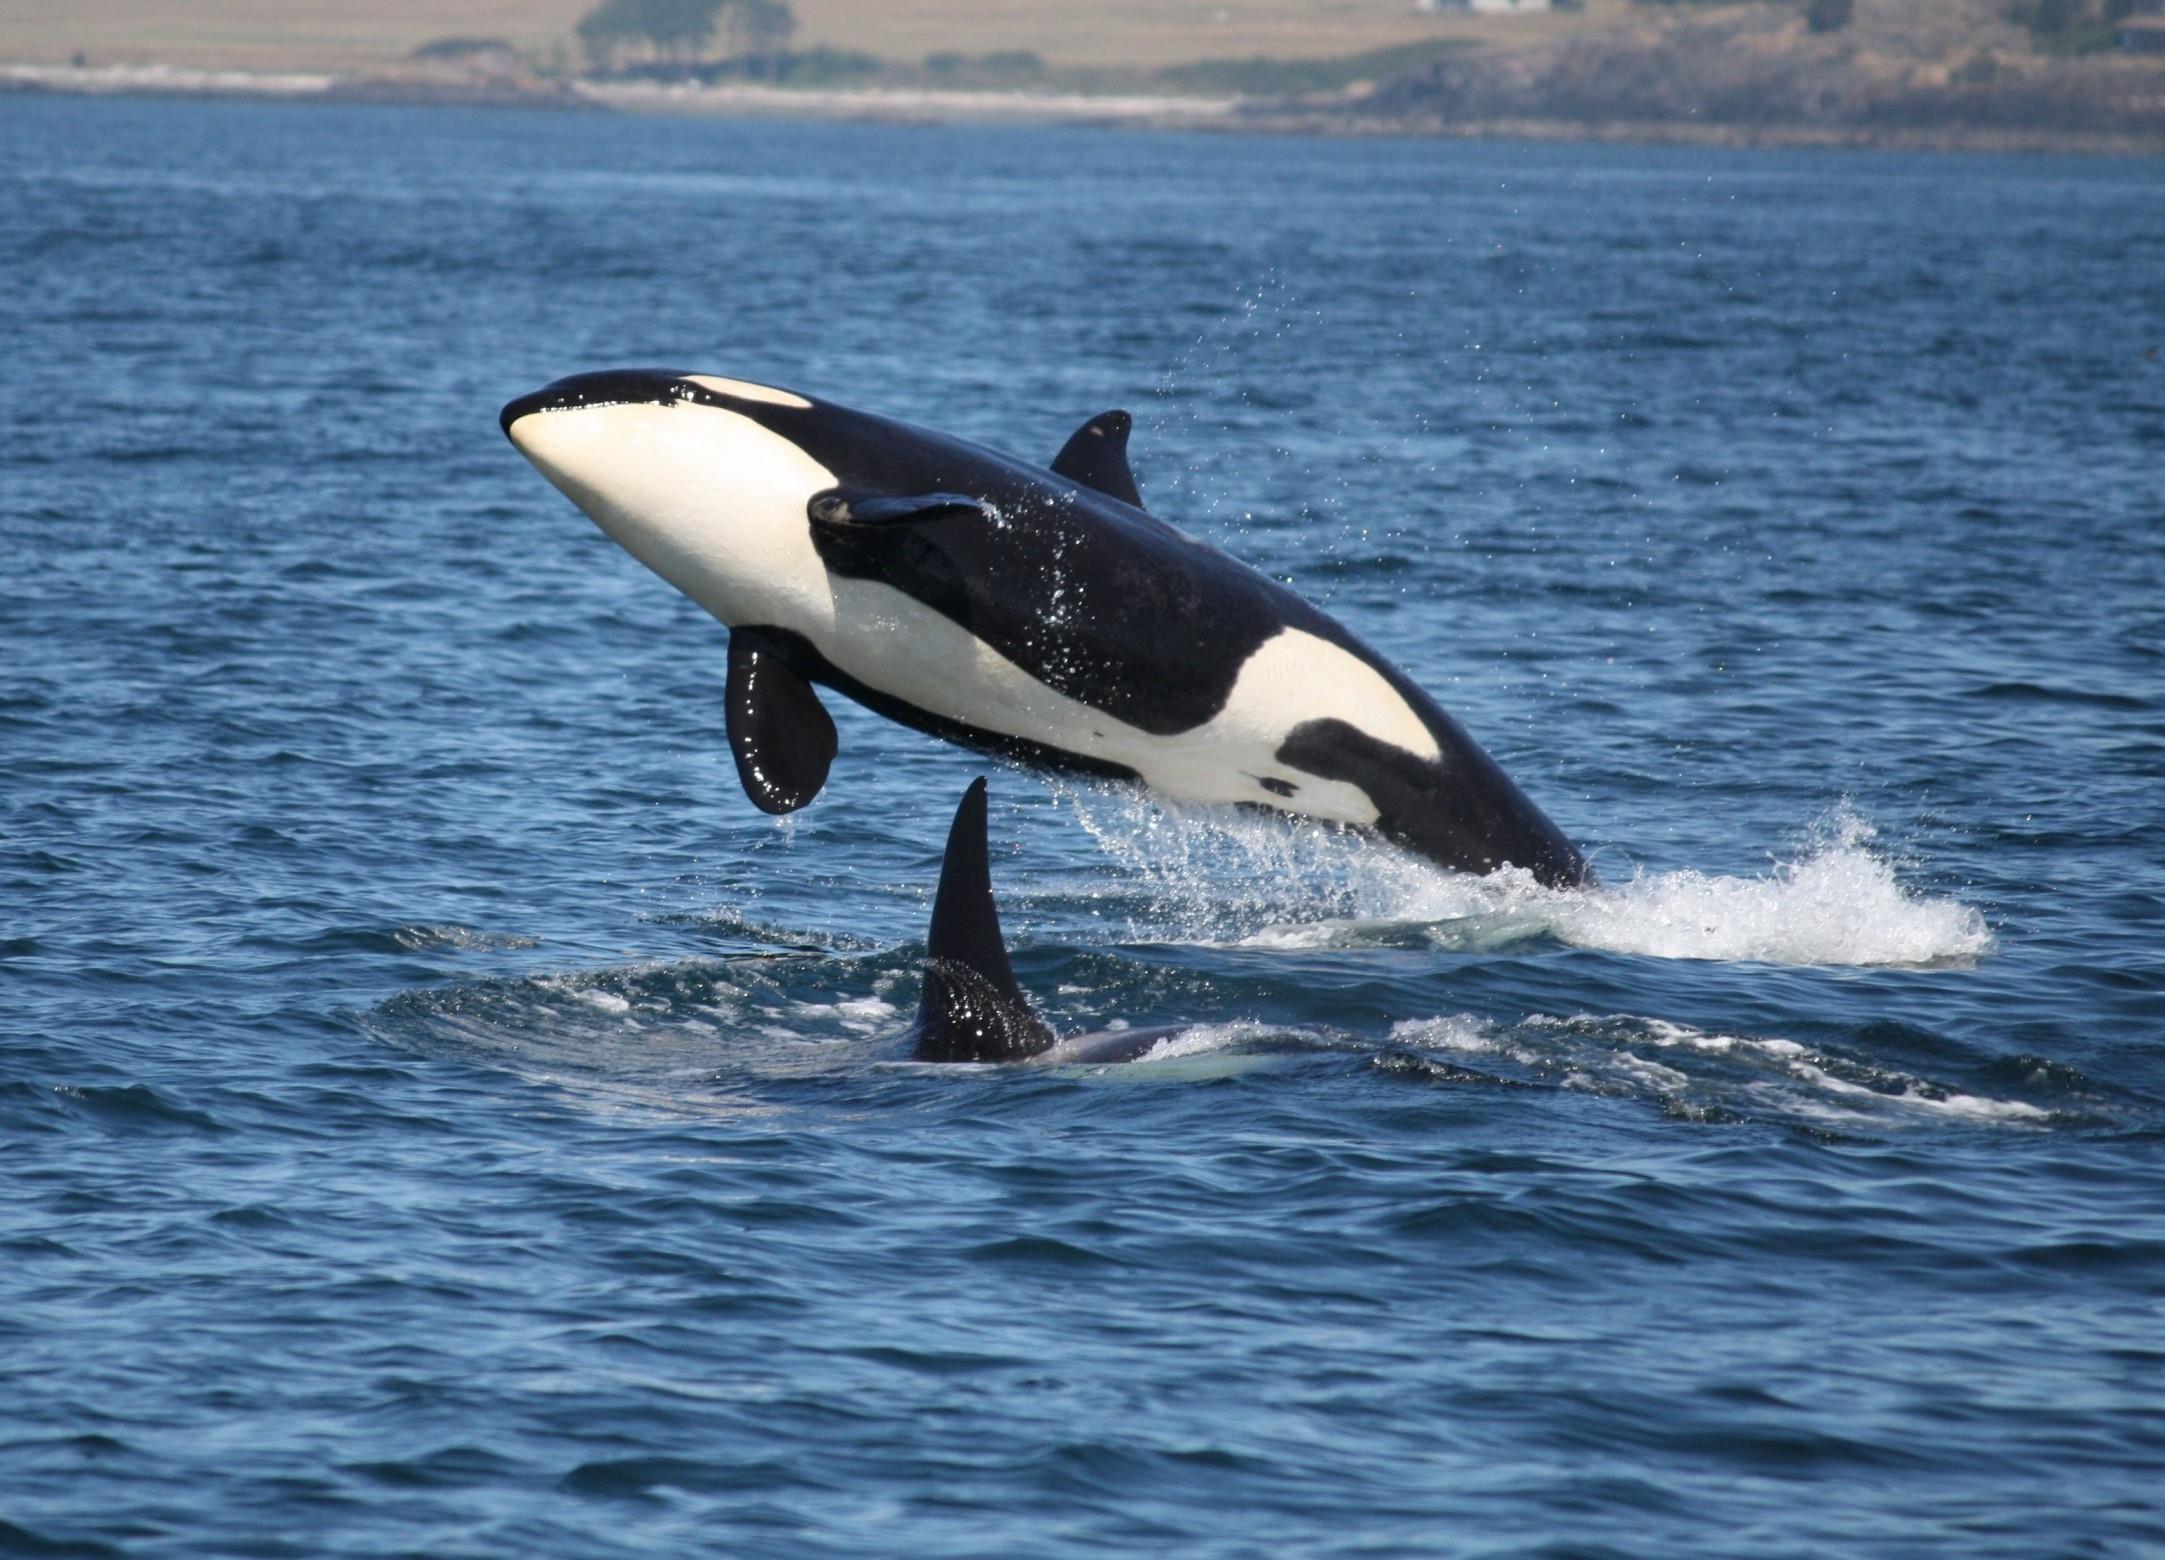
Killer whales don’t always drive white sharks away
When killer whales attacked a great white shark near South Australia’s Neptune Islands in 2015, the story spread quickly.
After the attack, white sharks disappeared from the area for 69 days. Many people blamed fear of orcas for driving them…
Continue Reading
-
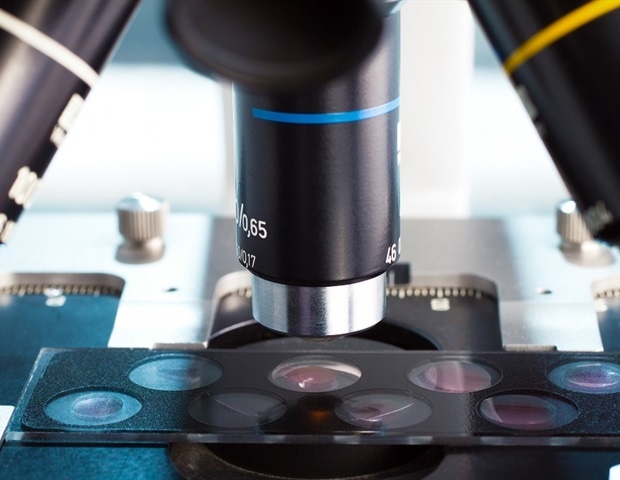
Multicolor electron microscopy reveals proteins and cell architecture at nanoscale resolution
Scientists have developed a new imaging technique that uses a novel contrast mechanism in bioimaging to merge the strengths of two powerful microscopy methods, allowing researchers to see both the intricate architecture of cells and…
Continue Reading
-

Affordable microscope captures living cells during chaotic conditions of zero-gravity flight
As space agencies prepare for human missions to the Moon and Mars, scientists need to understand how the absence of gravity affects living cells. Now, a team of researchers has built a rugged, affordable microscope that can image…
Continue Reading
-

Neutral polymer enables safer DNA delivery into cells
Researchers from Tokyo Metropolitan University have created a new molecule which carries DNA into biological cells, to treat or vaccinate against illnesses. Many existing options rely on molecules with a strong positive…
Continue Reading
-
This 125 Million-Year-Old Dinosaur Had Spikes Like a Porcupine – SciTechDaily
- This 125 Million-Year-Old Dinosaur Had Spikes Like a Porcupine SciTechDaily
- This Strange Spiky Dinosaur Had Skin Unlike Anything We’ve Ever Seen ScienceAlert
- It’s Unprecedented for Paleontologists: This Dinosaur Wasn’t Covered in Feathers,…
Continue Reading