
Superconductors are materials that allow electricity to flow without resistance, typically only at extremely low temperatures. While most follow well-understood physical rules, strontium ruthenate, Sr2RuO4, has remained difficult to explain since…
Category: 7. Science
-
This floating time crystal breaks Newton’s third law of motion
Time crystals are unusual forms of matter made up of particles that “tick,” meaning they move back and forth in steady, repeating cycles. Scientists first predicted their existence and later confirmed them about a decade ago. Although practical…
Continue Reading
-
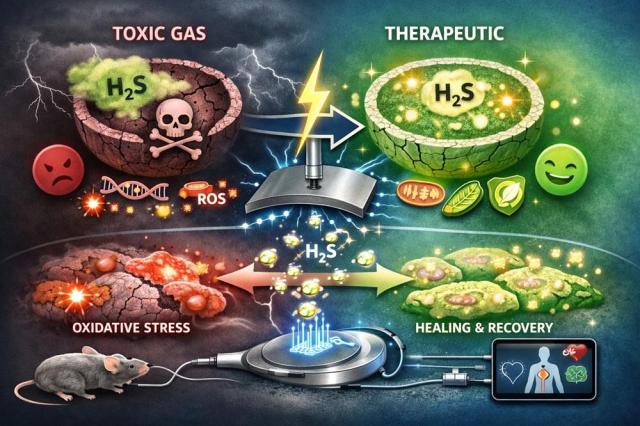
Scientists turn toxic gas into medical tool using electric signals
This AI-generated image depicts KAIST-developed technology that uses electrical signals to control hydrogen sulfide, turning the toxic gas into medical tools. Courtesy of KAIST
SEOUL, March 23 (AJP) – A…Continue Reading
-
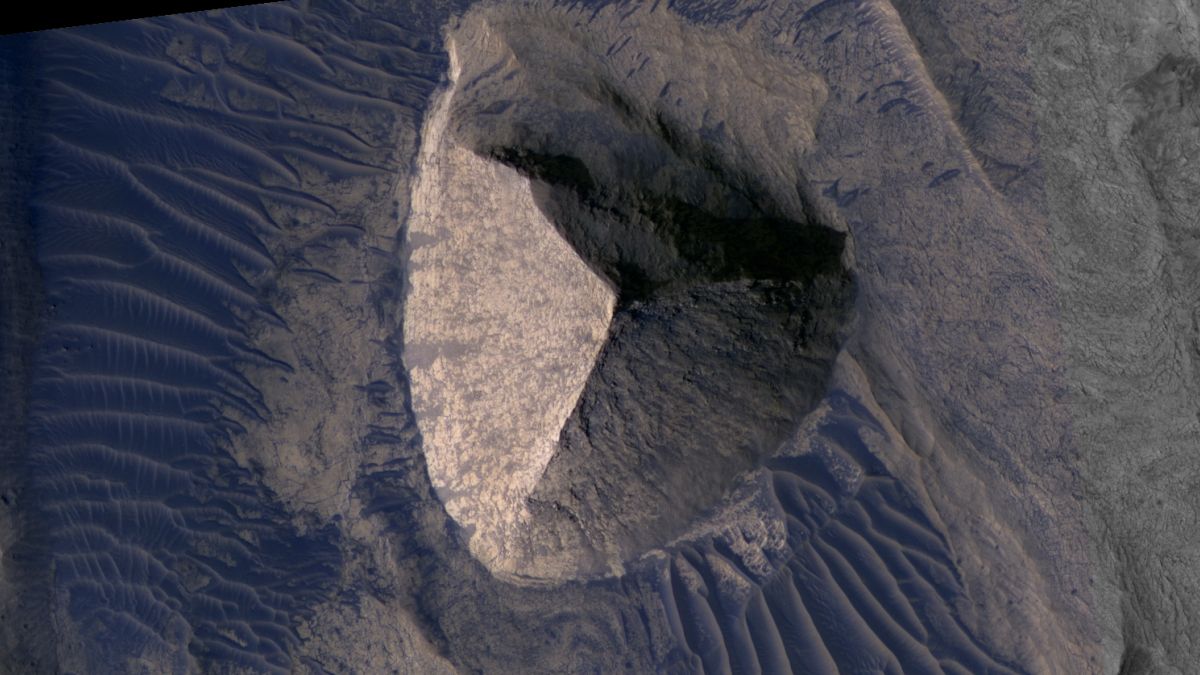
Mysterious Structure on Mars Looks Uncannily Like an Ancient Egyptian Pyramid : ScienceAlert
It would be tempting to assume there’s nothing much of note happening on Mars, but that dusty rusty planet has a lot of interesting stuff going on.
Most of it has to do with rocks. Mars has a lot of rocks. In fact, Mars has so many rocks that…
Continue Reading
-

Bird feathers can cool off by sending body heat into space
Scientists have measured for the first time how bird feathers send body heat toward space, identifying northern bobwhite quail as unusually strong emitters.
The finding reframes feathers as active thermal structures that shape how birds gain and…
Continue Reading
-

Tooth enamel emerges as key archive of ancient biomolecules
A new study has found that amino acids have survived inside fossil mammal teeth for 48 million years, extending the known lifespan of these molecules far beyond earlier limits.
That durability turns tooth enamel into a far deeper archive of…
Continue Reading
-
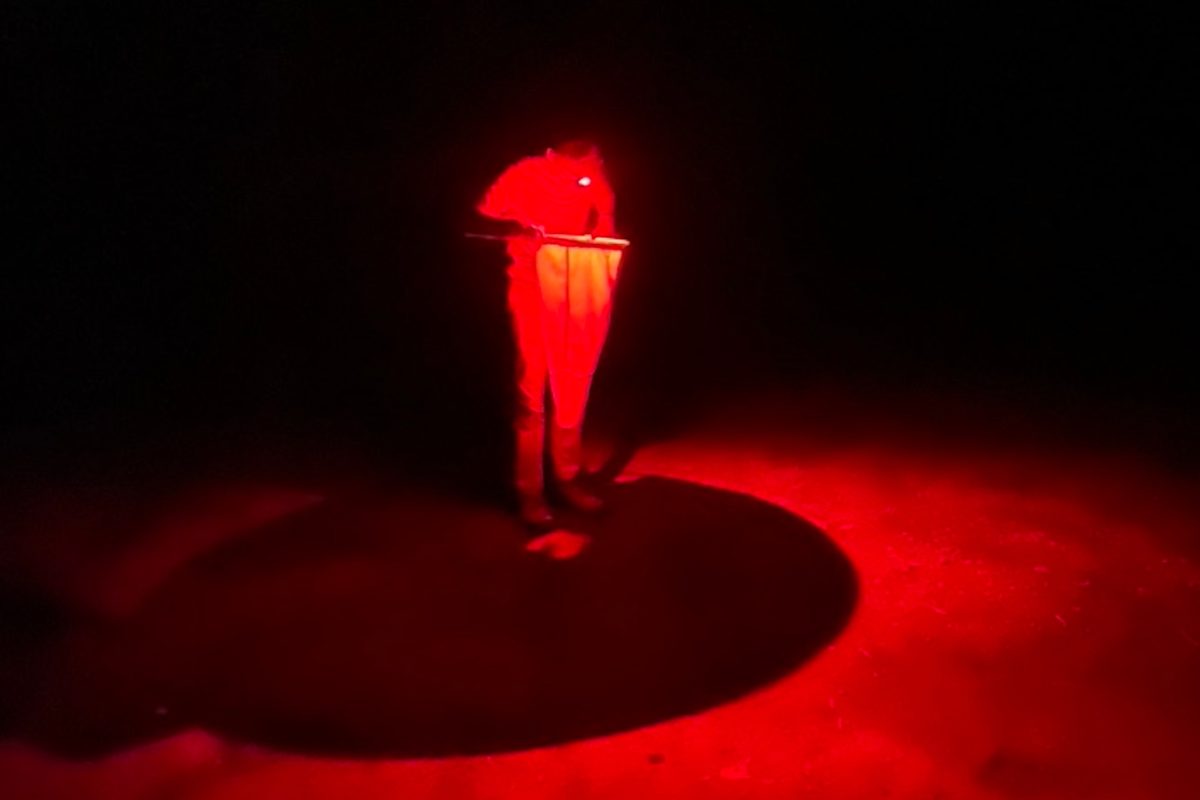
“I would wonder if I was just seeing things.” Scientists make illuminating discovery in South Carolina swamp
In a light show worthy of an underground rave, every May the fireflies of Congaree National Park, South Carolina, put on a coordinated display that illuminates the forest. Now researchers have worked out how they keep their flashes in synch….
Continue Reading
-
Samples From Distant Asteroid Contain All DNA and RNA Building Blocks
In June 2019, a Japanese spacecraft called Hayabusa2 touched down on Ryugu, a 3,000-foot…
Continue Reading
-

Mega-tsunami sends seismic waves around world for nine days
For years, Greenland’s rugged eastern coast sat in near silence. Then, in an instant, seismic sensors around the world started flashing with the same strange signal – a slow, steady pulse that kept going for nine straight days.
Every 92…
Continue Reading
-
SpaceX offers details on orbital data center satellites – SpaceNews
- SpaceX offers details on orbital data center satellites SpaceNews
- ‘This is really intolerable’: Astronomers protest giant orbiting mirror project and SpaceX’s million AI satellites Space
- SpaceX To Start Small With 1 Million Satellite Plan, Pushes…
Continue Reading