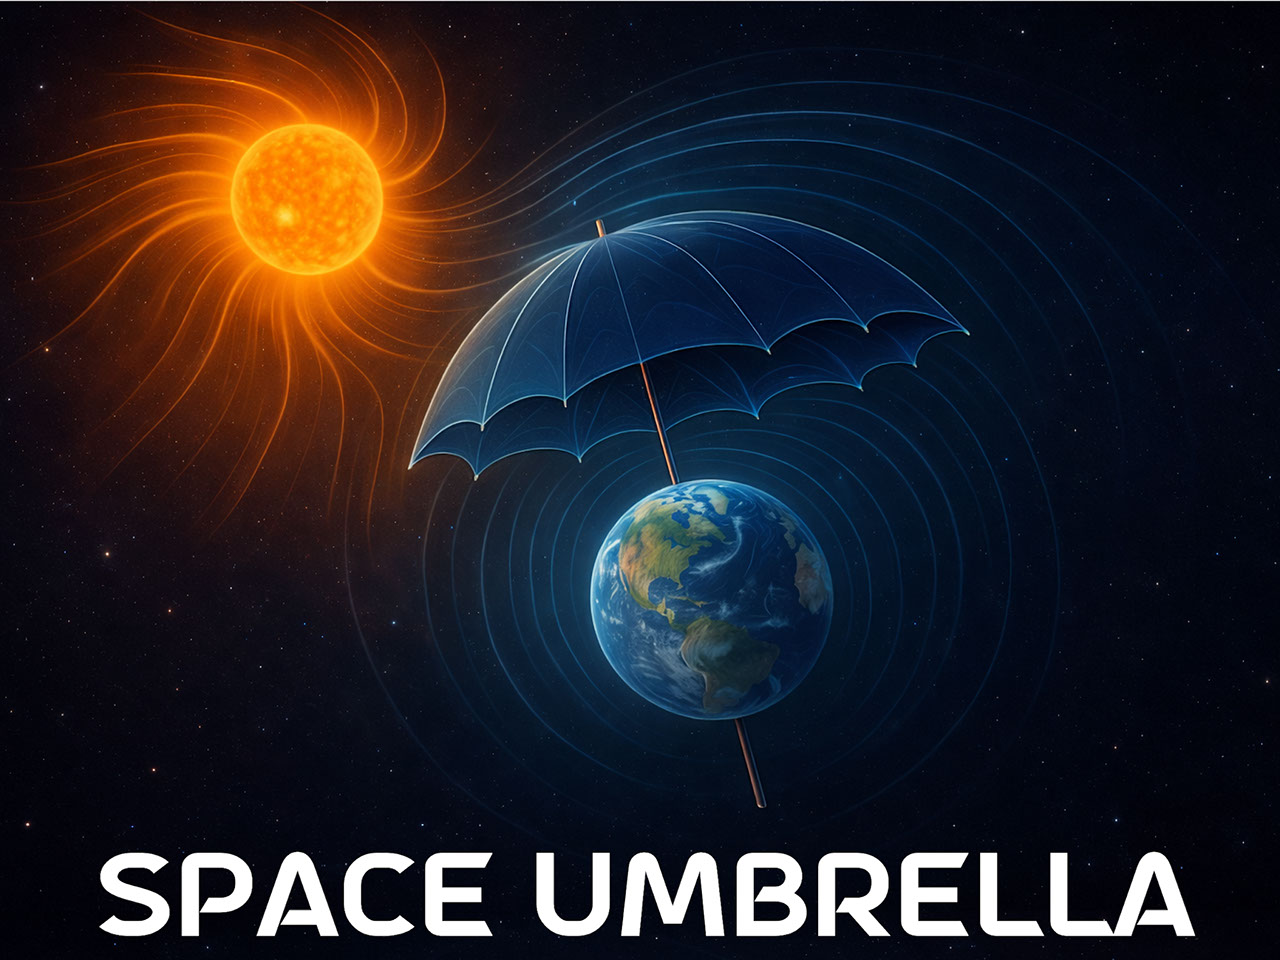
A stream of charged particles known as the solar wind flows from the Sun toward Earth. Here, it meets the Earth’s magnetic fields, which shield our planet like a giant umbrella. The Space Umbrella project needs your help investigating this…
Category: 7. Science
-
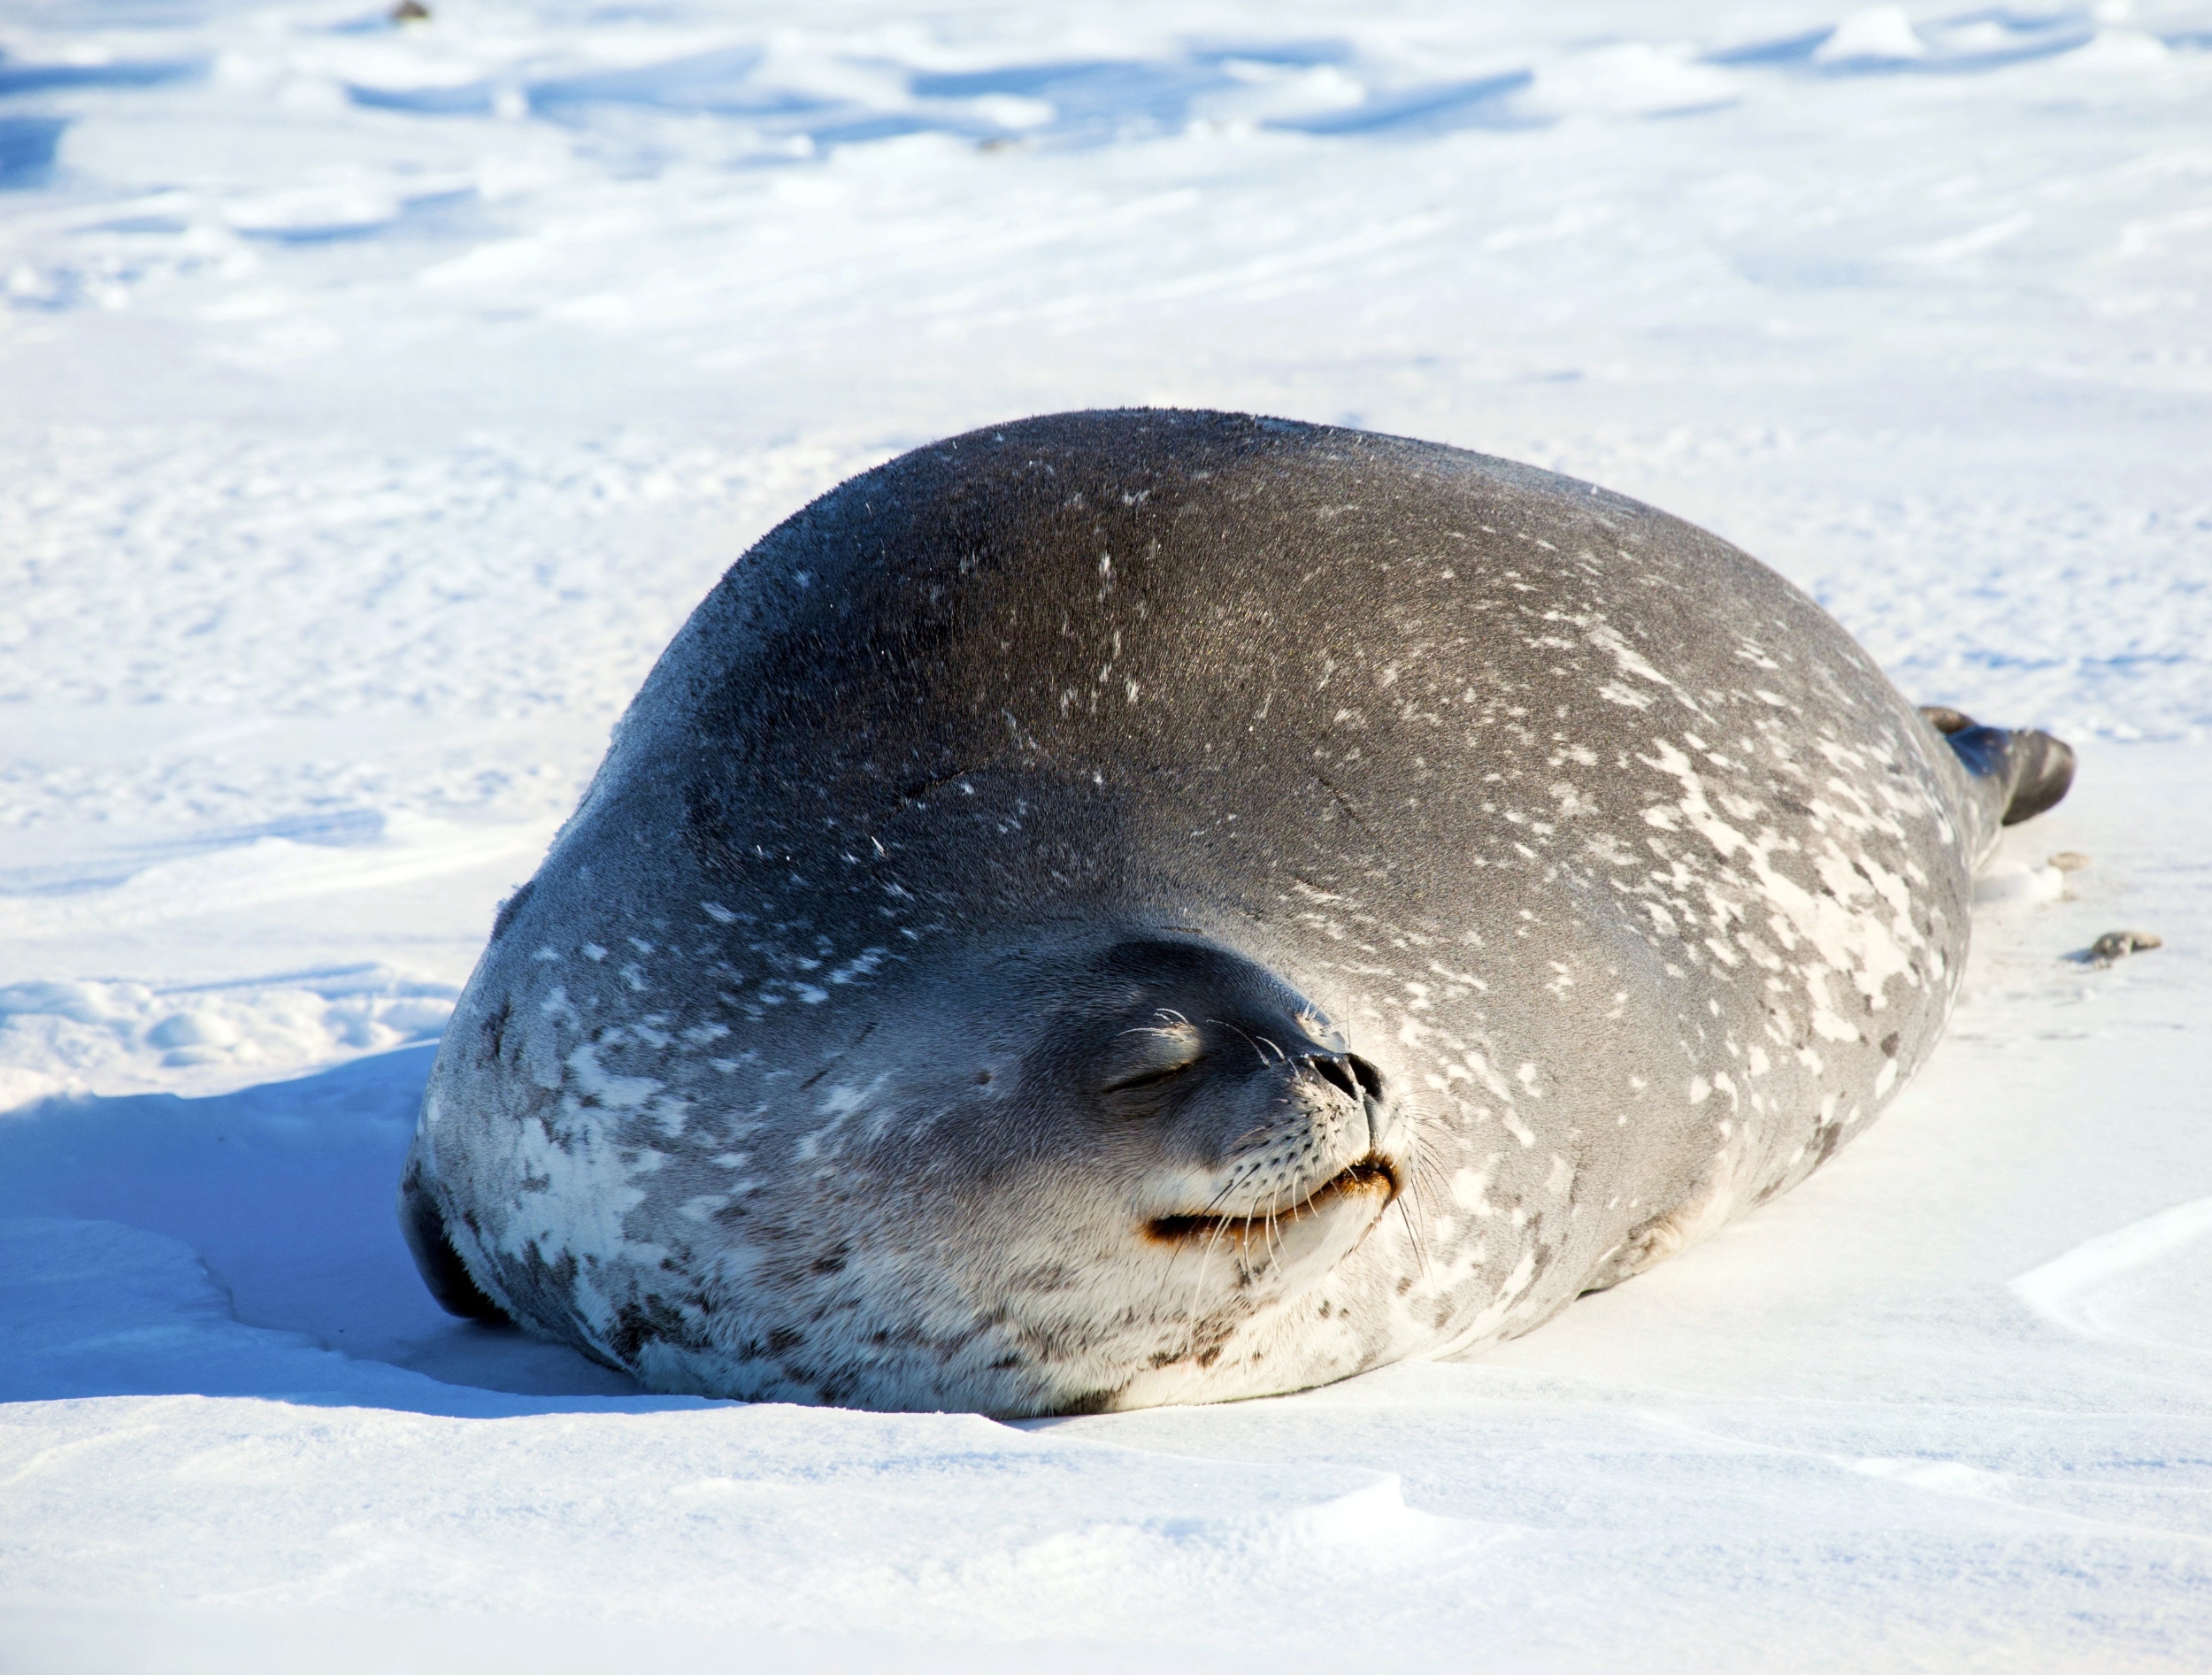
Warming Arctic leaves ringed seals vulnerable to toxic buildup
A single unusually warm year can significantly affect the health of Arctic animals. A new study shows that Arctic ringed seals are facing a double threat: climate-driven nutritional stress and a buildup of harmful contaminants in their bodies….
Continue Reading
-
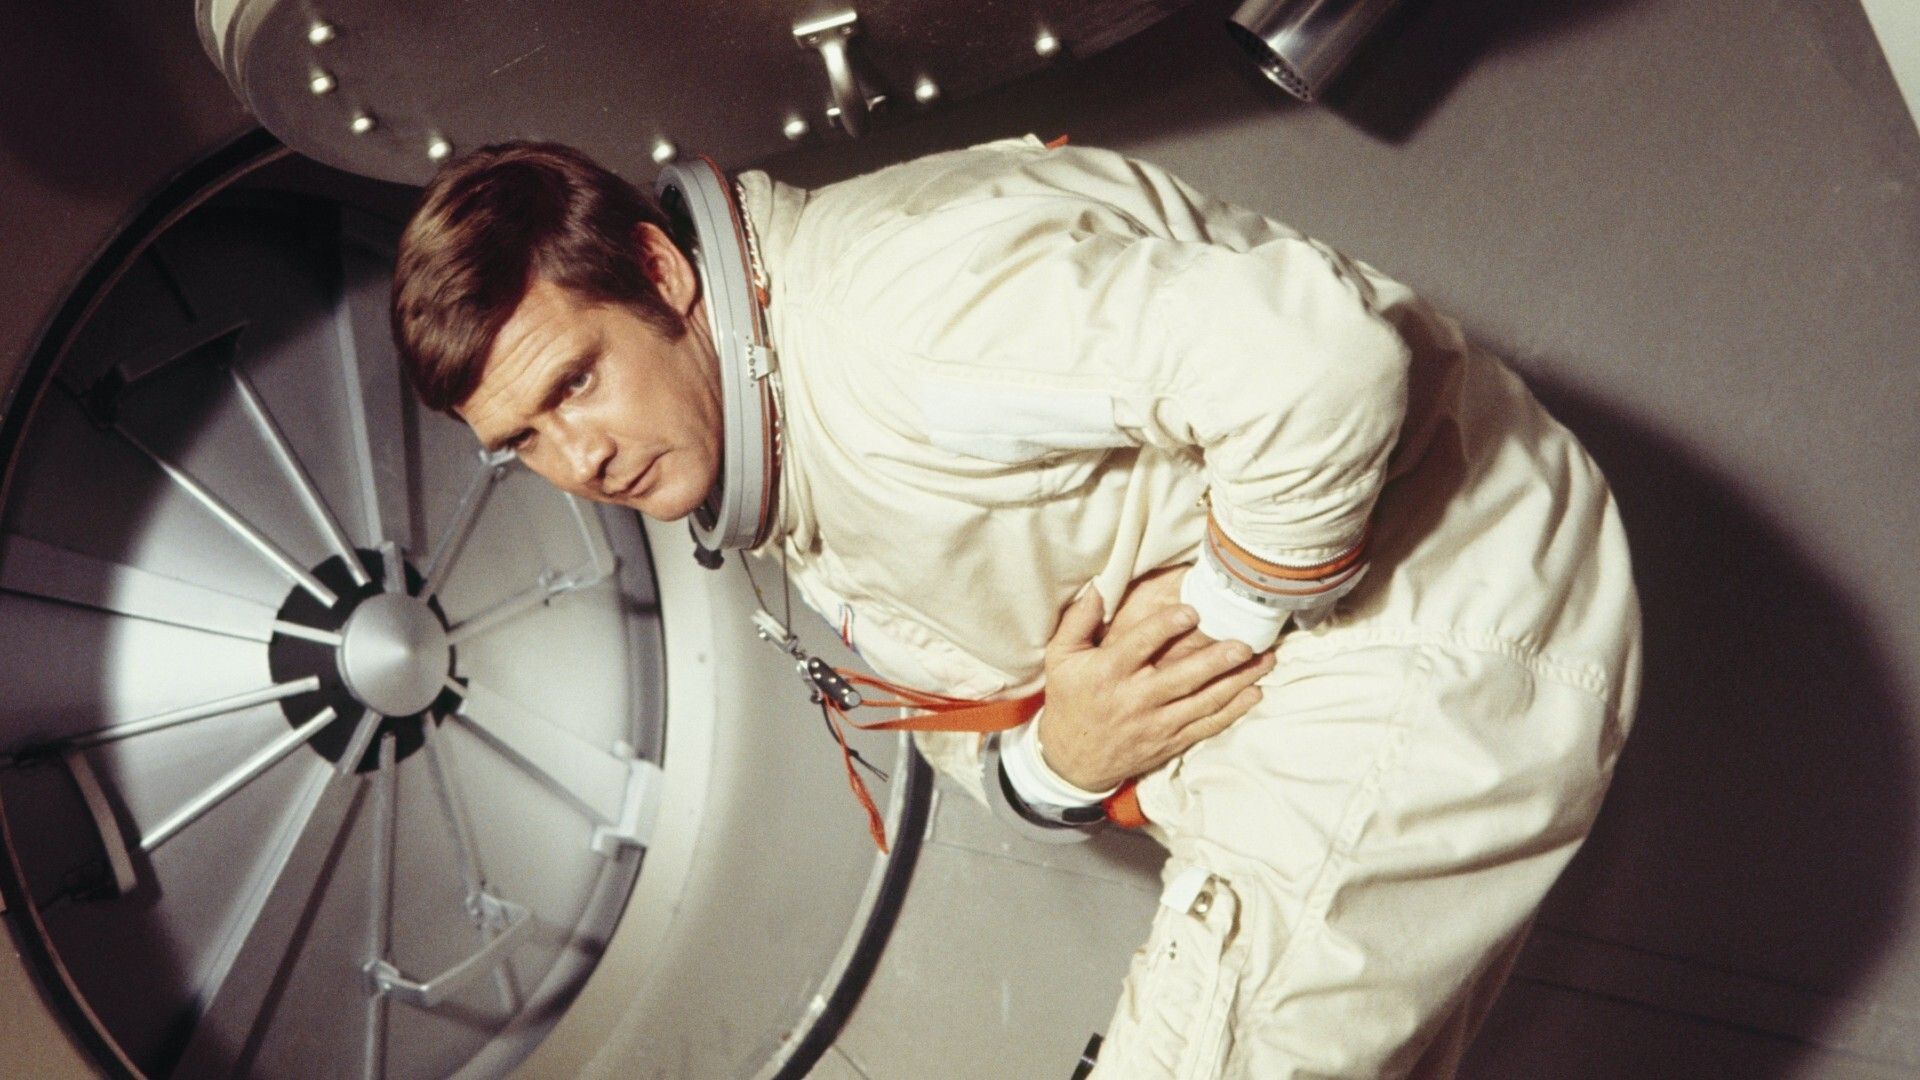
NASA conducts second rocket fueling test that will decide when Artemis astronauts head to the moon – The Washington Post
- NASA conducts second rocket fueling test that will decide when Artemis astronauts head to the moon The Washington Post
- Artemis II Wet Dress Rehearsal: Countdown Begins NASA (.gov)
- NASA to rehearse moon launch again after repairing its rocket NBC…
Continue Reading
-
Inhibitory effect of the methanol extract of Clerodendrum volubile Linn. on carbon tetrachloride-induced early hepatic fibrogenesis: in silico and in vivo study
Devarbhavi, H. et al. Global burden of liver disease: 2023 update. J. Hepatol. 79, 516–537 (2023).
Friedman, S. L. Molecular regulation of hepatic fibrosis, an integrated cellular response to…
Continue Reading
-
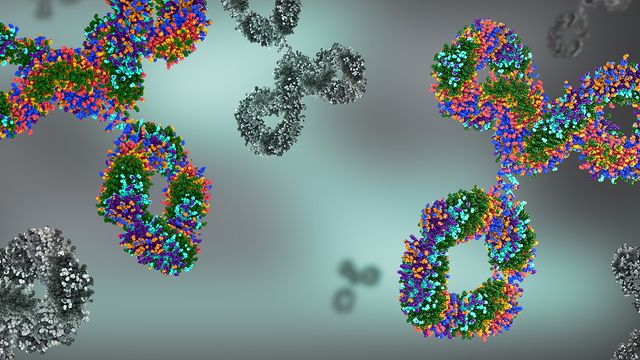
The History of Proteomics: Key Milestones and Innovations
Proteomics—the large-scale study of the entire set of proteins produced by a biological system—has evolved over several decades. Its development was shaped by advances in separation technologies, mass spectrometry, and bioinformatics….
Continue Reading
-
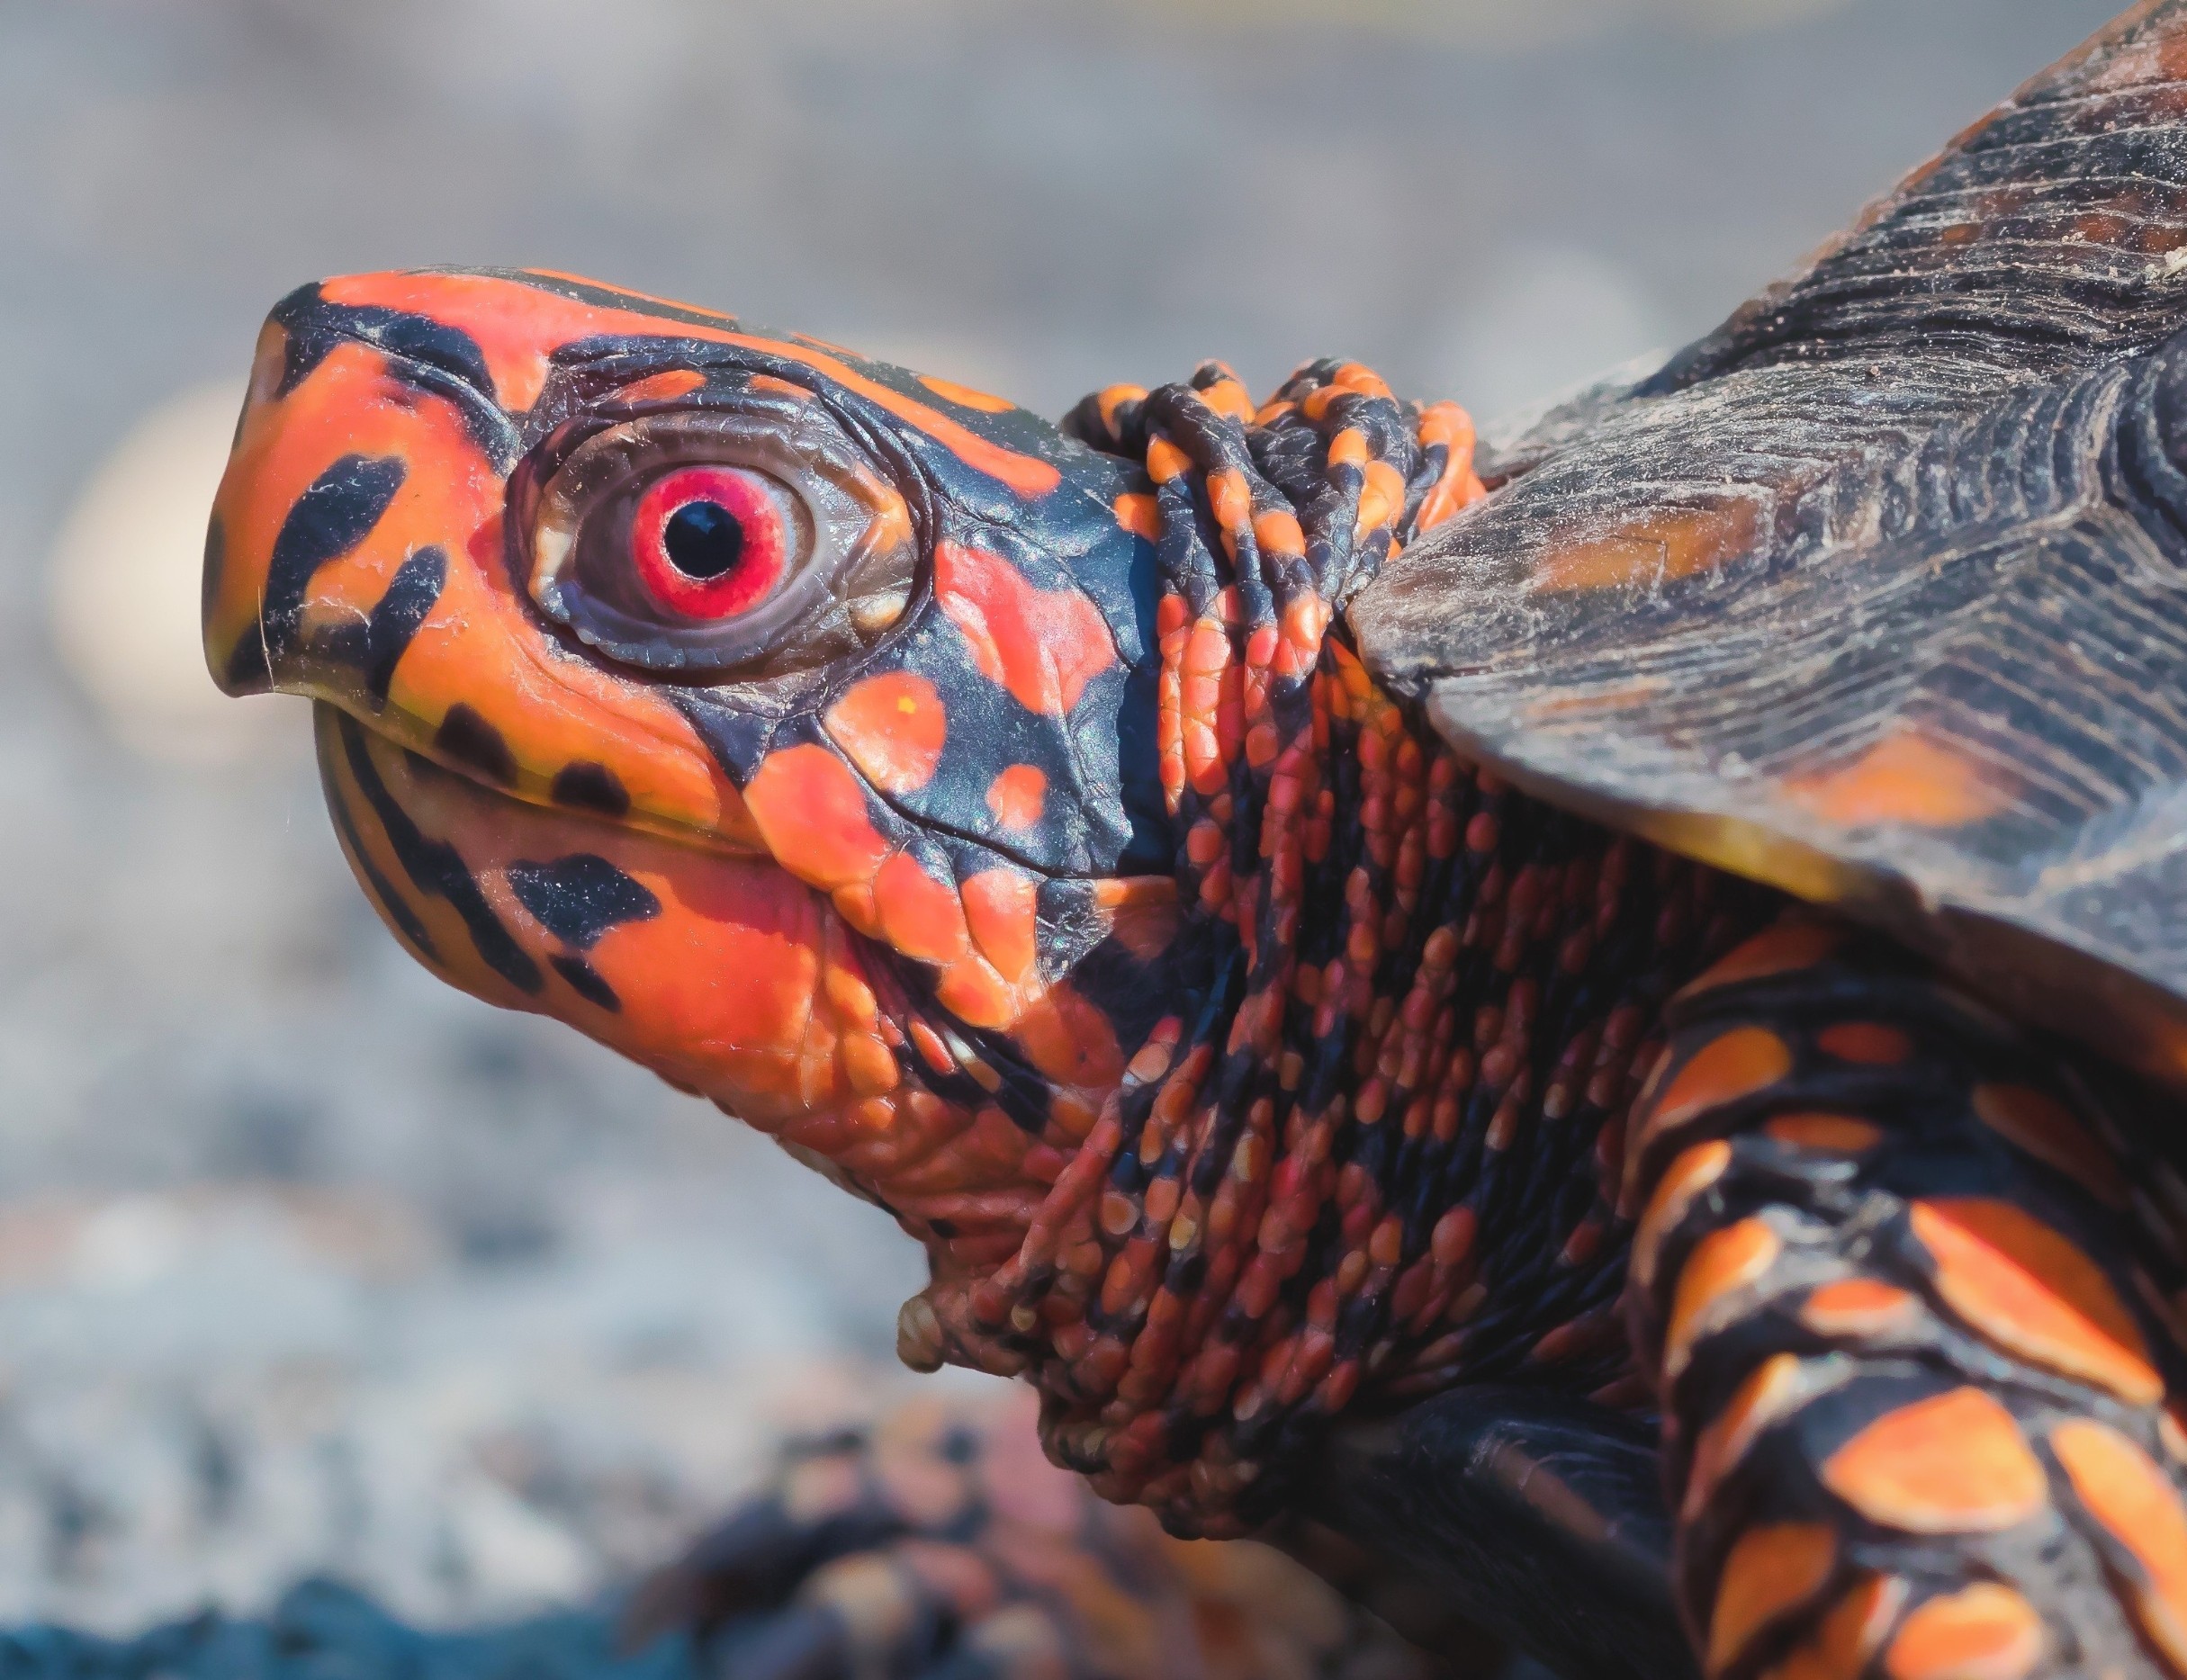
Turtle brains reveal ancient visual processing
For decades, scientists assumed that sophisticated visual abilities were largely unique to mammals. They believed that only large, folded cerebral cortices could reliably detect and interpret important changes in the environment.
However, new…
Continue Reading
-

The investigation could solve the mystery of how supermassive black holes grew so large in the early universe.
Using NASA’s Hubble Space Telescope and Chandra X-ray Observatory, astronomers have hunted for “wandering” black holes drifting through dwarf galaxies. The discovery of these rogue black holes in such small galaxies could provide a “fossil…
Continue Reading
-

Neighborhood poverty, uninsured status linked to COPD hospitalizations
Certain neighborhood characteristics, including higher poverty, more uninsured residents, and lower educational attainment, may lead to an increase in COPD-related emergency department visits and hospitalizations, according to a new…
Continue Reading
-
Do you suffer from IBS? This doctor says ‘gravity intolerance’ may be to blame
Gravity, one of the four fundamental forces of nature, keeps us down to Earth (literally), but our body’s relationship to it could explain our susceptibility to some common health conditions — for instance, irritable bowel syndrome.
At least,…
Continue Reading
-
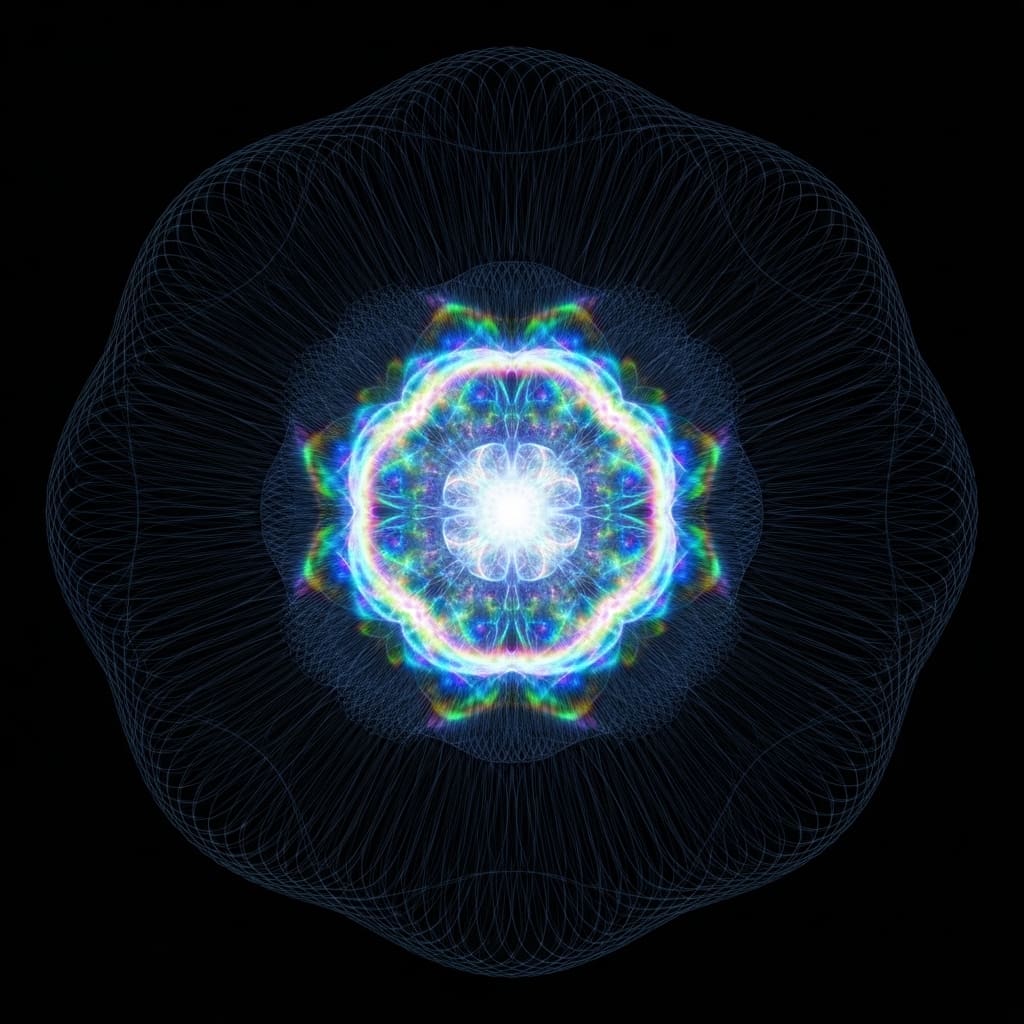
Quantum ‘magic’ Linked To Critical Shifts In Systems
Scientists are increasingly recognising nonstabilizerness, a key resource for universal computation, as crucial to understanding complex quantum systems. Andrew Hallam, Ryan Smith, and Zlatko Papić, all from the School of Physics and…
Continue Reading