When fungi spread through a fallen log, they leave behind a web of tiny threads that quietly break down wood and recycle nutrients. For a long time, scientists assumed most of that network simply stayed behind as the fungus moved on.
But new…
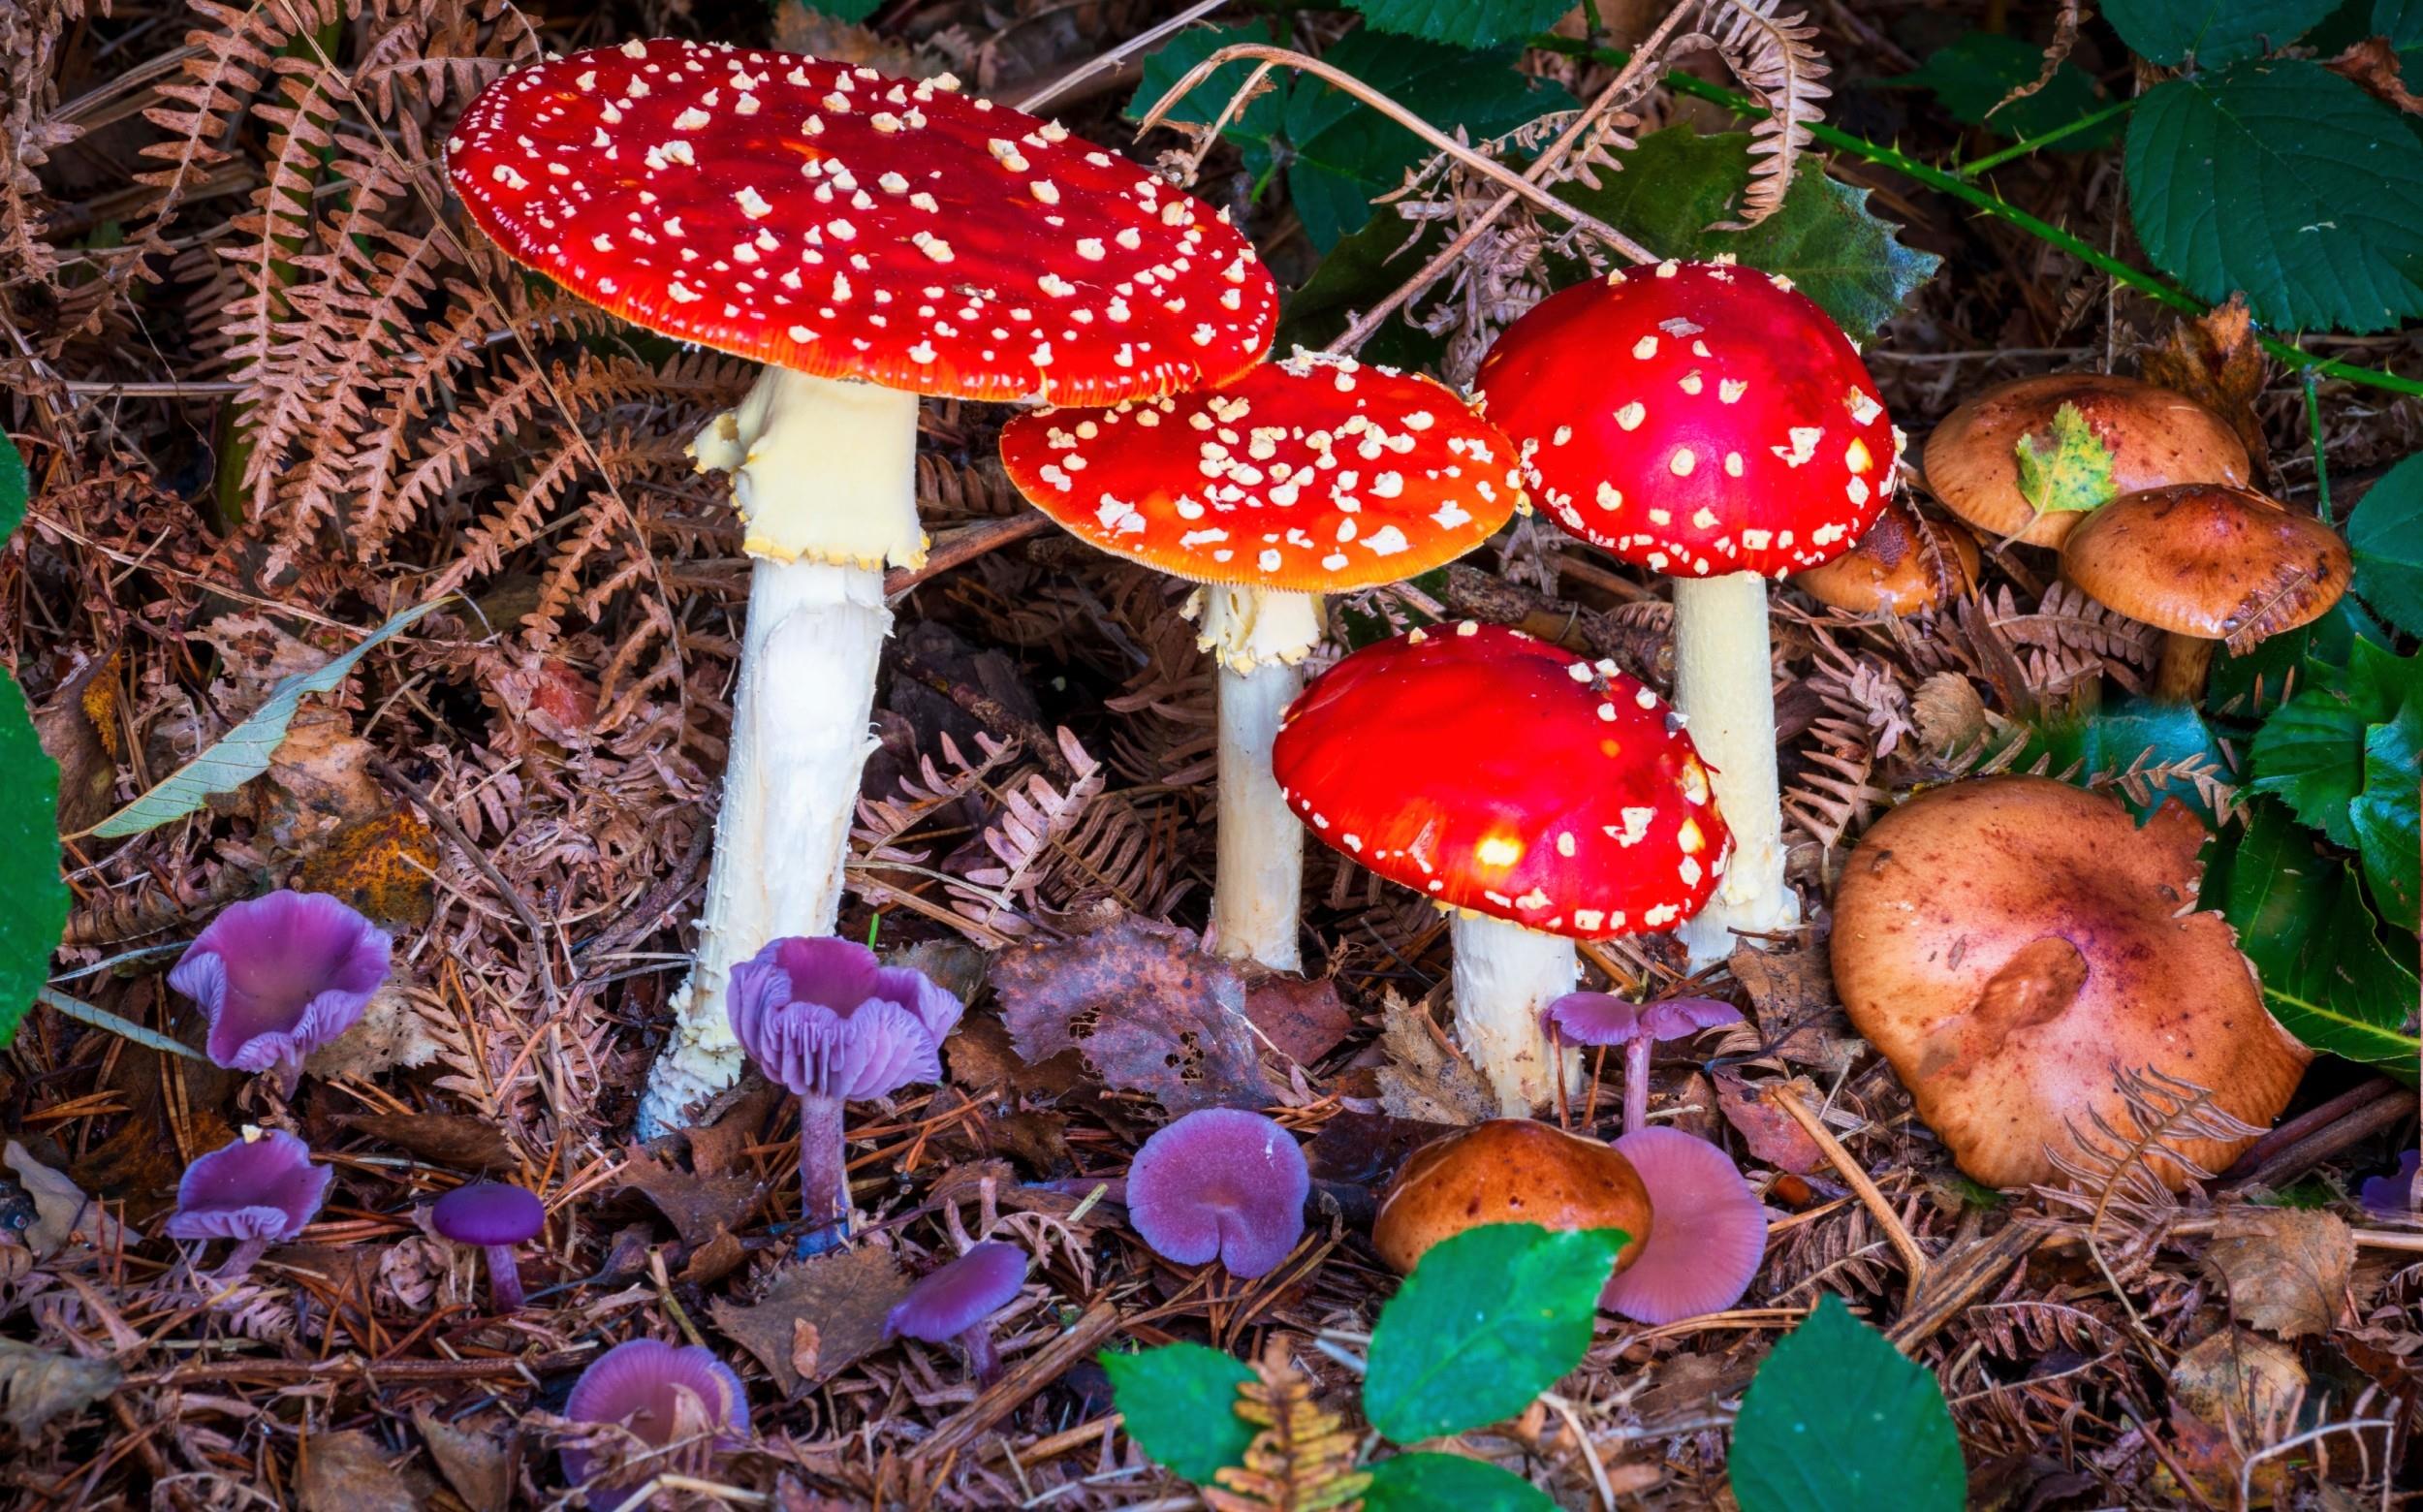
When fungi spread through a fallen log, they leave behind a web of tiny threads that quietly break down wood and recycle nutrients. For a long time, scientists assumed most of that network simply stayed behind as the fungus moved on.
But new…
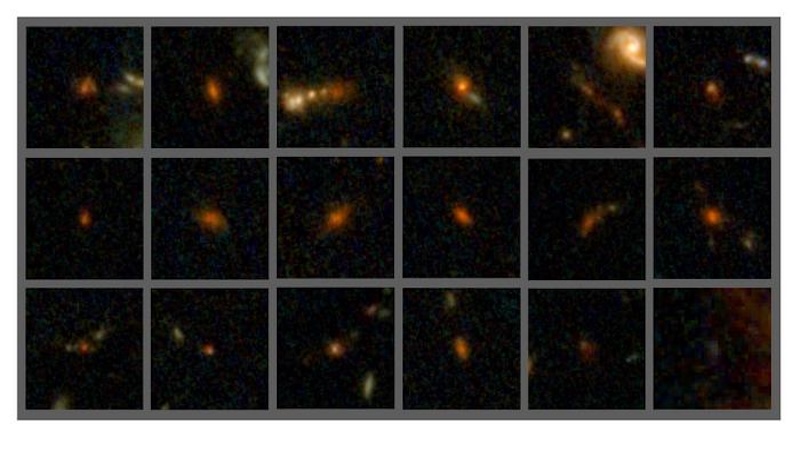
A team of 48 astronomers from 14 countries, led by the University of Massachusetts Amherst, has discovered a population of dusty, star-forming galaxies at the far edges of the universe that formed only a billion years after the Big Bang,…
Heavy collisions at the Large Hadron Collider (LHC) have revealed the faintest trace of a wake left by a quark slicing through trillion-degree nuclear matter — hinting that the primordial soup of the universe may have literally been more…
BYLINE: Russ Nelson
The University of Alabama in Huntsville (UAH), a part of The University of Alabama System, announced that Dr. Arne Croell, a researcher with the UAH Rotorcraft Systems…
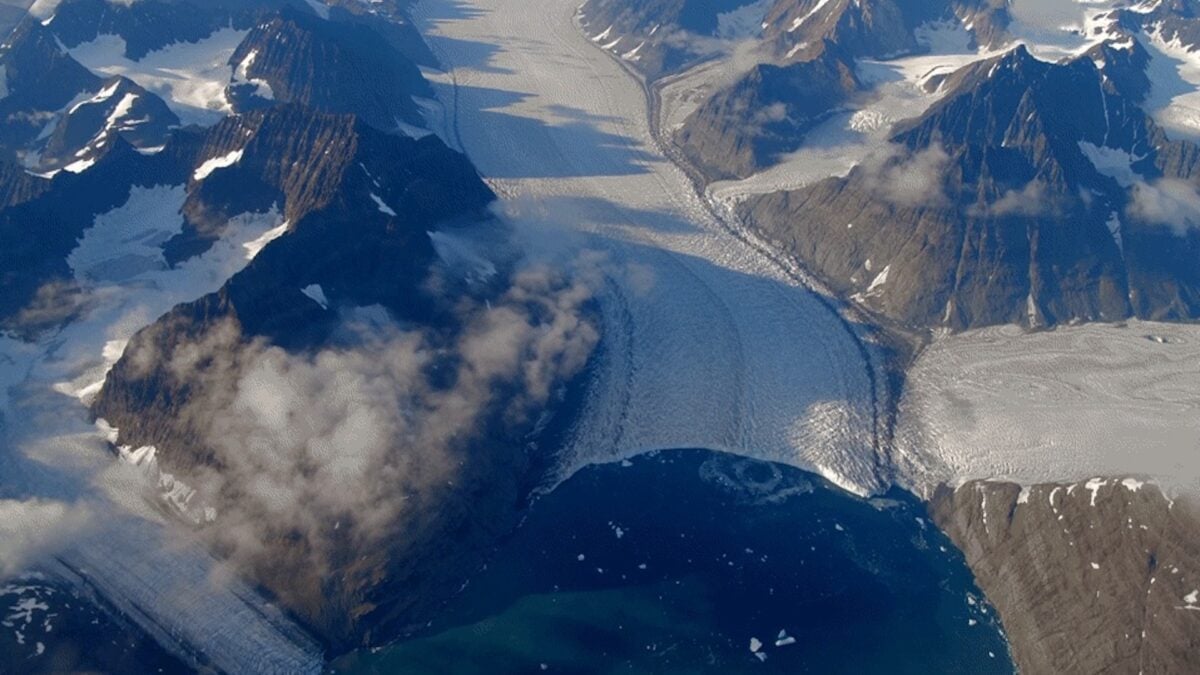
Massive structures of slow, swirling, plume-like patterns were found hidden deep inside Greenland’s ice sheet years ago, but their source remained a mystery. Now, scientists believe they may have tracked down the mechanism…
A team led by Northwestern University and Shirley Ryan AbilityLab scientists have developed a new technology that can eavesdrop on the hidden electrical dialogues unfolding inside miniature, lab-grown human brain-like tissues.
Known as human…
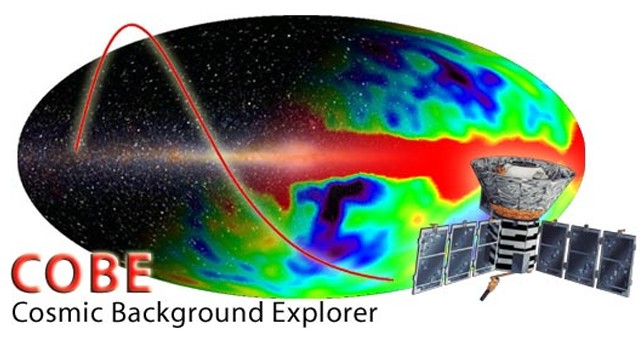
The Cosmic Background Explorer satellite (COBE) went up on a Delta rocket on Nov. 18, 1989, into a polar sun-synchronous orbit 900 km up. Our team at NASA Goddard Space Flight Center (GSFC), Ball Aerospace, the Jet…