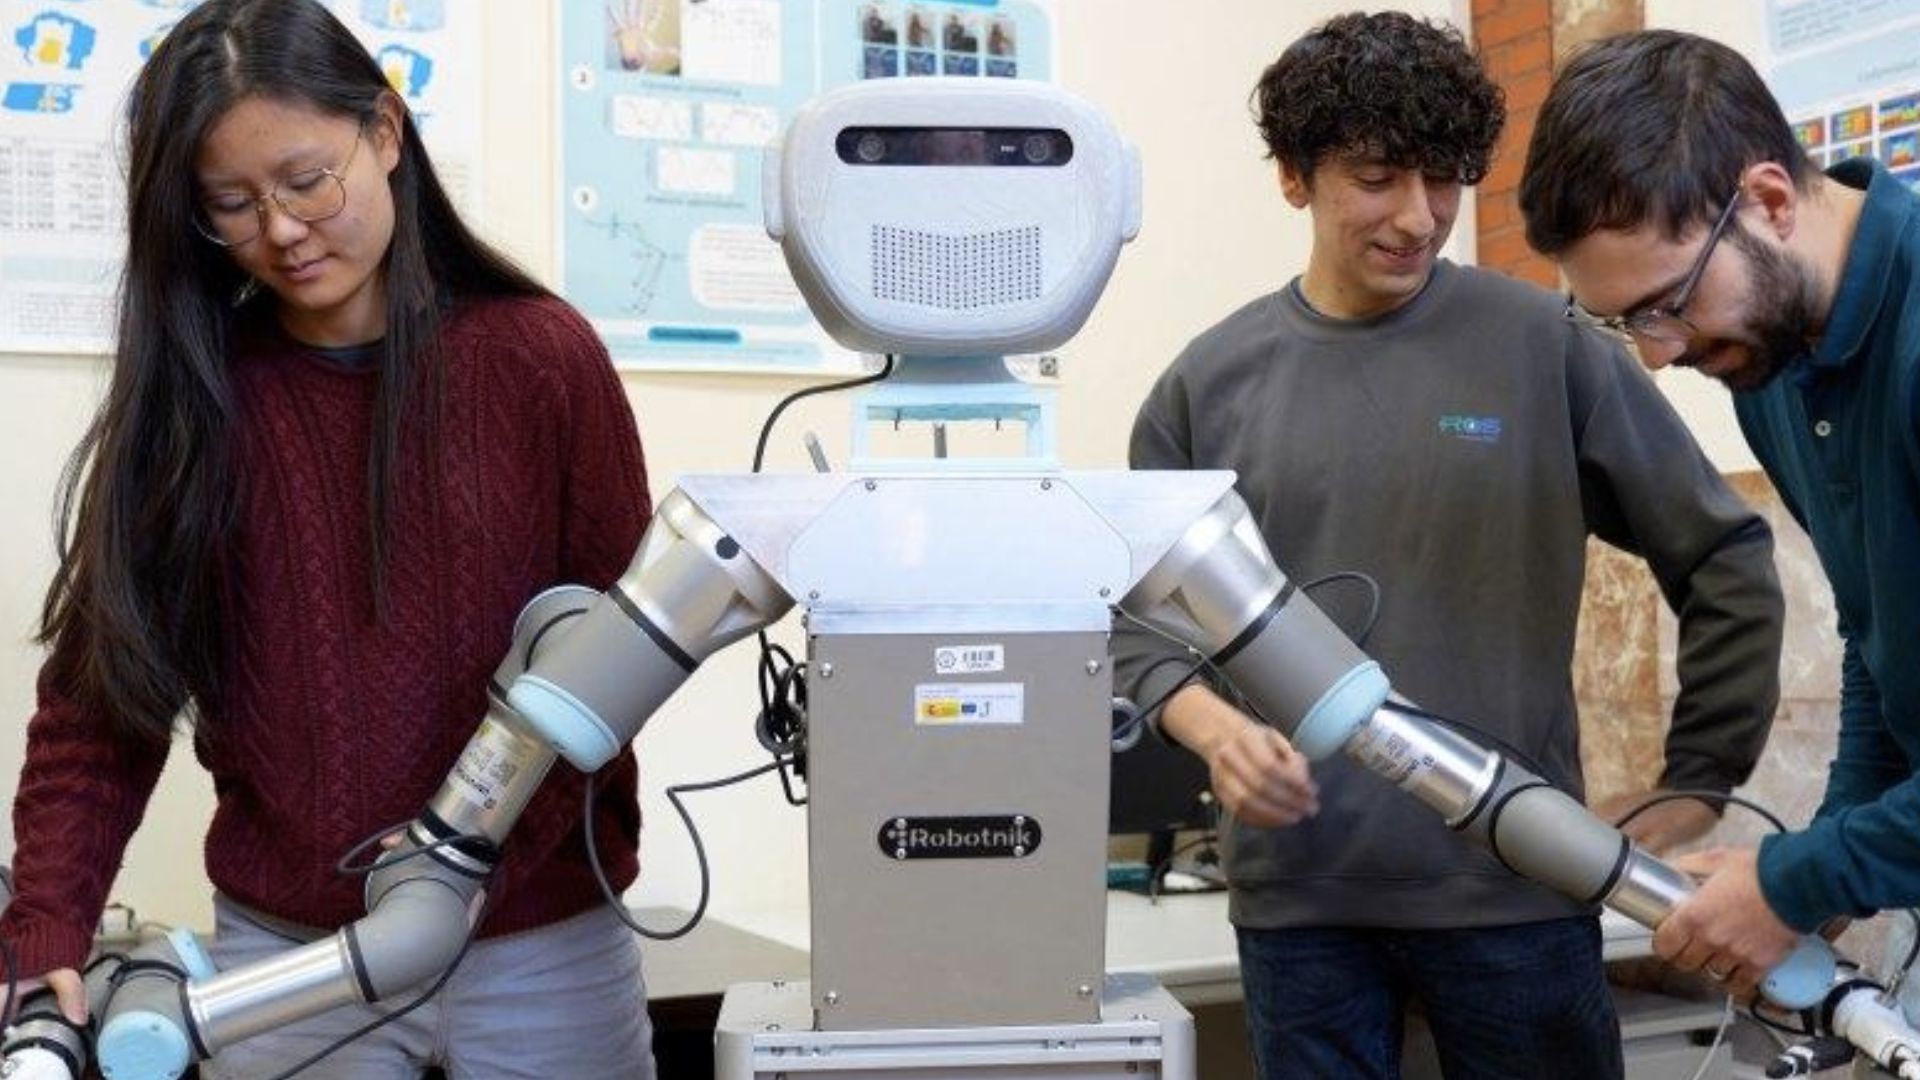
A new methodology is helping robots to move its arms autonomously. Researchers combined a type of observational learning with intercommunication between its limbs to boost robots’ flexibility.
This breakthrough, achieved by researchers at…
A new methodology is helping robots to move its arms autonomously. Researchers combined a type of observational learning with intercommunication between its limbs to boost robots’ flexibility.
This breakthrough, achieved by researchers at…
You have full access to this article via your institution.
…
by Riko Seibo
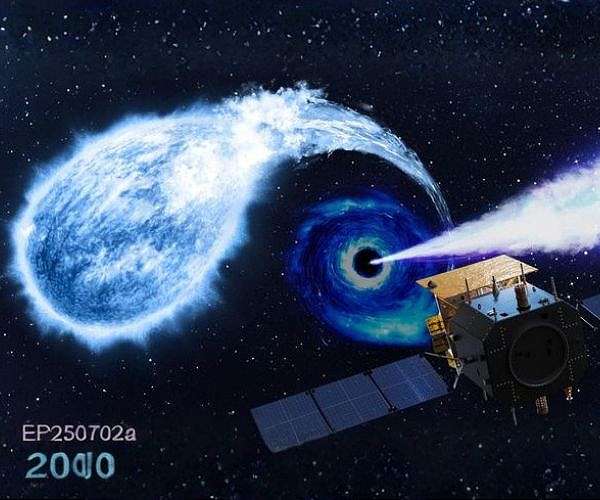
Tokyo, Japan (SPX) Feb 16, 2026
An unusual high energy outburst captured by the China led Einstein Probe space telescope is offering a rare look at how an intermediate mass black hole may tear apart and consume a…
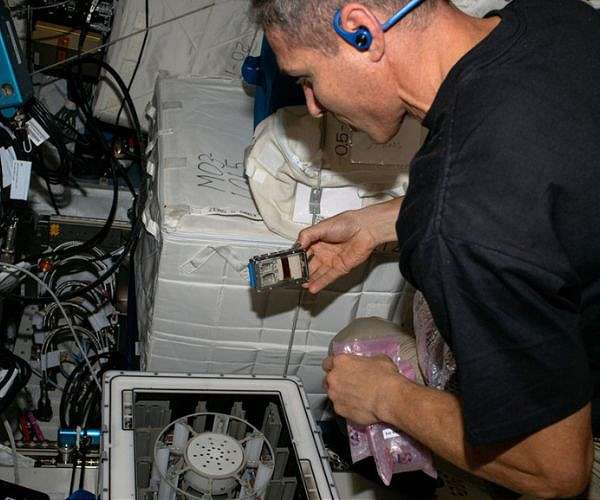
by David Nutt, Cornell Chronicle
Ithaca, NY (SPX) Feb 16, 2026
If humankind is to explore deep space, one small passenger should not be left behind: microbes.
In fact, it would be impossible to leave them behind, since they live…
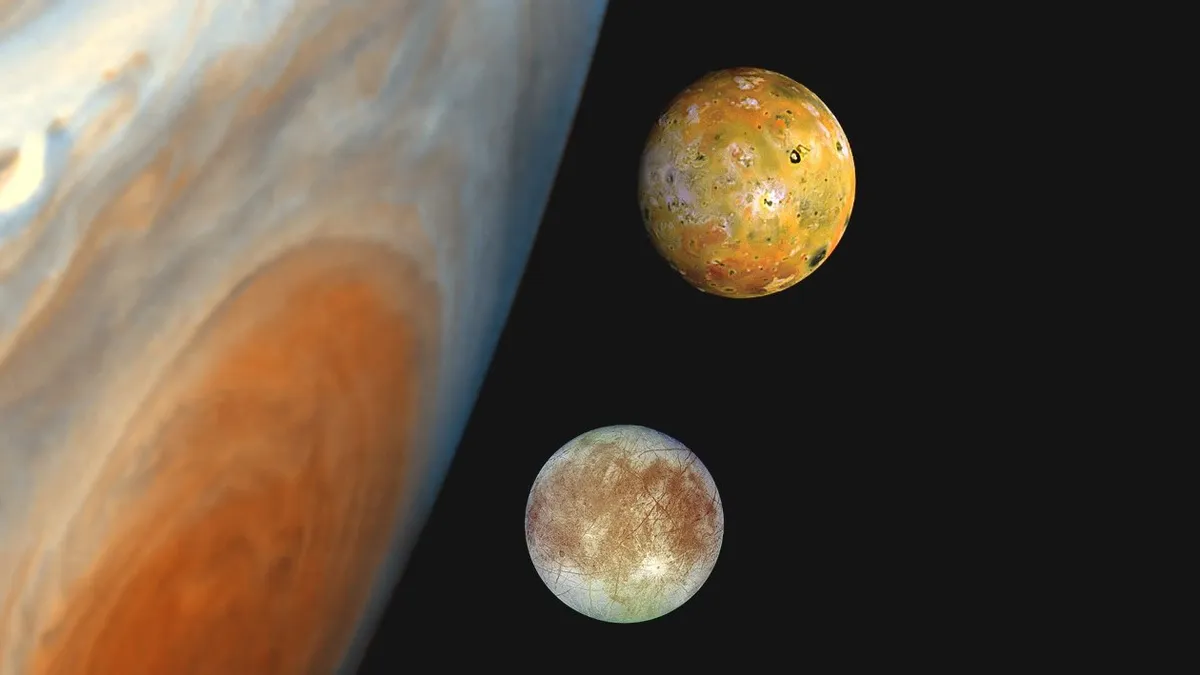
A moon can sit next door to another and still feel like a different world.
Around Jupiter, that contrast shows up fast. Io looks scorched and bone-dry, yet it is the most volcanically active moon in the solar system. Europa, just one orbit farther…
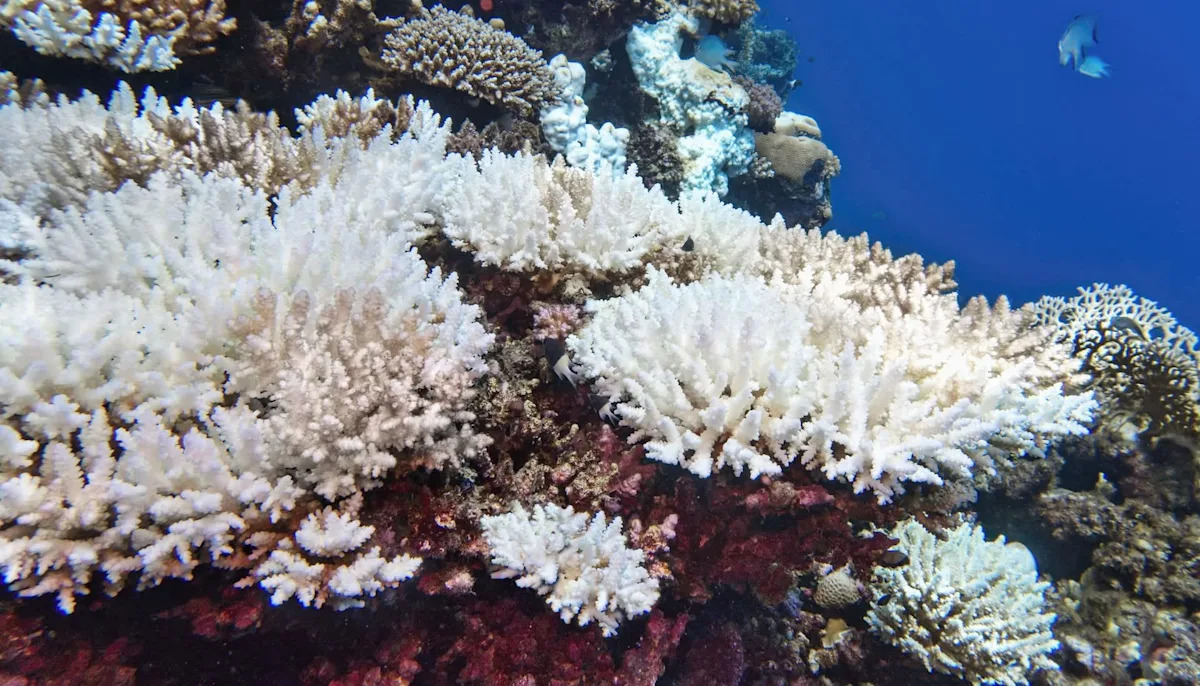
Coral reefs cover less than 1% of the ocean floor but support about 25% of all marine species. Despite their importance, a study published in Nature Communications found that warming water temperatures are causing coral bleaching events that…

The arrival of 3I/ATLAS in our Solar System spawned multiple proposals for a rendezvous mission to study it up close. As the third interstellar object (ISO) ever detected, the wealth of information direct studies could provide would be…
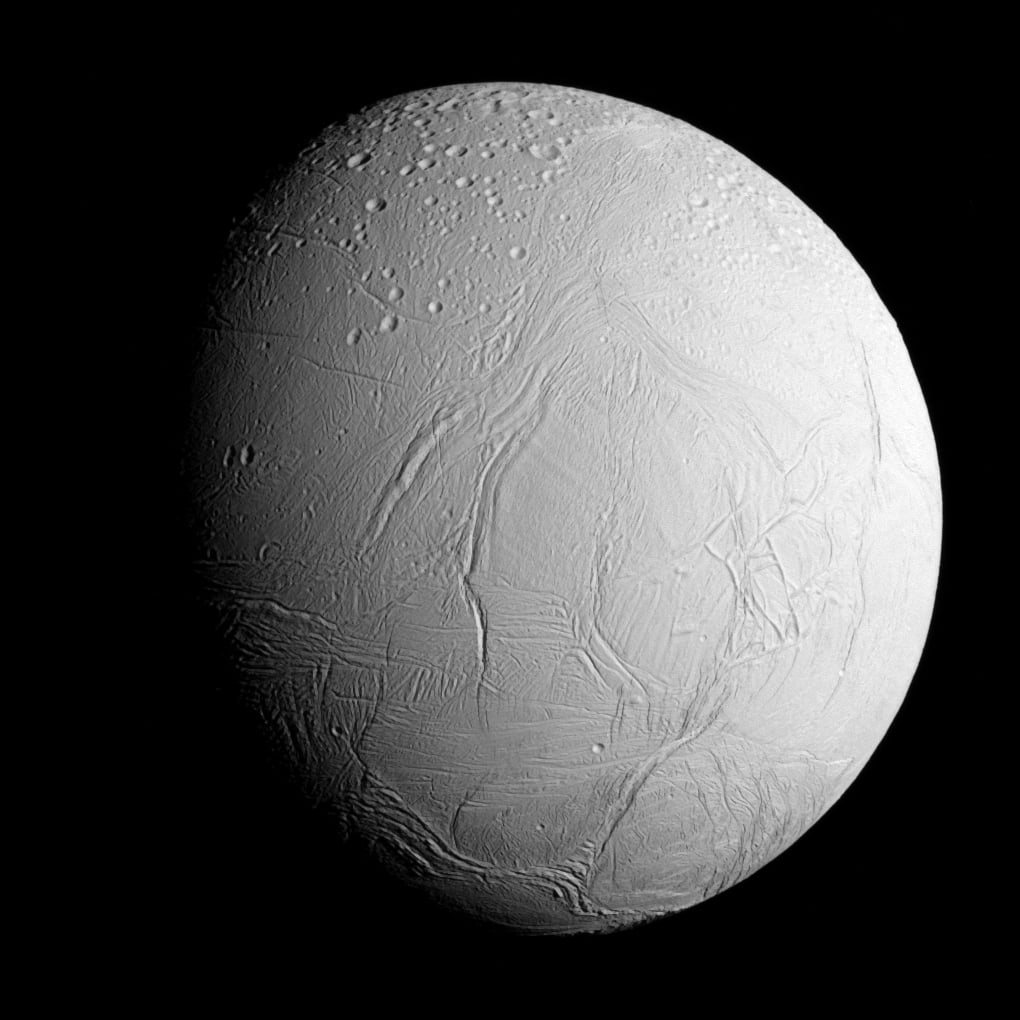
At just 500 kilometres across, Saturn’s sixth largest moon would fit comfortably inside my home country, the United Kingdom with room to spare. Yet new research reveals this tiny ice world wields electromagnetic influence over distances…
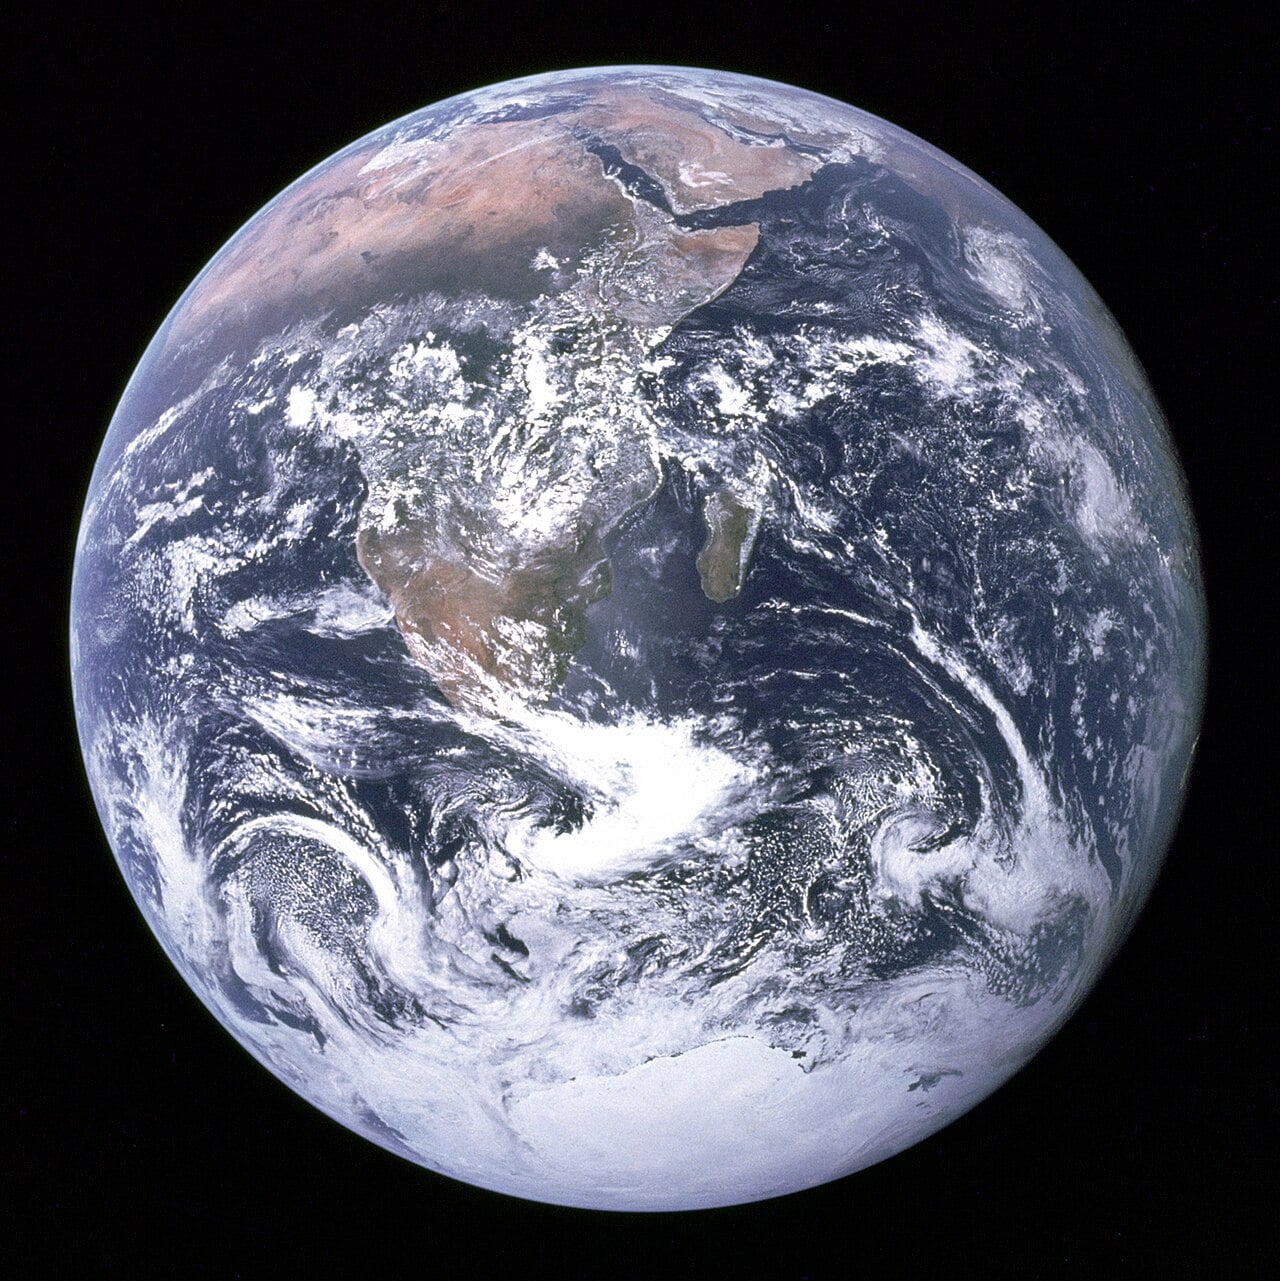
Earth’s radiation budget, that’s the balance between incoming sunlight and outgoing heat, drives our climate system. Understanding it requires measuring radiation escaping from every corner of our planet, but current satellite…
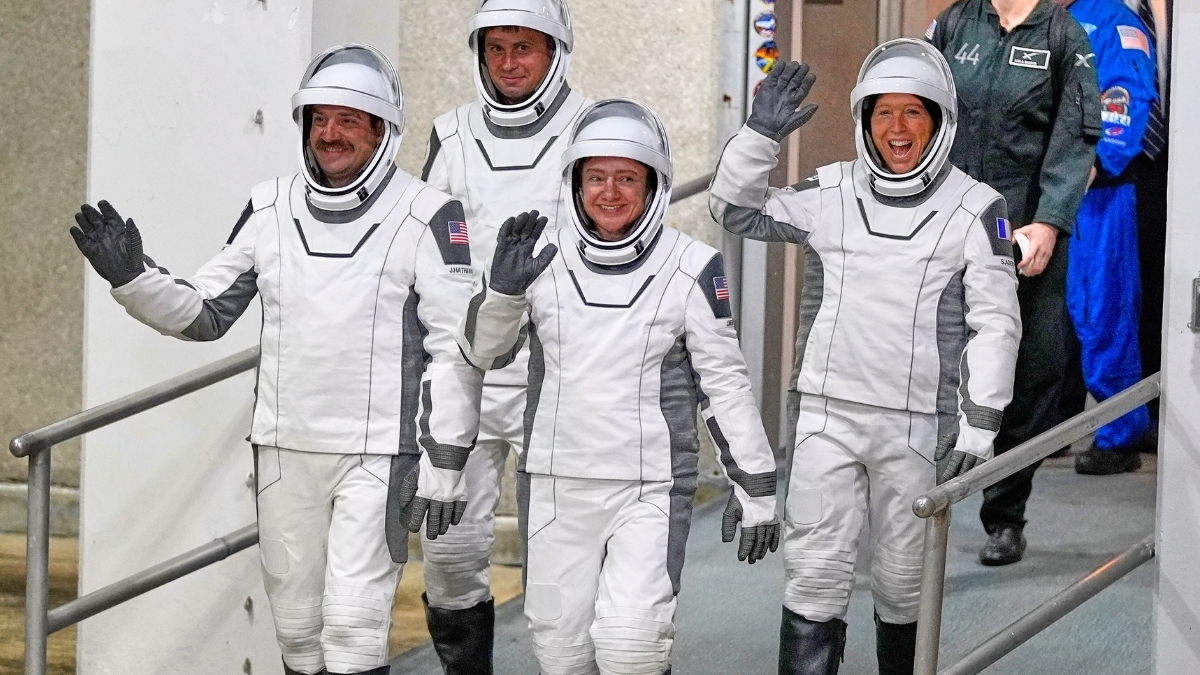
CAPE CANAVERAL, Fla. (AP) – The International Space Station returned to full strength with Saturday’s arrival of four new astronauts to replace colleagues who bailed early because of health concerns.
SpaceX delivered the US, French, and…