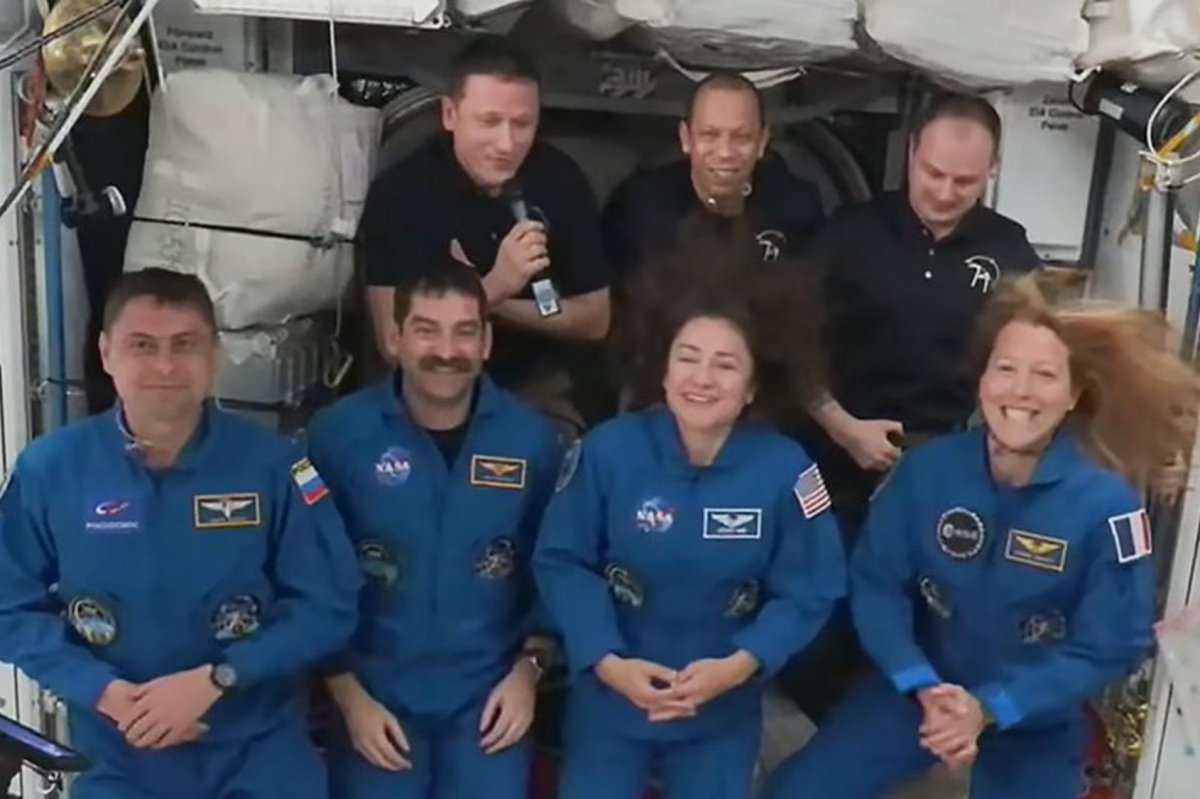
WASHINGTON — NASA Administrator Jared Isaacman said he is interested in meeting with his Russian counterpart and attending an upcoming Soyuz launch.
Asked about cooperation with Roscosmos during a news conference after the Crew-12…

WASHINGTON — NASA Administrator Jared Isaacman said he is interested in meeting with his Russian counterpart and attending an upcoming Soyuz launch.
Asked about cooperation with Roscosmos during a news conference after the Crew-12…

Researchers have built an artificial intelligence system that detects a fruit fly’s courtship song the moment it begins and immediately shuts down the neurons that produce it.
The result turns fleeting animal interactions into direct tests of…

doctors have successfully saved the life of a 45-year-old man who was suffering from a rare and severe type of ischemic stroke, a condition that can often lead to death or permanent disability if not treated quickly.
The patient was brought to…

The US National Oceanic and Atmospheric Administration (NOAA) recently warned that the strongest solar radiation storm in 20 years could…

Sinking clumps of dead ocean life have been shown to leak up to half their carbon and more than half their nitrogen when exposed to the crushing pressure of the deep sea.
That pressure-driven release reveals a previously unrecognized source of…

A group of researchers is now arguing that Earth-bound asteroids can be deflected using a nuclear weapon. However, given the nature of asteroids, these researchers may not expect such a life-saving effort to be executed as we might expect.

Beyond the monumental walls and immersive public works, HOXXOH’s studio is a laboratory of process. It is here, away from scaffolding and skyline, that five distinct bodies of work continue to evolve. Each series deepens his…
Feb. 15 (UPI) — The…
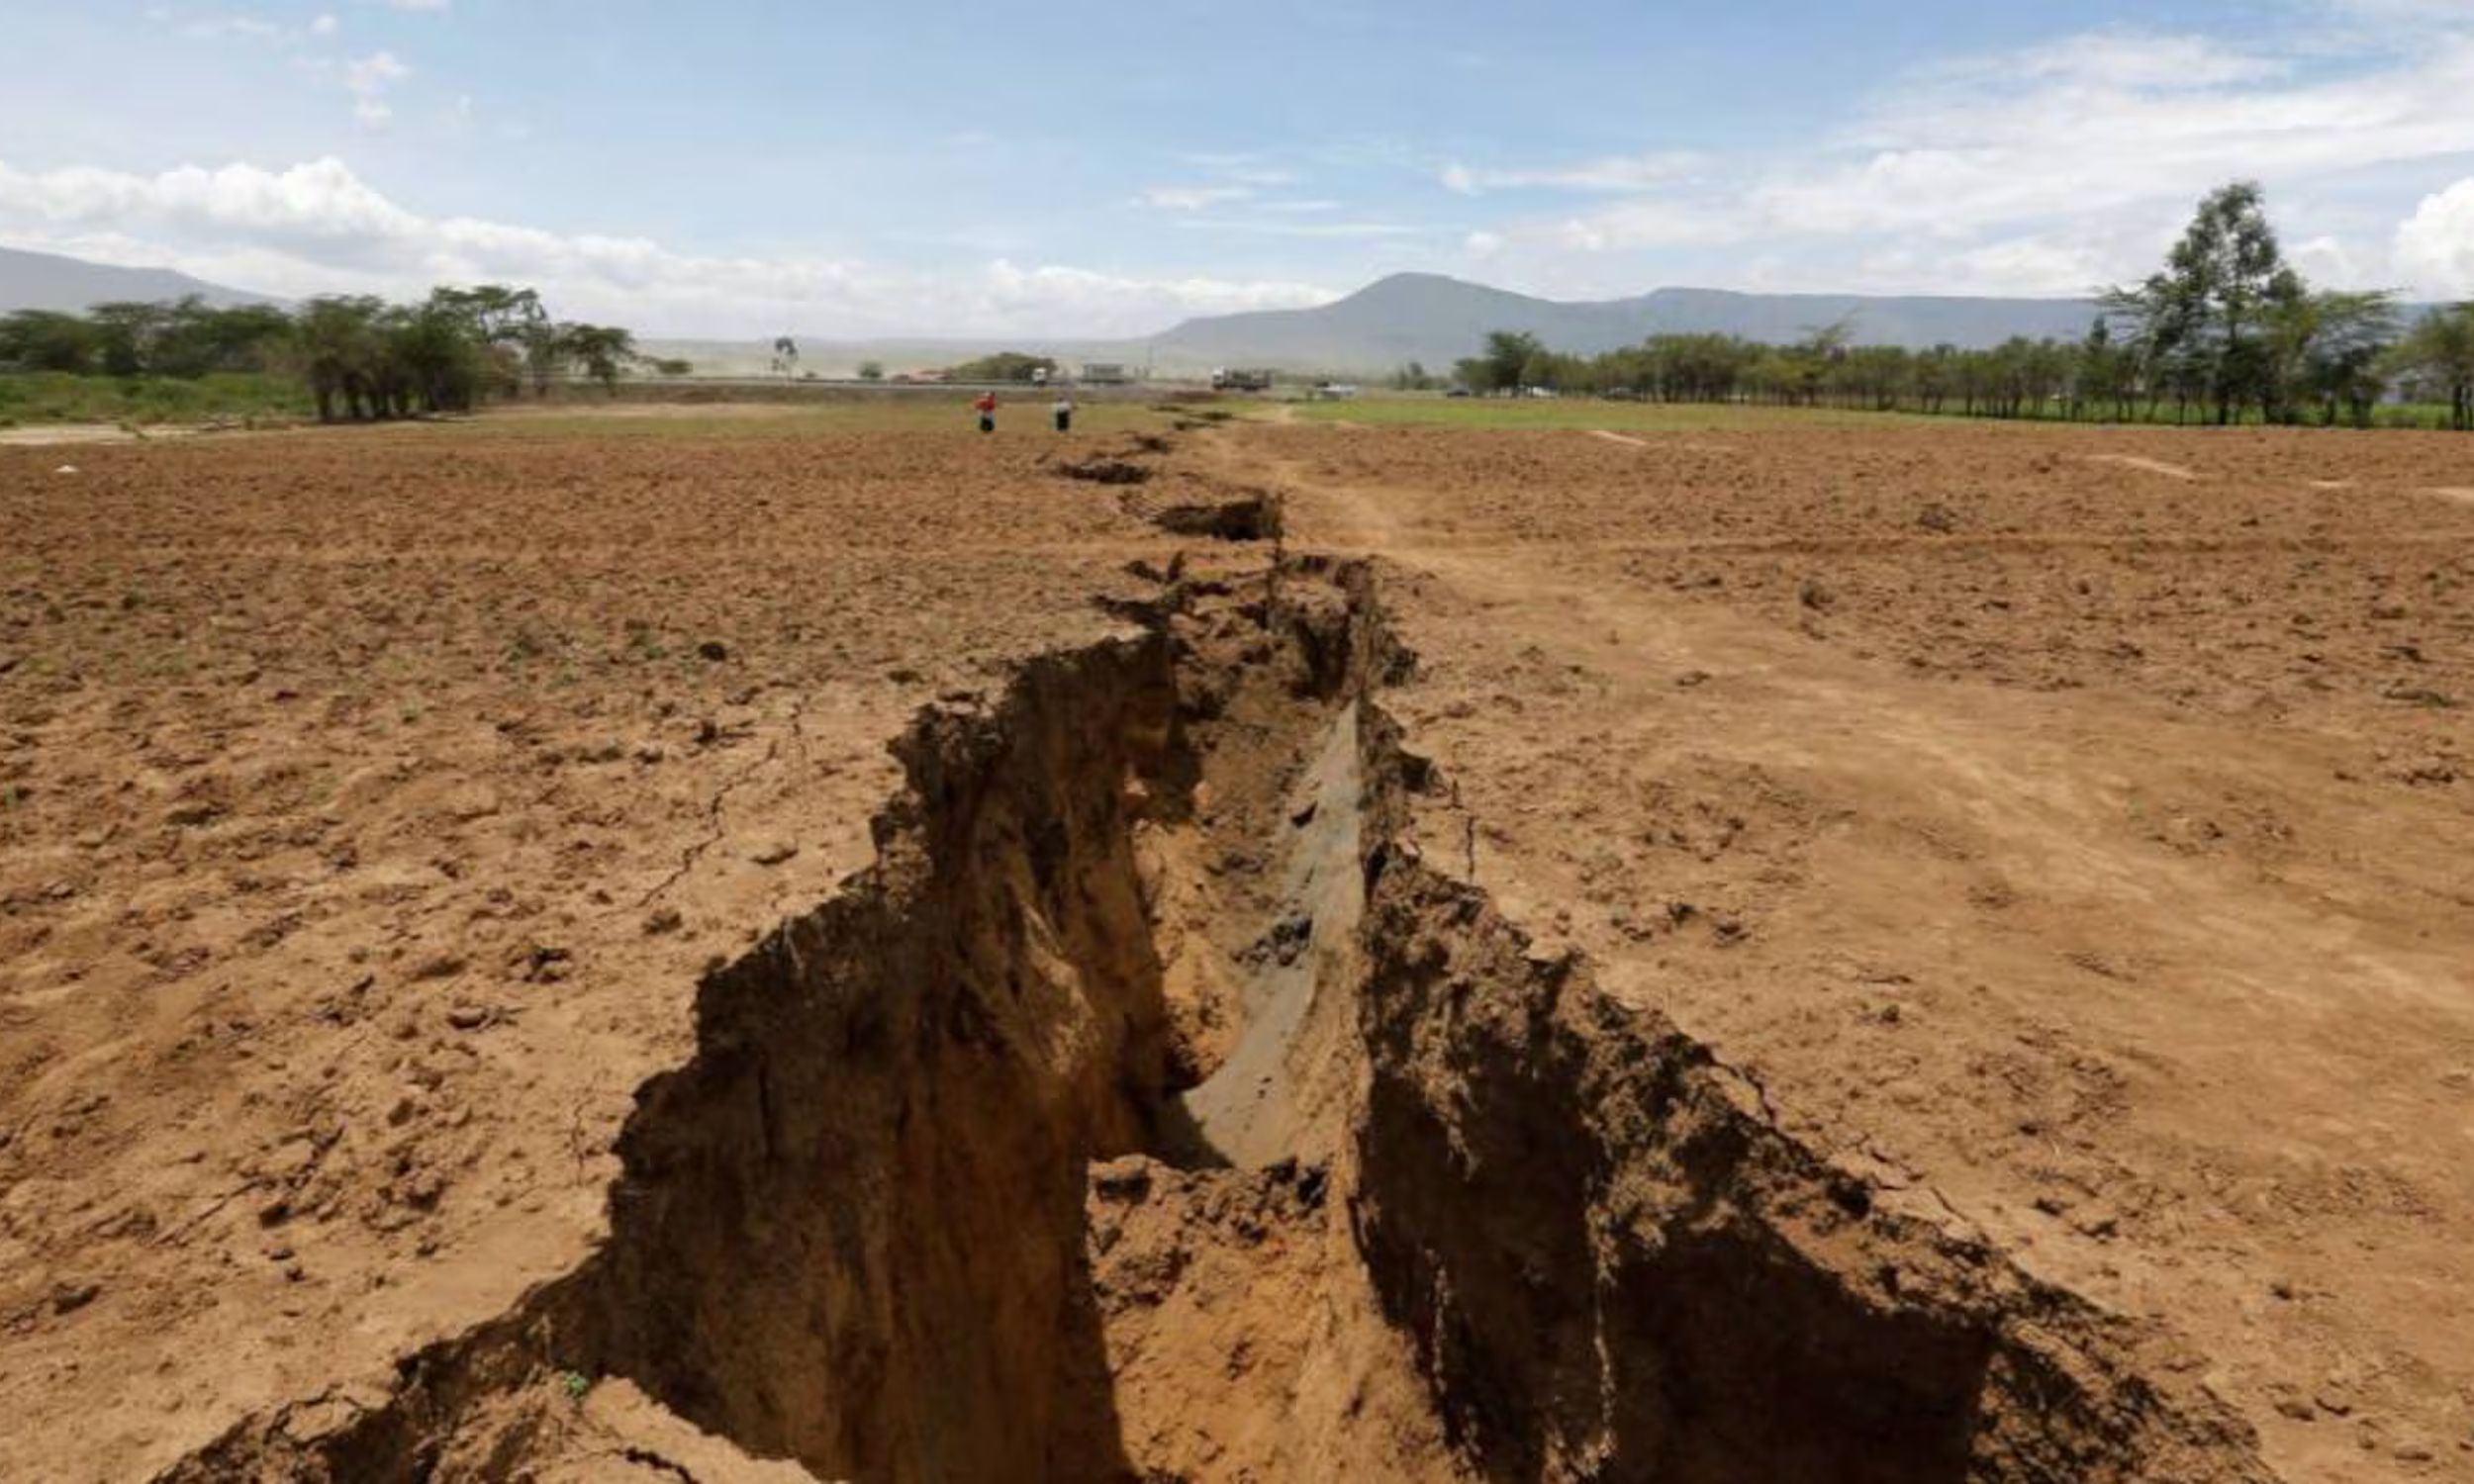
A new mathematical shortcut has cut the core calculations inside earthquake ground-shaking simulations by about 1,000 times without sacrificing accuracy.
That leap in speed could make it far easier for scientists and cities to model how strongly…