QUICK FACTS
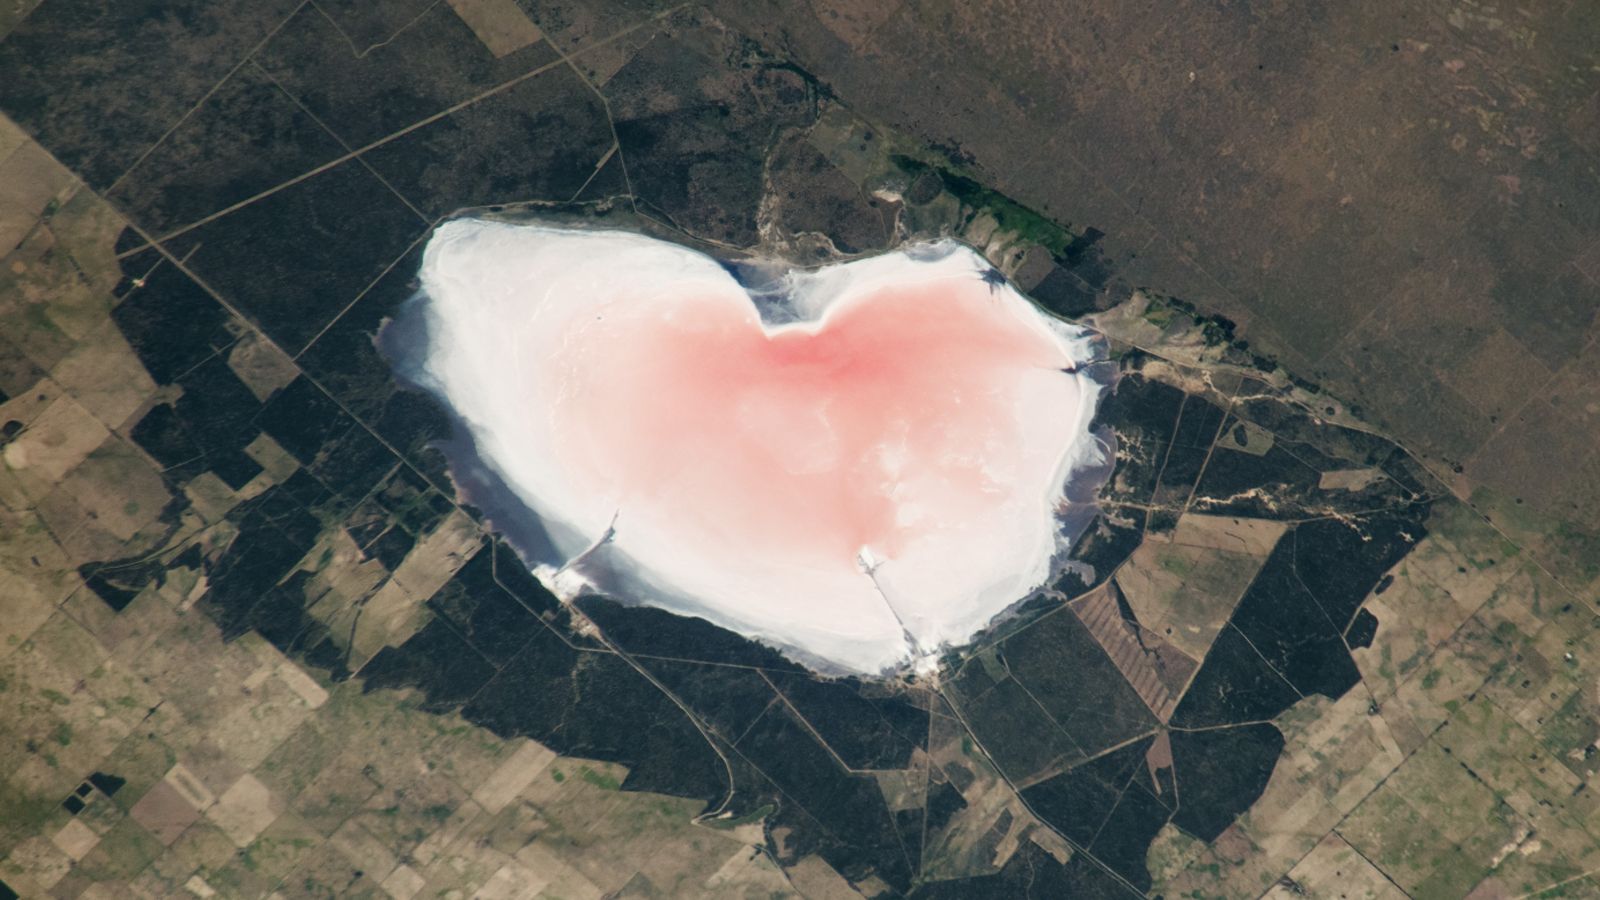
Where is it? Salinas Las Barrancas, Argentina [-38.75293078, -62.95083234]
What’s in the photo? A pink salt lake in the shape of a heart
Who took the photo? An unnamed astronaut on board the International Space Station (ISS)
When was it…
QUICK FACTS
Where is it? Salinas Las Barrancas, Argentina [-38.75293078, -62.95083234]
What’s in the photo? A pink salt lake in the shape of a heart
Who took the photo? An unnamed astronaut on board the International Space Station (ISS)
When was it…
Behzad Nejad, J., Tahmasebi Sarvestani, Z. & Aien, A. Mokhtassi Bidgoli, A. Effect of drought stress and straw mulch of wheat on morpho-physiological characteristics of Sesame. J. Crop Ecophysiol. 12, 393–410 (2018).

Until now the material, made by combining the chemical elements germanium and tin, was thought to be near-impossible to make, although research had suggested that the germanium-tin alloy could in…
Gehl, J. Life between Buildings (Van Nostrand Reinhold, 1987).
Whyte, W. H. The Social Life of Small Urban Spaces (Project for Public Spaces, 1980).
Hou, J., Chen, L., Zhang, E., Jia, H. & Long, Y. Quantifying the usage of small public spaces using…
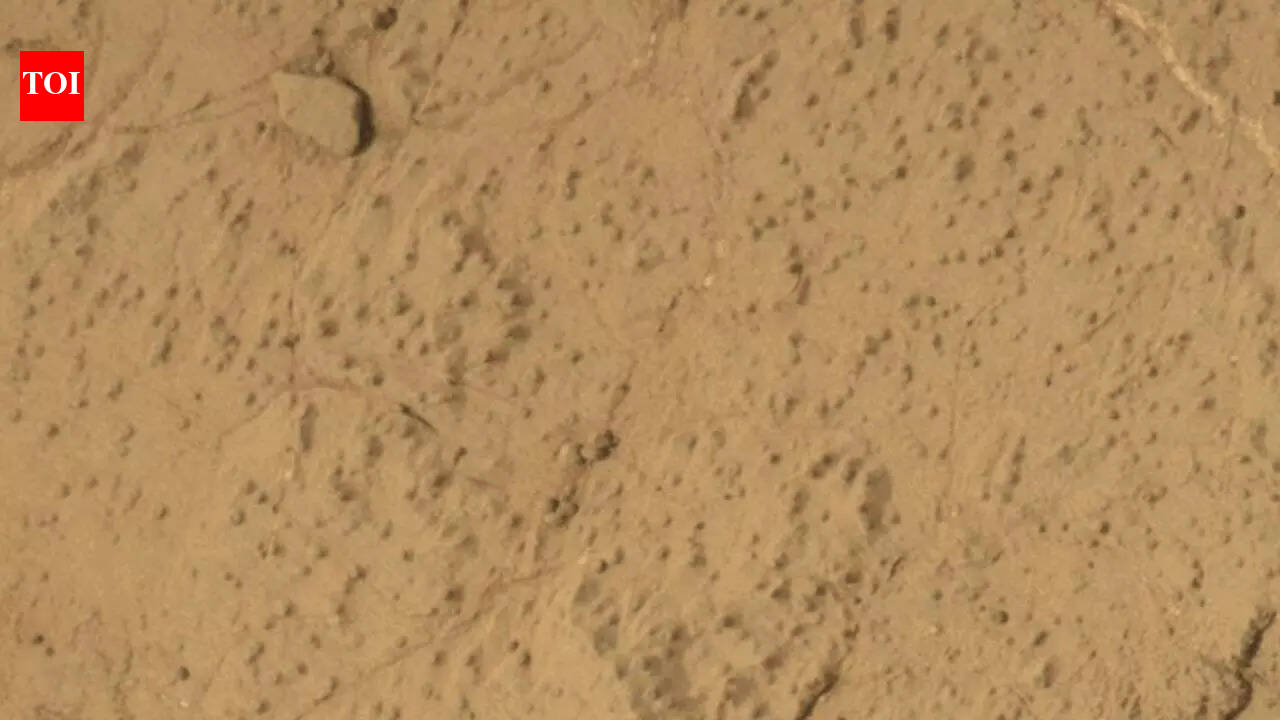
The Curiosity rover, along the lower slopes of Mount Sharp inside Gale Crater, has reportedly uncovered the largest organic molecules ever found on the Red Planet. Decane, undecane, and dodecane are the mid-sized hydrocarbons that look a lot…
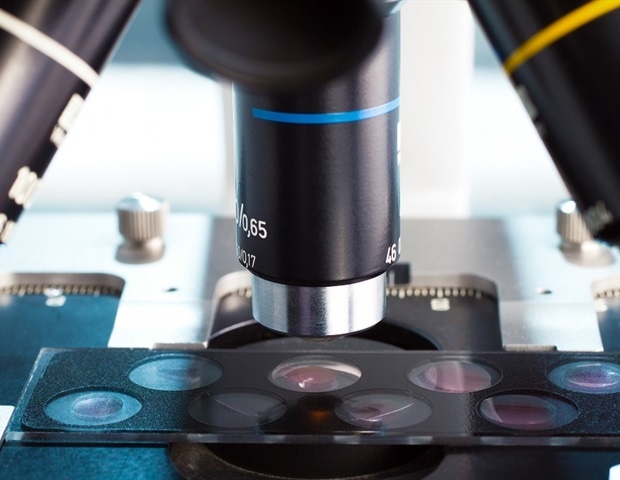
Spatial omics is a new generation of technologies that allow scientists to study cells in their original location within tissues (without isolating or moving them from their environment). Just as a city cannot be understood by…

“The concept of time has troubled philosophers and physicists for thousands of years, and the advent of quantum mechanics has not simplified the problem,” says Professor Hugo Dil, a physicist at EPFL. “The central problem is the general role of…
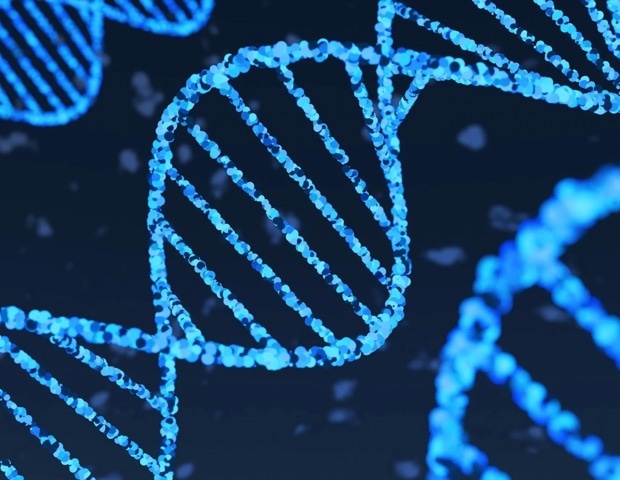
From vaccines and diagnostics to emerging gene-based therapies, RNA molecules are now central to modern medicine. But as their use continues to grow, so does a fundamental challenge: producing RNA quickly, accurately and with the…